Mathematics > Solutions Guide > University of California, Los Angeles LIFESCIENC 30A. Midterm1 Solutions. (All)
University of California, Los Angeles LIFESCIENC 30A. Midterm1 Solutions.
Document Content and Description Below
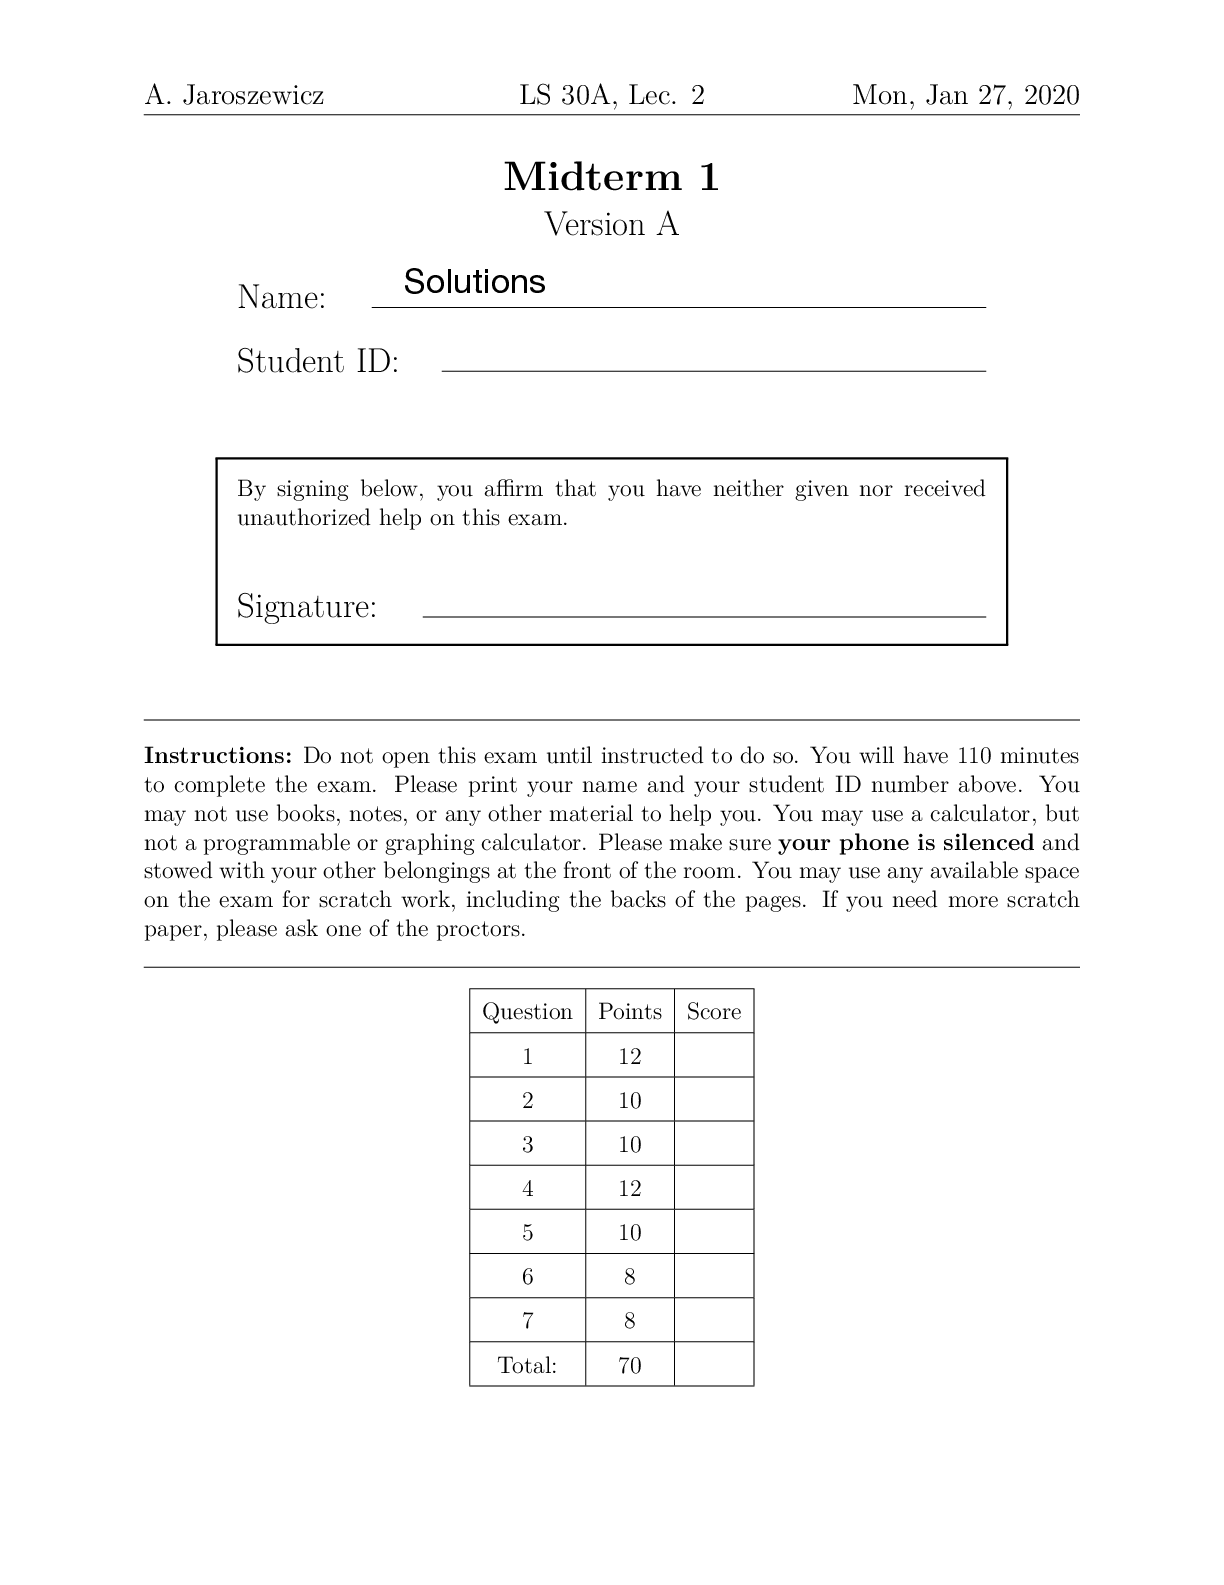
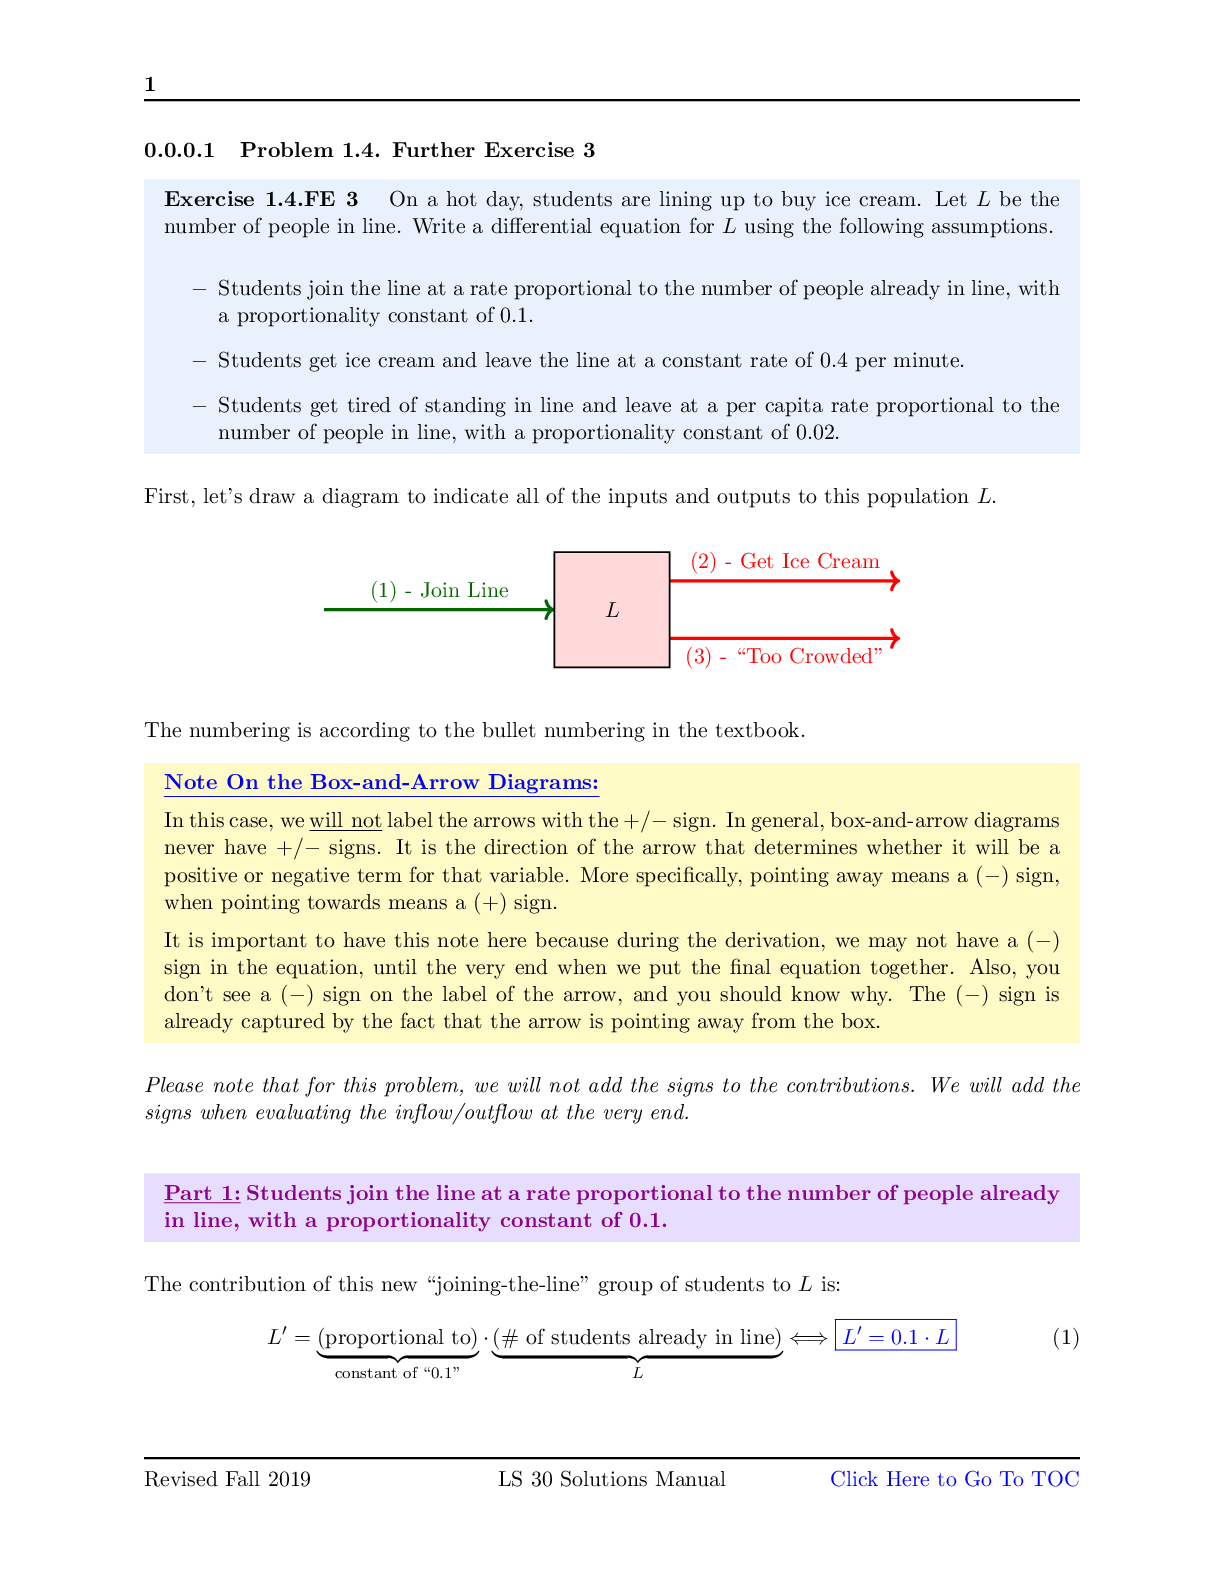
A. Jaroszewicz LS 30A, Lec. 2 Mon, Jan 27, 2020 Midterm 1 Version A Name: Student ID: By signing below, you a!rm that you have neither given nor received unauthorized help on this exam. Signatu... re: Instructions: Do not open this exam until instructed to do so. You will have 110 minutes to complete the exam. Please print your name and your student ID number above. You may not use books, notes, or any other material to help you. You may use a calculator, but not a programmable or graphing calculator. Please make sure your phone is silenced and stowed with your other belongings at the front of the room. You may use any available space on the exam for scratch work, including the backs of the pages. If you need more scratch paper, please ask one of the proctors. Solutions 1. (12 points) The populations of wildebeest (W), lions (L), and hyenas (H) exhibit a complex dynamical relationship in the Serengeti. We will set up a model using the following assumptions: • Each wildebeest gives birth to an average 0.85 calves per year. Also, each year, 12% of the wildebeest population dies due to natural causes (i.e., not due to predation). • Lions have relatively little di!culty catching and consuming wildebeest. Any one lion will consume wildebeest at a rate that is proportional to the number of wildebeest, with a proportionality constant of 0.08. • Hyenas, being smaller, need to hunt wildebeest in small groups. Therefore, when two hyenas come into contact with a wildebeest, there is some chance they will kill it. Use a proportionality constant of 0.4 for this. • The lion population grows at a rate proportional to the amount of food (wildebeest) they eat, with a proportionality constant of 0.15. • Because lions live to be about 10 years old, roughly 10% of them die each year. • Hyenas give birth at a rate proportional to the amount of food (wildebeest) they eat, with a proportionality constant of 0.2. • Hyenas die at a per-capita rate of 0.1. • Finally, because lions and hyenas compete for food, lions often kill hyenas, even though they don’t eat them. The per-capita rate at which lions kill hyenas is proportional to the hyena population, with a proportionality constant of 0.18. Write a set of di"erential equations for this system, and simplify your equations where possible. It is recommended that you start with a compartment diagram. Question 1 continues on the next page. . . Question 1 continued. . . UID: 2. (10 points) Naloxone is a drug (sold under the brand name Narcan) that neutralizes the e"ect of opioids, such as heroin. It is frequently used to treat heroin overdoses. The following assumptions describe a simple model of how naloxone operates in a person su"ering from a heroin overdose. Let N be the concentration of naloxone in the person’s brain tissue, and H be the concentration of heroin. • The naloxone reaches the brain tissue at a constant rate of r. • When naloxone interacts with heroin, it neutralizes the heroin. Use a proportionality constant of k for this. This has the e"ect of removing the heroin from the system. However, it also e"ectively removes the naloxone from the system. (This is equivalent to a chemical reaction N + H ≠≠æ k [nothing].) • Heroin decays naturally at a per-molecule rate of 0.01 per minute. • Naloxone decays naturally at a per-molecule rate of 0.06 per minute. Write a set of di"erential equations for this system. It is recommended that you start with a compartment diagram. UID: 3. (10 points) Consider the following model of a chemical reaction, where T is the temperature and R is the reaction rate: (T RÕÕ = 0 = ≠.10T.5T+ 0 + 0 .5R.2R Draw change vectors onto the graph below, one for each of the states shown as dots, to get a (very rough) sketch of the vector field for this model. 4. Suppose you are studying the outbreak of a disease using a SIRS model (susceptible ! infected ! recovered ! susceptible). When a susceptible (S) person interacts with an infected (I) person, they themselves become infected. Infected people eventually get better, and transition to the recovered (R) category. While in this category, a person has immunity, and cannot become infected again. Eventually, the immunity wears o", and the recovered person once again becomes susceptible. The following change equations describe the susceptible, infected, and recovered populations, in no particular order: (a) (6 points) Which of the variables X, Y , and Z correspond to S, I, and R? (Hint: It may be helpful to draw a compartment (stock/flow) diagram.) Question 4 continues on the next page. . . Question 4 continued. . . UID: (b) (4 points) Identify a feedback loop in this system. What kind of feedback is it? Explain why, briefly. (Hint: It may be helpful to draw a feedback (cause/e!ect) diagram.) (c) (2 points) In this SIRS model, recovered persons can go back to the susceptible stage (i.e., lose their immunity). An SIR model is similar to this, but does not allow recovered persons to return to the susceptible stage, meaning they are forever immune to the disease (as with chickenpox, for example). This is equivalent to setting one of the parameters in the above model (a, b, or c) to 0. Which parameter would you have to set to 0, and why? 5. (a) (4 points) The postal service deals with millions of letters each year. Each letter has a destination address to which it should be sent. Consider the relationship m: {addresses} æ {letters} defined by m(address) = letter with that destination address Is this a function? Why or why not? Consider the relationship a: {letters} æ {addresses} defined by a(letter) = destination address for that letter Is this a function? Why or why not? Question 5 continues on the next page. . . Question 5 continued. . . UID: (b) (6 points) For each of the following relationships, state whether it can be described by a function or not. If not, explain briefly why not. If it can, give a description of the function (including a valid domain and codomain) using the notation f: X æ Y defined by f(something) = other thing i. Each student at UCLA has a 9-digit student ID number. ii. Students at UCLA can join various clubs, such as the origami club, the Malaysian culture club, or the rock climbing club. Consider the relationship between students and clubs, defined by membership in a club. 6. (8 points) The graph below shows a trajectory from a model of Romeo’s and Juliet’s love for each other. = 0 J R One the axes below, sketch the corresponding time series. Be sure to label your axes! 7. (8 points) Suppose you have the following piece of code in SageMath: v = [] for n in srange(3, 10): v.append(n^2) print v When you run this code, what will the output be? [Show More]
Last updated: 1 year ago
Preview 1 out of 11 pages
Reviews( 0 )
Document information
Connected school, study & course
About the document
Uploaded On
Apr 13, 2022
Number of pages
11
Written in

Additional information
This document has been written for:
Uploaded
Apr 13, 2022
Downloads
0
Views
87
.png)


.png)