Mathematics > Solutions Guide > University of California, Los Angeles LIFESCIENC 30A. LS30A MATHEMATICS FOR LIFE SCIENTISTS-1 F-17 F (All)
University of California, Los Angeles LIFESCIENC 30A. LS30A MATHEMATICS FOR LIFE SCIENTISTS-1 F-17 Final Exam Solutions.
Document Content and Description Below
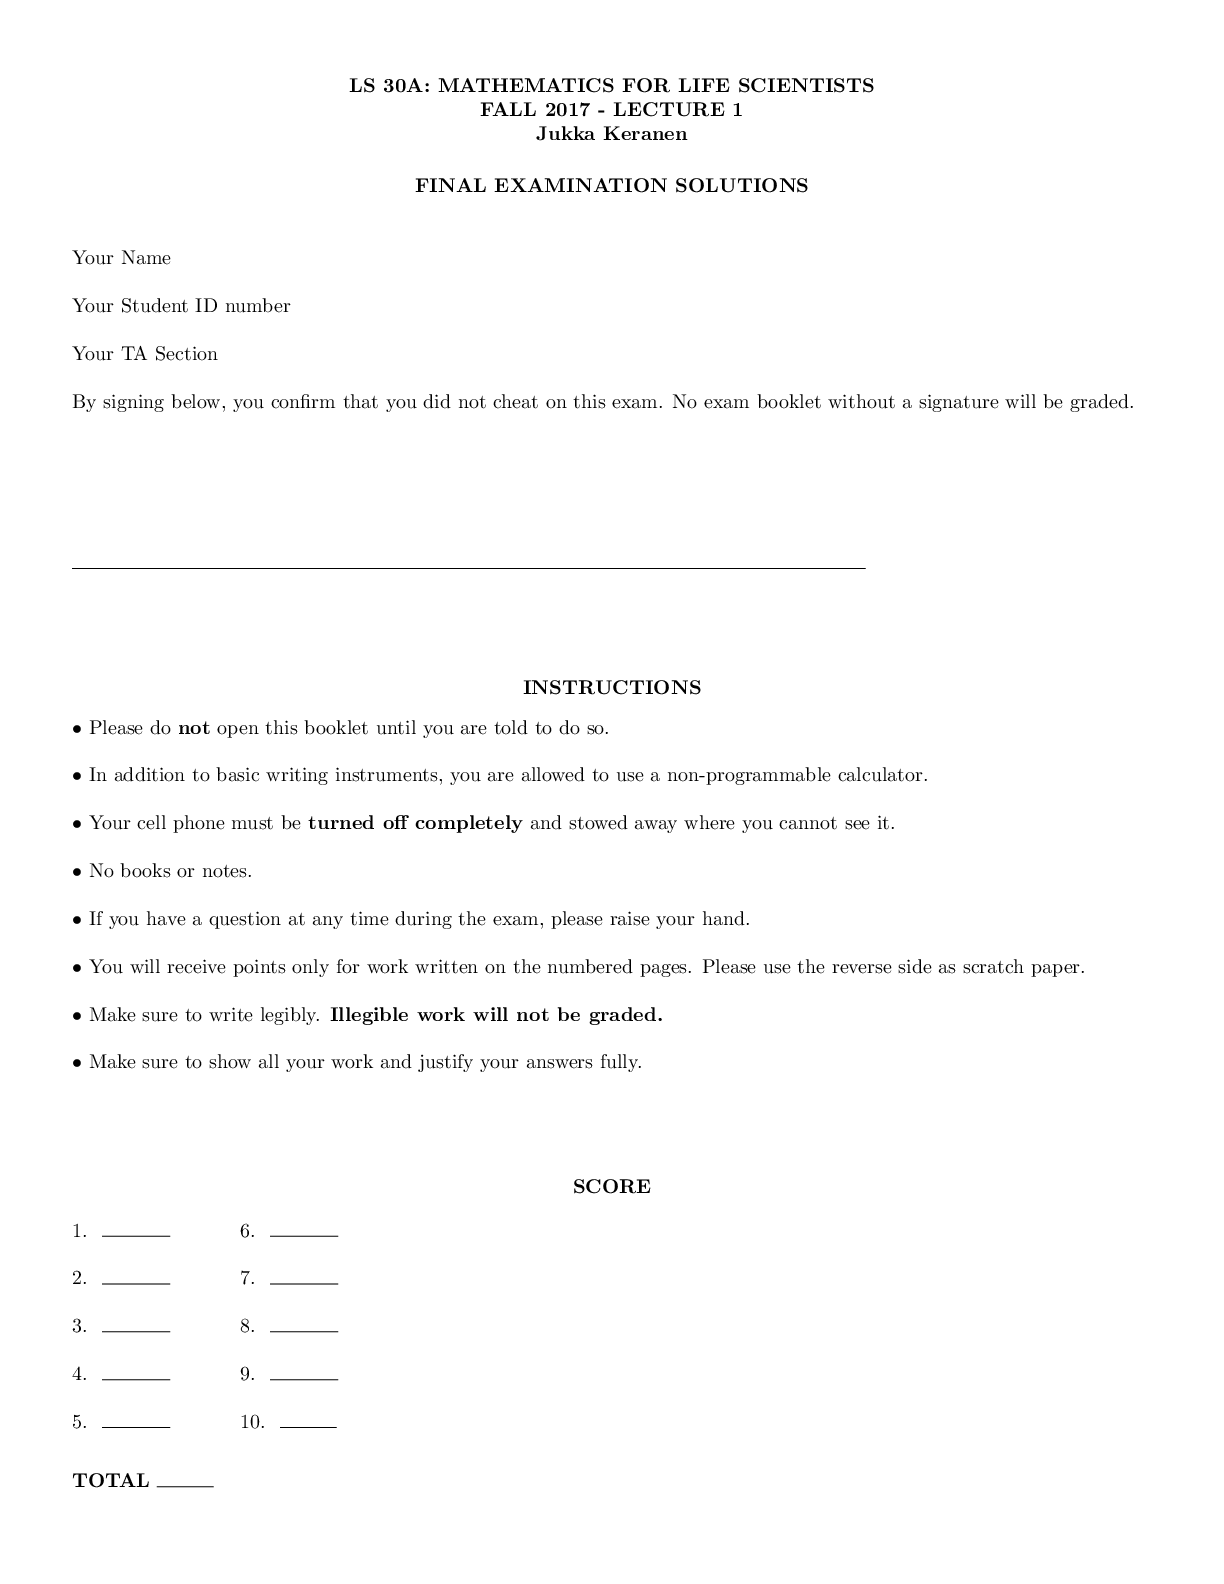
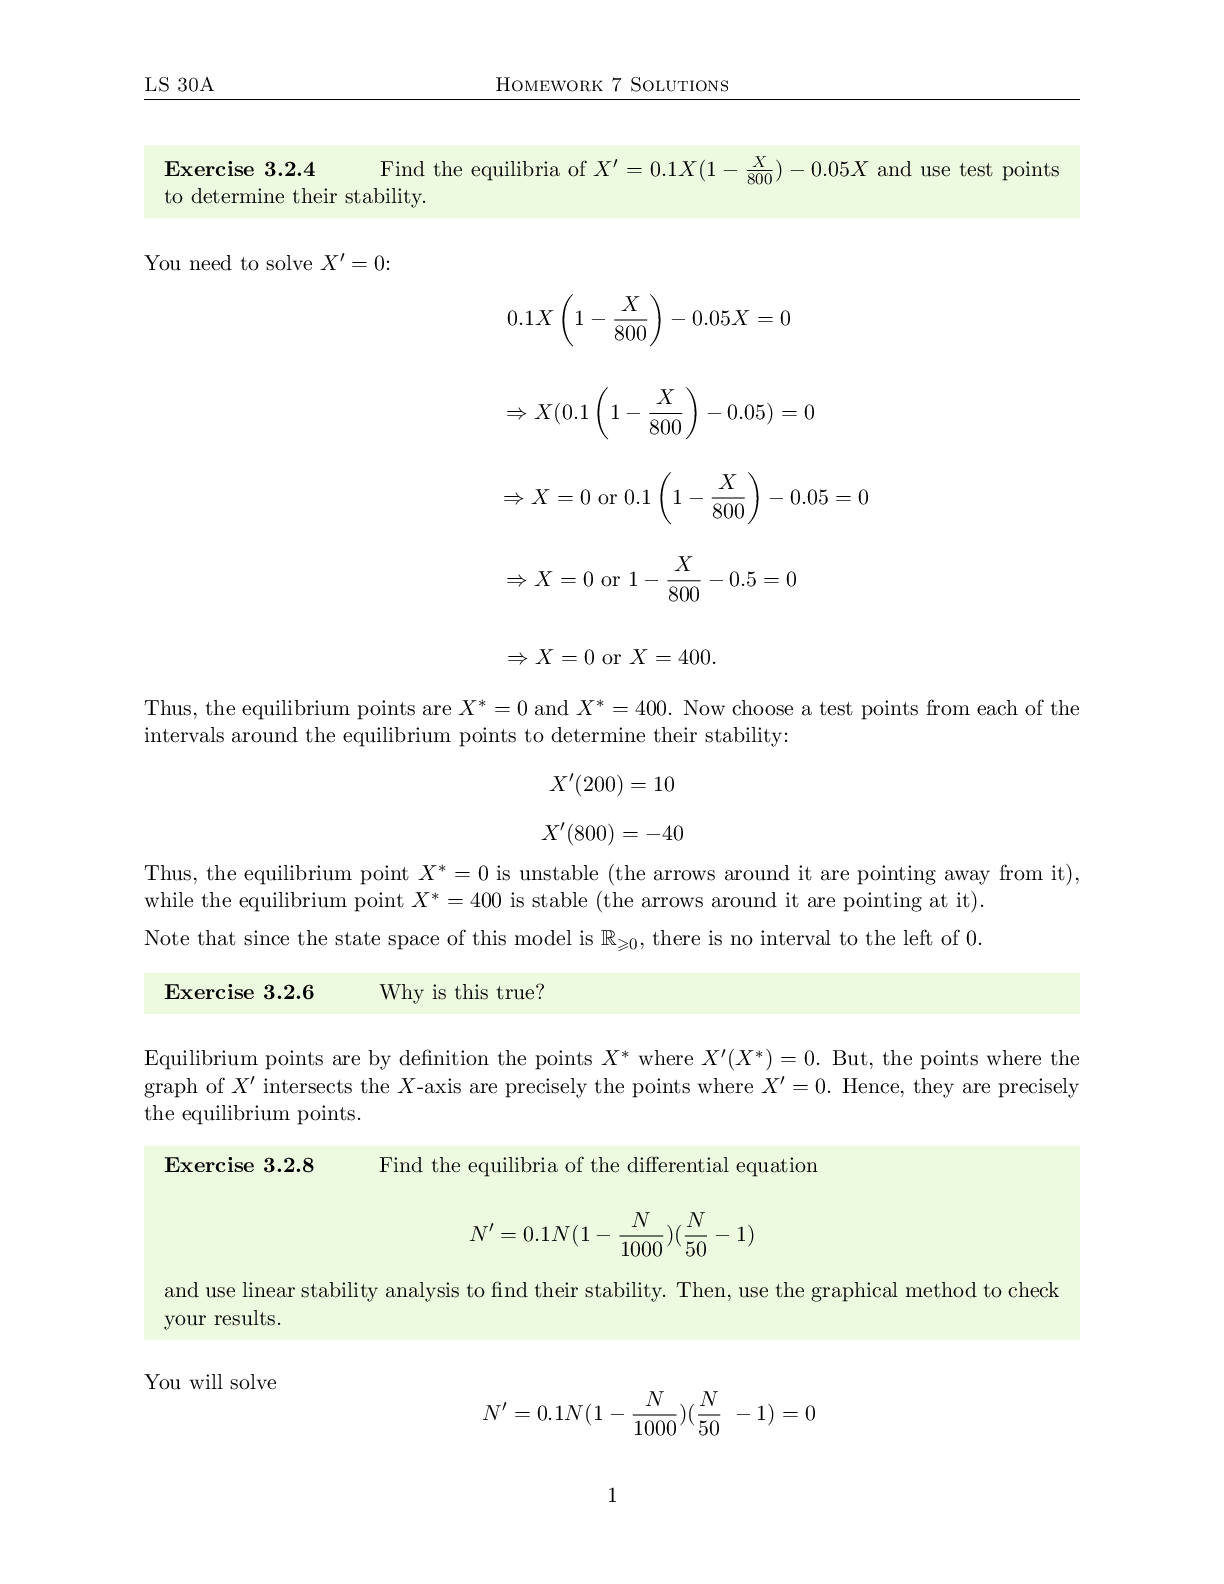
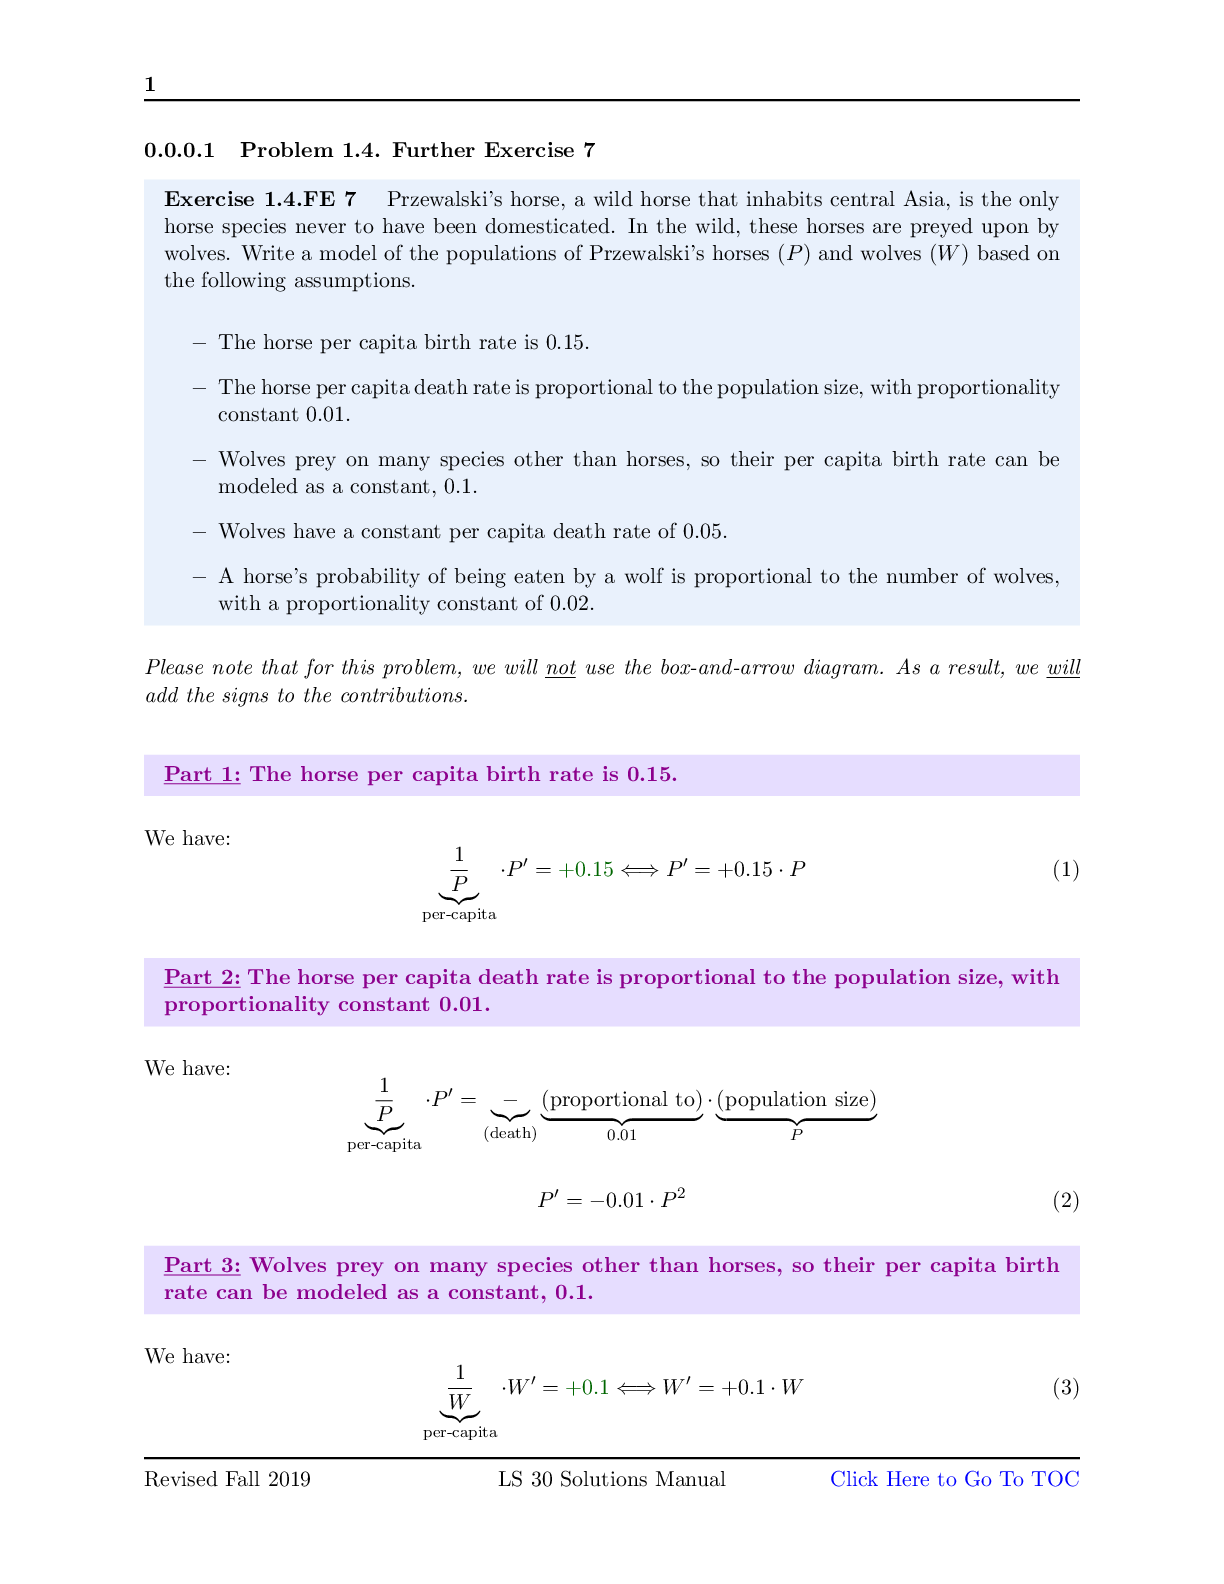
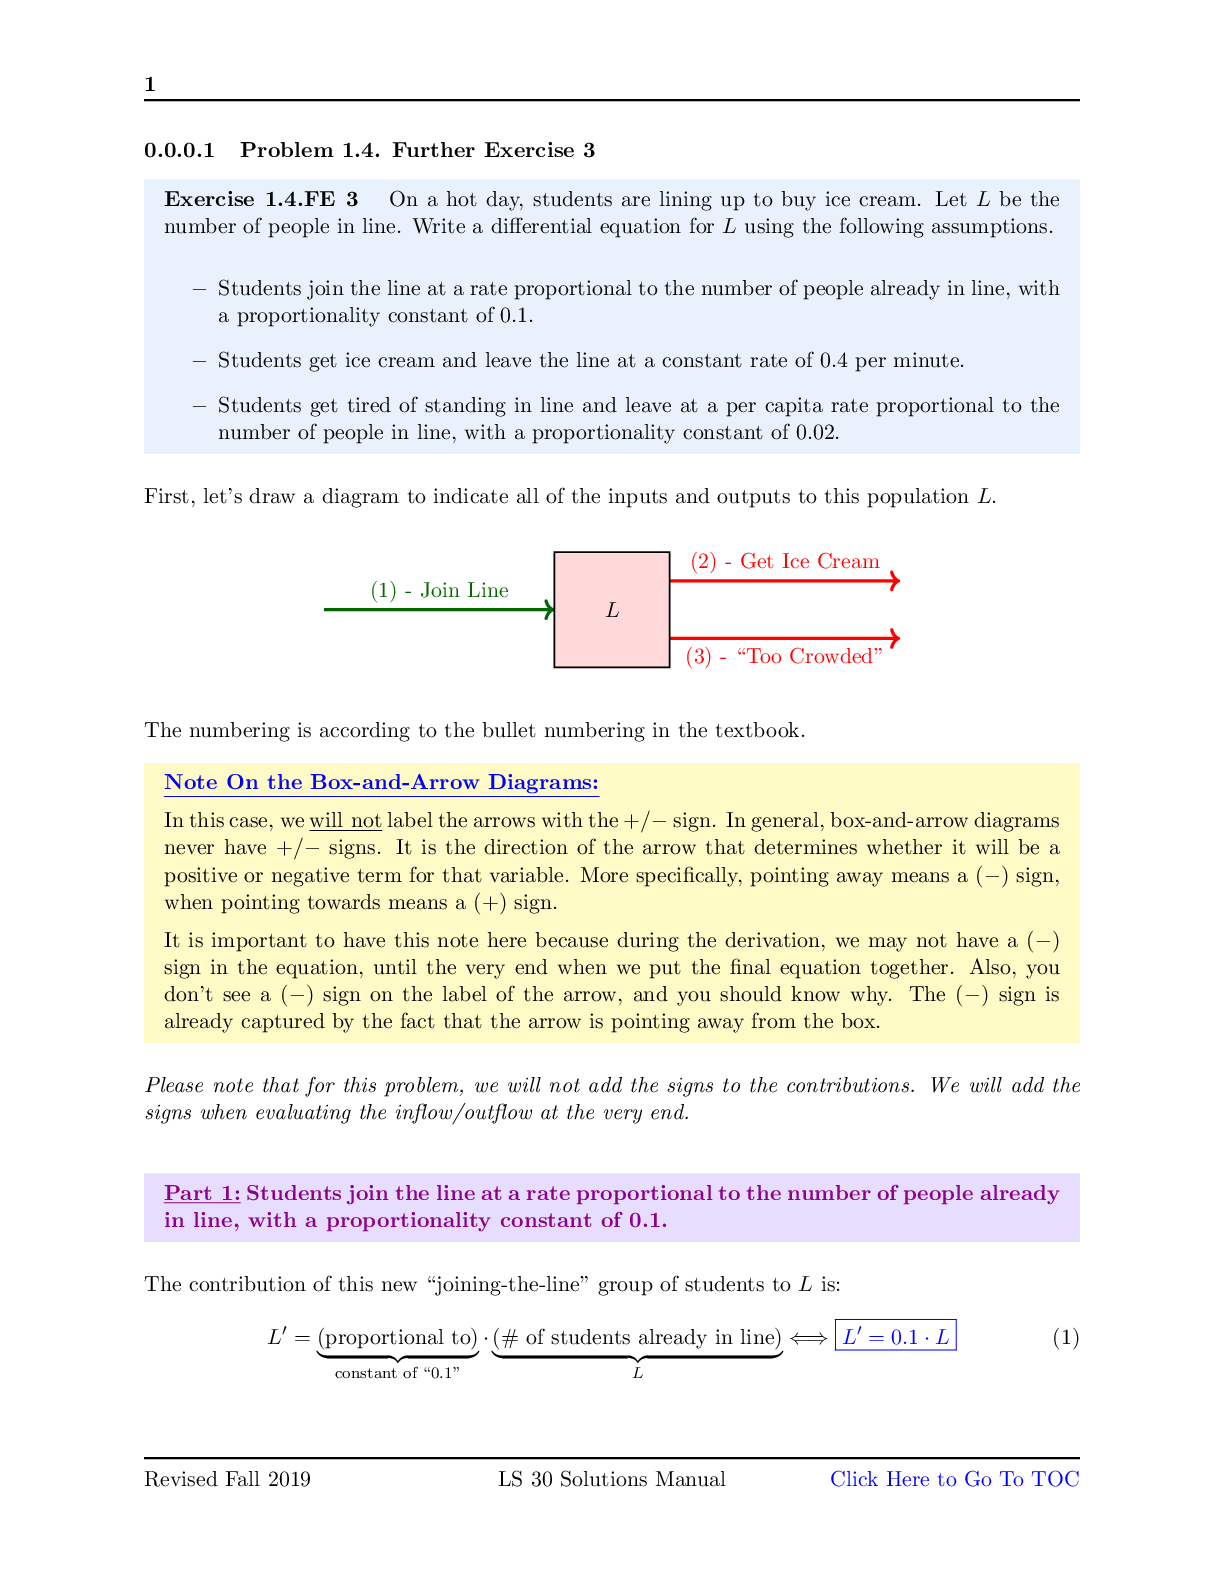
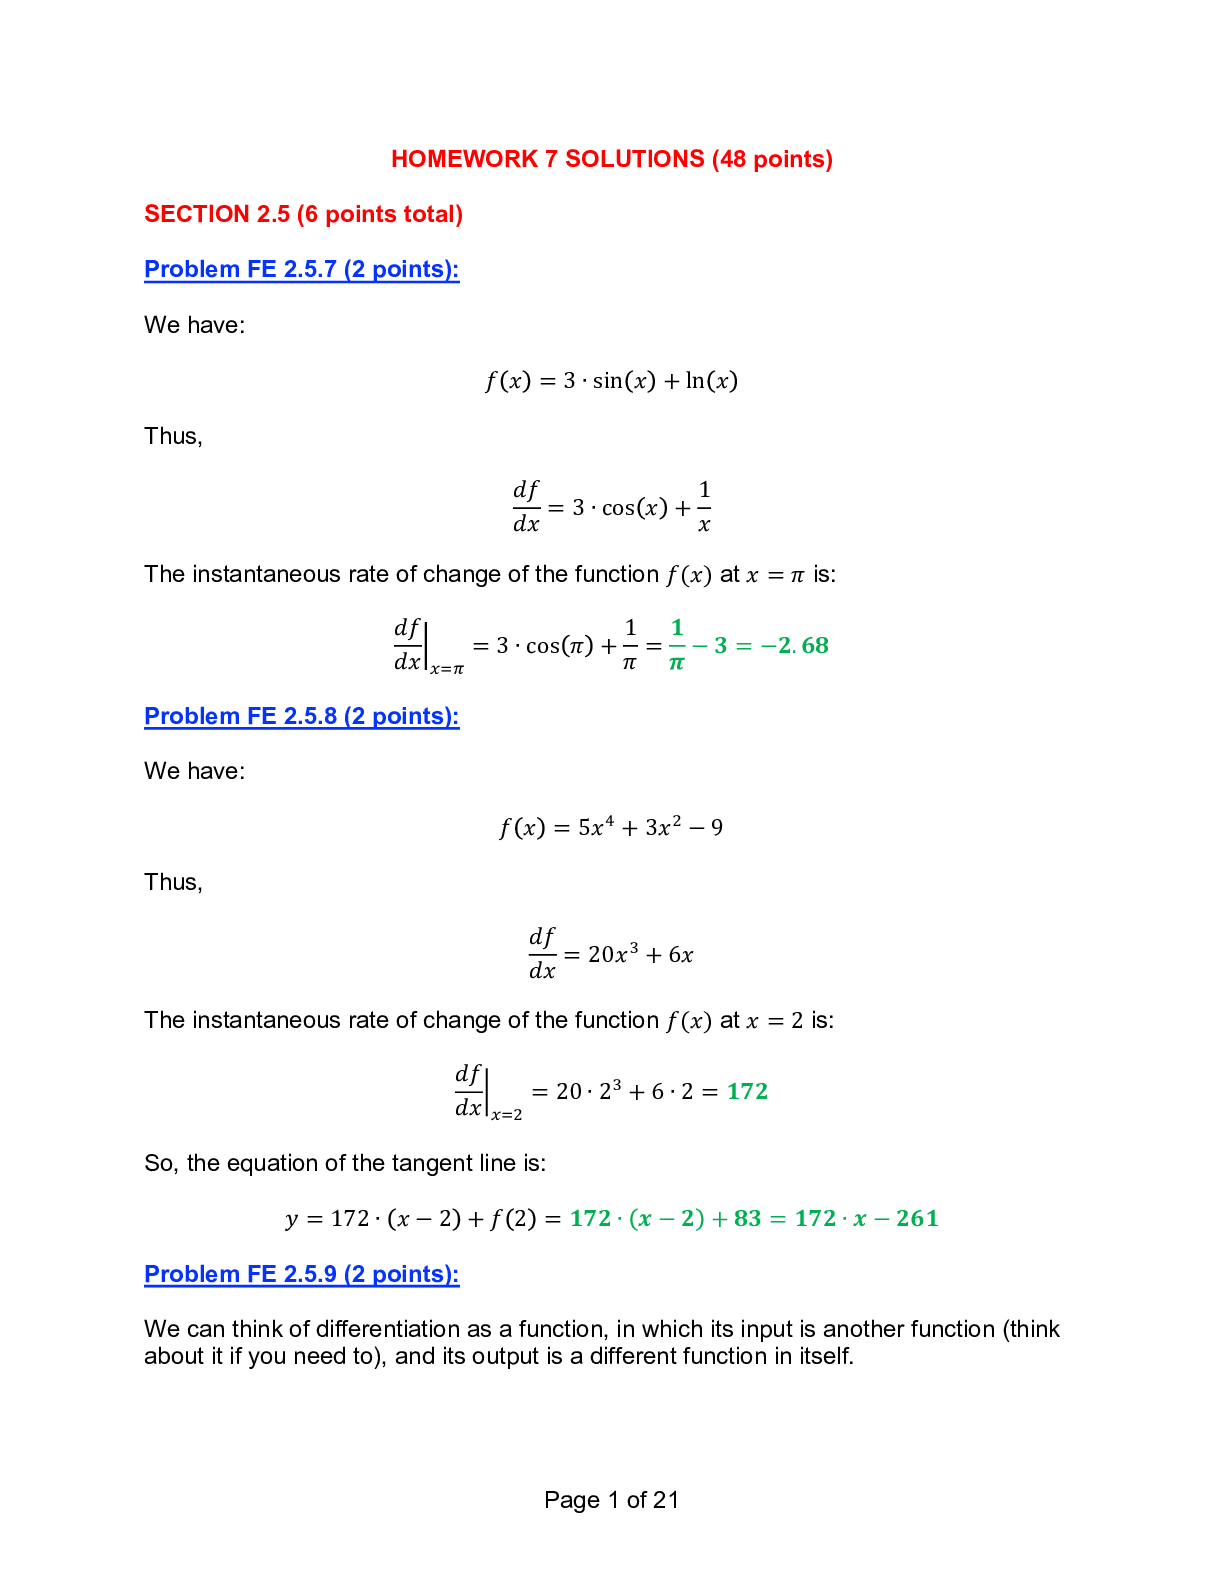
LS 30A: MATHEMATICS FOR LIFE SCIENTISTS FALL 2017 - LECTURE 1 Jukka Keranen FINAL EXAMINATION SOLUTIONS Your Name Your Student ID number Your TA Section By signing below, you confirm that you d... id not cheat on this exam. No exam booklet without a signature will be graded. INSTRUCTIONS • Please do not open this booklet until you are told to do so. • In addition to basic writing instruments, you are allowed to use a non-programmable calculator. • Your cell phone must be turned off completely and stowed away where you cannot see it. • No books or notes. • If you have a question at any time during the exam, please raise your hand. • You will receive points only for work written on the numbered pages. Please use the reverse side as scratch paper. • Make sure to write legibly. Illegible work will not be graded. 1. The elves at Santa’s workshop at North Pole are making wooden toy trains. The process of making a toy train begins by carving the parts, which are then painted, and finally assembled into a complete train, to be delivered to children all over the world. Santa wants to make sure that all the toys he brings are of highest quality. Thus, the manufacturing process proceeds according to the following rules. • At the carving station, pieces of wood are being carved into various train components (C) at a rate of 100 components per hour. • Of all the carved components, 20 percent are rejected and thrown away. • In order to avoid overwhelming the painting station, the carved components are sent to the painting station at a per component rate proportional to the reciprocal of the number of components that have been painted (P), with a constant of proportionality of 0.1 • Of all the painted components, 30 percent are found to be lacking in quality and thrown away. • In order to keep the assembly station well-supplied, the painted components are sent to the assembly station at a per component rate proportional to the number of components at the assembly station (A), with a constant of proportionality of 0.2. • The elves at the assembly station complete the trains (T) at a rate proportional to the number of components at the assembly station, with a constant of proportionality of 1/2. • Finally, of all the completed trains, 1 in 7 are found to be lacking in quality and thrown away. a) (4 pts) Draw a flow chart of the toy train manufacturing process. course: it is not literally a flow of components. On our exam, however, you will not be penalized for representing it as a solid \flow" arrow. 1 b) (6 pts) Write down a differential equation model of the toy train manufacturing process. 2 2. Life under the sea! A type of fish, gobies (G), live in a symbiotic relationship with shrimp (S) on coral reefs all over the world. The shrimp digs a burrow in the sand where both the shrimp and the goby live and are safe from predators. As much as they like their little hole, they both need to leave it once in a while in order to find food. Once outside, the shrimp, being nearly blind, is vulnerable to predators such as the rock bass (B). In case of danger, the goby touches the shrimp with its tail, and they both quickly retreat into their burrow. a) (8 pts) Write down a differential equation model of the goby-shrimp-bass system, by using the following assumptions. • Since gobies are able to forage more effectively when they can retreat to a burrow built by a shrimp partner, gobies have a per capita birth rate proportional to the number of shrimp, with a constant of proportionality of 0.01. • 2 percent of gobies die every month. • Since shrimp are able to forage more effectively when gobies are guarding them, shrimp have a per capita birth rate proportional to the number of gobies, with a constant of proportionality of 0.03. • 40 percent of shrimp die every month for reasons other than predation. • Since the goby helps the shrimp avoid bass attacks, each bass catches shrimp at a rate proportional to the ratio of shrimp to gobies, with a constant of proportionality of 0.5. • The bass have a birth rate proportional to the number of shrimp they eat, with a constant of proportionality of 0.06. • 7 percent of bass die each month. b) (4 pts) Describe both a positive and a negative feedback loop in this model. (Hint: a diagram might help.) 3. This coming Winter Quarter, the flu will be spreading among LS 30B students, because all of you didn’t get the flu shot like I told you to. We will model the number of susceptible individuals (S) and infected individuals (I) by using the differential equations S0 = -0:05SI I0 = -0:2I + 0:05SI a) (2 pts) Explain what each of the two terms in the second equation represents. The second term represents the rate at which susceptible individuals are contracting the flu from infected individuals. b) (8 pts) Suppose we start with 200 susceptible individuals and 2 infected ones. Use Euler’s method with a step size of 0.1 weeks to determine the approximate numbers of susceptible and infected individuals at t = 0:2 weeks. (0.2 weeks is about 34 hours, and the number of infected individuals has nearly quadrupled. I strongly encourage you to run a CoCalc simulation to see what happens in a week... and think about maybe getting that flu shot before you come back to school after the break :) 5 4. By using the differentiation rules we learned in this course, find df dx for each of the following functions f(x). Indicate clearly which rules you are using at each step of your calculation. points. df dx = (3x2)(x6 + x4 + 3)(px + 3x) + (x3 + 1)((6x5 + 4x3)(px + 3x) + (x6 + x4 + 3)(2p1 x + 3)), by using the Product Rule twice, and the Power Rule within the factors. by using the Quotient Rule, and the Power Rule within the factors. 6 By using the differentiation rules we learned in this course, find df dx x=1 for the following function f(x). Indicate clearly which rules you are using at each step of your calculation. c) (4 pts) f(x) = (x6 + x4 + 3)7 5. A solar power plant has a power output of P(t) kW of energy per hour, where t represents time. Suppose that from 6 AM to 12 PM (noon), the power output P(t) is given by P(t) = (t - 6)2. a) (4 pts) By using time interval ∆t = 1 hour, write down and evaluate the Riemann sum approximating the total energy produced by the power plant over the period from t = 6 (6 AM) to t = 12 (12 PM). Thus, the total energy produced is approximately 55 kWh. b) (4 pts) Write down and evaluate the definite integral that represents the total energy produced by the power plant over the period from t = 6 (6 AM) to t = 12 (12 PM). Thus, the total energy produced is 72 kWh. c) (2 pts) Explain why the number your found in part b) is larger than the number you found in part a). 8 6. You are studying a differential equation model, X0 = f(X). Suppose you know the system has equilibrium points at b) (2 pts) Sketch the vector field for this system. For full 2 pts, it is not necessary to say \in the basin of attraction". 9 7. The diagram below shows several trajectories of a 2-variable system of differential equations. a) (4 pts) Indicate the location of all the equilibrium points in the diagram, then list them in the space below and indicate their type (in the classification of equilibrium points in 2 dimensions that we learned). nodes? Justify your answer as clearly as you can. 8. Romeo and Juliet’s love (or hatred) for each other can be modeled by the following system of differential equations, where J represents Juliet’s love for Romeo (or hatred if negative), and R represents Romeo’s love for Juliet (or hatred if negative): J0 = JR - 2J - J2 R0 = J2 - R - 4 a) (4 pts) On the axes provided on the next page, draw the nullclines of this model. Make sure to indicate clearly which ones are the J-nullclines, which ones the R-nullclines. b) (3 pts) Identify the equilibrium points of this model in the diagram, and also write down their coordinates here. Solution (-2; 0); (0; -4); (3; 5) c) (8 pts) By picking a test point from within each region demarcated by the nullclines, determine for each equilibrium point whether it is stable or unstable. Explain briefly the main idea of the method you are employing. points, whereas in the third case, all arrows in the regions adjacent to the equilibrium point are pointing at it. 11 The arrows are not, and do not need to be, drawn to scale. Remember, we only care about the general direction of the arrows in each segment. 12 9. Melanin is a pigment in our skin that protects us from skin damage due to sun exposure. A startup biotech company is testing melanin-treatment for skin cancer. They make a mathematical model to design a treatment strategy. In the model bifurcation diagram given below, M∗ represents the final melanin count at the end of the treatment and d represents the parameter controlling the treatment efficacy. Healthy skin requires melanin levels to lie between 107 and 109. Answer the following questions and help the company design a clinical trial for test patients with different requirements. a) (6 pts) List the bifurcations that occur in this diagram. For each one, state what type of bifurcation it is and at what value of d it occurs. b) (2 pts) For Patient-1 with an abnormally high initial melanin count of 1010 and treatment efficacy d = 10, can you suggest a strategy to restore normal levels of melanin? but noticed that this did not restore healthy melanin levels. Why isn’t this treatment working? Solution The state is in the basin of attraction of the low stable equilibrium. d) (2 pts) For Patient-2, can you help the physician come up with a suitable strategy to restore healthy levels of melanin? 14 10. An enzyme is produced at a rate that depends on the current intracellular concentration, with maximal production rate ν, and is degraded at a rate proportional to the current intracellular concentration, with proportionality constant µ. In other words, if C is the intracellular enzyme concentration, then C satisfies the differential equation below: C0 = ν C k + C - µC (6 points) Use the plot of the production rate and degradation rate of the enzyme in the figure above to draw a bifurcation diagram for this system as µ varies on the empty axes below. Don’t worry about exact parameter values, but in case you want them, the parameter values used to make the plot above are ν = 1; k = 1 and µ = 0:1; 0:3; and 1:2. Be sure to visually distinguish between stable and unstable equilibria. [Show More]
Last updated: 1 year ago
Preview 1 out of 16 pages
Reviews( 0 )
Document information
Connected school, study & course
About the document
Uploaded On
Apr 13, 2022
Number of pages
16
Written in
Additional information
This document has been written for:
Uploaded
Apr 13, 2022
Downloads
0
Views
84

.png)







.png)


