*NURSING > EXAM > Chamberlain College of Nursing - NR 503 Final Exam N Questions and Answers Rated A (All)
Chamberlain College of Nursing - NR 503 Final Exam N Questions and Answers Rated A
Document Content and Description Below
NR 503 Final Exam Chapters 2-4 Question 1 Which of the following is a condition which may occur during the incubation period? • Onset of clinical illness • Receipt of infection • Signs a... nd symptoms of disease • Transmission of infection • Isolation of disease carrier through quarantine That's correct! The incubation period is defined as the interval from receipt of infection to the time of onset of clinical illness. Accordingly, individuals may transmit infectious agents during the incubation period as they show no signs of disease that would enable the isolation of sick individuals by quarantine. Question 2 Chicken pox is a highly communicable disease. It may be transmitted by direct contact with a person infected with the varicella-zoster virus (VZV). The typical incubation time is between 10 to 20 days. A boy started school 2 weeks after showing symptoms of chicken pox including mild fever, skin rash, and fluid-filled blisters. One month after the boy returned to school, none of his classmates had been infected by VZV. The main reason was: • Herd immunity • All had been immunized prior to the school year • Contact was after infectious period • Subclinical infections were not yet detected • Disease was endemic in the class That's correct! The disease is spread by contact with an infected individual who can transmit the agent (VZV) to immunologically naive persons during the incubation period and for several days after onset of clinical illness. Since the boy started school 14 days after showing signs consistent with chicken pox, it is most likely that he was no longer infectious. Question 3 The ability of a single person to remain free of clinical illness following exposure to an infectious agent is known as: • Hygiene • Vaccination • Herd immunity • Immunity • Latency That's correct! Immunity is the capacity of a single individual to avoid disease susceptibility when exposed to an infectious agent. Herd immunity is a population characteristic. For certain diseases, individual immunity can be acquired by vaccination, but this is not true for all infectious diseases. Question 4 Which of the following is characteristic of a single-exposure, common-vehicle outbreak? • Long latency period before many illnesses develop • There is an exponential increase in secondary cases following initial exposures • Cases include only those who have been exposed to sick persons • The epidemic curve has a normal distribution when plotted against the logarithm of time • Wide range in incubation times for sick individuals That's correct! Single-exposure, common-vehicle outbreaks involve a sudden, rapid increase in cases of disease that are limited to persons who share a common exposure. Additionally, few secondary cases develop among persons exposed to primary cases. A histogram of the outbreak can plot the number of cases by time of disease onset. In single-exposure, common-vehicle outbreaks, a log transformation of the time of disease onset will often take on the characteristic shape of a normal distribution (i.e., a bell curve) with the median incubation time found at the peak of the curve. Question 5 What is the diarrhea attack rate in persons who ate both ice cream and pizza? • 39/52 • 21/70 • 39/67 • 51/67 • none of the above That's correct! The attack rate in this example is defined as the number of persons who develop diarrhea divided by the total number of people at risk. In this example, the at-risk group is those who have eaten both ice cream and pizza. Of these 52 persons, 39 developed diarrhea. Question 6 What is the overall attack rate in persons who did not eat ice cream? • 30% • 33% • 35% • 44% • 58% That's correct! The attack rate is the number of persons with diarrhea (14 + 9) divided by the total number of persons who did not eat ice cream (40 + 30). Question 7 Which of the food items (or combination of items) is most likely to be the infective item(s)? • Pizza only • Ice cream only • Neither pizza nor ice cream • Both pizza and ice cream • Cannot be assumed from the data shown That's correct! Among persons eating ice cream, over 70% developed diarrhea regardless of their pizza consumption (39/52 and 11/15). Among both groups of persons who did not eat ice cream, each attack rate was equal to or less than 35% (14/40 and 9/30). Question 8 Which of the following reasons can explain why a person who did not consume the infective food item got sick? • They were directly exposed to persons who did eat the infective food item • Diarrhea is a general symptom consistent with a number of illnesses • There may have been an inaccurate recall of which foods were eaten • All of the above • None of the above That's correct! Without knowledge as to the specific agent in this instance, it is also likely that it can be spread by direct contact with infected persons. Since diarrhea is a general disease symptom, it is possible that several infectious agents may be present at this meal or others eaten during the same time period. Further, information regarding food consumption may have been collected long after the disease episode. This may have led persons to incorrectly remember the foods that they consumed. Question 9 An outbreak of gastroenteritis occurred at a boarding school with a student enrollment of 846. Fifty-seven students reported symptoms including vomiting, diarrhea, nausea, and low-grade fever between 10 p.m. on September 24 and 8 p.m. on September 25. The ill students lived in dormitories that housed 723 of the students. The table below provides information on the number of students per type of residence and the number reporting illnesses consistent with the described symptoms and onset time. Calculate the attack rate among all students at the boarding school. That's correct! The answer is found by dividing the total number of cases (57) by the total number of students (846). This equals 6.7%. Question 10 An outbreak of gastroenteritis occurred at a boarding school with a student enrollment of 846. Fifty-seven students reported symptoms including vomiting, diarrhea, nausea, and low-grade fever between 10 p.m. on September 24 and 8 p.m. on September 25. The ill students lived in dormitories that housed 723 of the students. The table below provides information on the number of students per type of residence and the number reporting illnesses consistent with the described symptoms and onset time. Calculate the attack rates for boys and girls separately. That's correct! For boys, the attack rate includes all cases (40 + 3) divided by the total number of students who are boys (380 + 46). The attack rate is 10.1%. For girls, the attack rate includes all cases (12 + 2) divided by the total number of students who are girls (343 + 77). The attack rate is 3.3%. Question 11 An outbreak of gastroenteritis occurred at a boarding school with a student enrollment of 846. Fifty-seven students reported symptoms including vomiting, diarrhea, nausea, and low-grade fever between 10 p.m. on September 24 and 8 p.m. on September 25. The ill students lived in dormitories that housed 723 of the students. The table below provides information on the number of students per type of residence and the number reporting illnesses consistent with the described symptoms and onset time. What is the proportion of total cases occurring in boys? That's correct! The proportion of cases occurring in boys is equal to the number of cases in boys divided by the total number of cases (43/57). This equals 75.4%. Question 12 An outbreak of gastroenteritis occurred at a boarding school with a student enrollment of 846. Fifty-seven students reported symptoms including vomiting, diarrhea, nausea, and low-grade fever between 10 p.m. on September 24 and 8 p.m. on September 25. The ill students lived in dormitories that housed 723 of the students. The table below provides information on the number of students per type of residence and the number reporting illnesses consistent with the described symptoms and onset time. What is the proportion of total cases occurring in students who live in dormitories? That's correct! The proportion of cases occurring in dormitory residents is equal to the number of cases in residents divided by the total number of cases (52/57). This equals 91.2%. Question 13 An outbreak of gastroenteritis occurred at a boarding school with a student enrollment of 846. Fifty-seven students reported symptoms including vomiting, diarrhea, nausea, and low-grade fever between 10 p.m. on September 24 and 8 p.m. on September 25. The ill students lived in dormitories that housed 723 of the students. The table below provides information on the number of students per type of residence and the number reporting illnesses consistent with the described symptoms and onset time. Which proportion is more informative for the purpose of the outbreak investigation? That's correct! Both proportions are useful. Dormitory residents account for over 90% of the cases indicating an outbreak of an infectious agent that was transmitted at the school. Furthermore, over 75% of the cases were boys indicating that the responsible agent was more likely to have been transmitted in the boys’ dormitory. Question 14 A group of researchers are interested in conducting a clinical trial to determine whether a new cholesterol-lowering agent was useful in preventing coronary heart disease (CHD). They identified 12,327 potential participants for the trial. At the initial clinical exam, 309 were discovered to have CHD. The remaining subjects entered the trial and were divided equally into the treatment and placebo groups. Of those in the treatment group, 505 developed CHD after 5 years of follow-up while 477 developed CHD during the same period in the placebo group. What was the prevalence of CHD at the initial exam? That's correct! The prevalence of CHD at the initial exam was 309 cases of CHD divided by 12,327 participants. This equals a prevalence of 25.1 cases of CHD per 1,000 persons. Question 15 A group of researchers are interested in conducting a clinical trial to determine whether a new cholesterol-lowering agent was useful in preventing coronary heart disease (CHD). They identified 12,327 potential participants for the trial. At the initial clinical exam, 309 were discovered to have CHD. The remaining subjects entered the trial and were divided equally into the treatment and placebo groups. Of those in the treatment group, 505 developed CHD after 5 years of follow-up while 477 developed CHD during the same period in the placebo group. What was the incidence of CHD during the 5-year study? That's correct! The incidence rate reflects the number of new cases developing in the population at risk. Since prevalent CHD cases were excluded from the study, the population at risk was 12,018 (12,327 persons less 309 cases of CHD). During the 5-year study period, 982 incident cases of CHD developed. This equals an incidence rate of 81.7 cases of CHD per 1,000 persons. Question 16 Which of the following are examples of a population prevalence rate? • The number of ear infections suffered by 3-year-old children in March, 2006 • The number of persons with hypertension per 100,000 population • The number of cases of skin cancer diagnosed in a dermatology clinic • b and c • All of the above That's correct! Prevalence is the number of affected persons in a specified population size at a given time. Only answer (b) fits this definition. Example (a) is more consistent with an incident rate while answer (c) is a selected group of persons who may not be representative of a general population. Question 17 What would be the effect on age-specific incidence rates of uterine cancer if women with hysterectomies were excluded from the denominator of incidence calculations assuming that most women who have had hysterectomies are older than 50 years of age. • The rates in all age groups would remain the same. • Only rates in women older than 50 years of age would tend to decrease. • Rates in women younger than 50 years would increase compared to women older than 50 years of age. • Rates would increase in women older than 50 years of age but may decrease in younger women as they get older. • It cannot be determined whether the rates would increase or decrease. That's correct! Women who have had hysterectomies (i.e., removal of the uterus) are no longer at risk for uterine cancer. For women older than 50 years of age, this would increase the age-specific incidence rate as there would be the same number of uterine cancers occurring among fewer women at risk. Further, rates may decrease among younger women who have had hysterectomies as they are no longer at risk for uterine cancer and thus may decrease the number of potential cases occurring in their age group over time. Question 18 A survey was conducted among 1,000 randomly sampled adult males in the United States in 2005. The results from this survey are shown below. The researchers stated that there was a doubling of risk of hypertension in each age group younger than 60 years of age. You conclude that the researchers’ interpretation: • Is correct • Is incorrect because prevalence rates are estimated • Is incorrect because it was based on proportions of the population sample • Is incorrect because incidence rates do not describe risk • Is incorrect because the calculations do not include adult females That's correct! The survey reports the disease status of a population at a specific point in time. In this case, a random sample of adult males in 2005 provides a reliable estimate of the prevalence of hypertension. Since there is no information on duration of hypertension in these men, incidence cannot be calculated. Therefore, the researchers are not able to make a statement concerning risk of hypertension in the population. Question 19 The incidence and prevalence rates of a chronic childhood illness for a specific community are given below. Based on the data, which of the following interpretations best describes disease X? • The duration of disease is becoming shorter. • The duration of disease is becoming longer. • The case-fatality rate of this disease is decreasing. • Efforts to prevent new cases of this disease are becoming more successful. • The risk of the disease has decreased over the past 20 years. That's correct! Prevalence and incidence are related by the duration of disease. If incidence is increasing over time, then duration of illness has to decrease in order to keep the prevalence rate constant. This may occur through better treatments to cure disease or through higher case-fatality rates as a disease becomes more lethal. Since incidence is increasing over time, it is evident that risk is also increasing and that prevention efforts are not successful. Question 20 A prevalence survey conducted from January 1 through December 31, 2003 identified 580 new cases of tuberculosis in a city of 2 million persons. The incidence rate of tuberculosis in this population has historically been 1 per 4,000 persons each year. What is the incident rate of tuberculosis per 100,000 persons in 2003? That's correct! The answer is 29 new cases of tuberculosis per 100,000 persons. This is found by dividing the new cases of tuberculosis by the total population at risk (580/2,000,000) and multiplying this rate by 100,000 to standardize the rate. Question 21 A prevalence survey conducted from January 1 through December 31, 2003 identified 580 new cases of tuberculosis in a city of 2 million persons. The incidence rate of tuberculosis in this population has historically been 1 per 4,000 persons each year. Has the risk of tuberculosis increased or decreased during 2003? That's correct! The risk of tuberculosis has increased over the historic incident rate. This comparison can be made by standardizing the historic rate to a rate per 100,000 persons. To do this, multiply the numerator and denominator by 25. Question 22 Which of the following is an advantage of active surveillance? • Requires less project staff • Is relatively inexpensive to employ • More accurate due to reduced reporting burden for health care providers • Relies on different disease definitions to account for all cases • Reporting systems can be developed quickly That's correct! Active surveillance entails a concerted effort to collect information about disease occurrence. It typically involves dedicated staff members who have been specifically directed to contact physicians and hospitals in order to collect reports of disease cases in a specified population. This activity requires a large amount of staff and resources in order to accomplish its goals. Question 23 The population of a city on February 15, 2005, was 36,600. The city has a passive surveillance system that collects hospital and private physician reports of influenza cases every month. During the period between January 1 and April 1, 2005, 2,200 new cases of influenza occurred in the city. Of these cases, 775 persons were ill with influenza according to surveillance reports on April 1, 2005. The monthly incidence rate of active cases of influenza for the 3-month period was: • 4 per 1,000 population • 17 per 1,000 population • 20 per 1,000 population • 39 per 1,000 population • 130 per 1,000 population That's correct! The monthly incidence rate is calculated based on the number of new cases of a disease developing during the 3-month time period. In this example, 2,200 cases of influenza developed among an average population of 36,600 persons at risk during the surveillance period. The incidence rate equals 2,200 divided by 36,600. In order to calculate the average monthly rate, the rate should then be divided by 3. Finally, the monthly rate can be multiplied by 1,000 in order to express it per the responses listed. Question 24 The population of a city on February 15, 2005, was 36,600. The city has a passive surveillance system that collects hospital and private physician reports of influenza cases every month. During the period between January 1 and April 1, 2005, 2,200 new cases of influenza occurred in the city. Of these cases, 775 persons were ill with influenza according to surveillance reports on April 1, 2005. The prevalence rate of active influenza as of April 1, 2005, was: • 10 per 1,000 population • 14 per 1,000 population • 17.5 per 1,000 population • 20 per 1,000 population • Cannot be calculated as there is no information on duration That's correct! The prevalence rate as of April 1, 2005, is equal to the number of active influenza cases reported divided by the number of persons at risk in the population at that time. The best estimate of the population size is that from the February 15 count, less who are no longer at risk as they have already recovered from influenza and have developed immunity. Therefore, prevalence equals 705 cases divided by 36,600 less 1,495 recovered cases. This number can be multiplied by 1,000 in order to estimate a prevalence rate of 20 cases per 1,000 persons. Question 25 The population of a city on February 15, 2005, was 36,600. The city has a passive surveillance system that collects hospital and private physician reports of influenza cases every month. During the period between January 1 and April 1, 2005, 2,200 new cases of influenza occurred in the city. Of these cases, 775 persons were ill with influenza according to surveillance reports on April 1, 2005. What can be inferred about influenza cases occurring in the city? • Active surveillance would enable better prevention of influenza • The incidence rate would decrease if active surveillance were employed • The average duration of influenza is approximately 1 month • The actual number of influenza cases occurring in the population is less since hospitals and private physicians may be reporting the same patients. • The prevalence rate should be higher since it should be calculated based on all cases of influenza occurring from January 1 through March 30, 2005. That's correct! Since the average monthly incidence rate is 20 per 1,000 and the prevalence rate is also 20 per 1,000, then the duration of disease must equal 1 month. Question 26 A study found that adults older than age 50 had a higher prevalence of pneumonia than those who were younger than age 50. Which of the following is consistent with this finding? • Younger adults have a higher incidence of pneumonia • Older adults have a higher case-fatality rate from pneumonia • Younger adults with pneumonia are more likely to report being ill than older persons • Incidence rates do not vary by age, but older adults have pneumonia for a longer duration compared to younger adults • None of the above That's correct! For prevalence to be higher among older adults, either incidence or duration of pneumonia must be increased in this age group. Question 27 Which of the following statements are true? More than one answer may be correct. • Prevalence rates are always larger than incidence rates • In a steady state, the prevalence of disease is equal to the attack rate • Diagnostic criteria rarely impact estimates of disease prevalence and incidence • Prevalence rates are useful for public health planning • Incidence rates can be used to estimate prevalence when the mean duration of the disease is known That's correct! Question 28 A disease has an incidence of 10 per 1,000 persons per year, and 80% of those affected will die within 1 year. Prior to the year 2000, only 50% of cases of the disease were detected by physician diagnosis prior to death. In the year 2000, a lab test was developed that identified 90% of cases an average of 6 months prior to symptom onset; however, the prognosis did not improve after diagnosis. Comparing the epidemiology of the disease prior to 2000 with the epidemiology of the disease after the development of the lab test, which statement is true concerning the disease in 2000? • Incidence is higher and prevalence is higher than in 1999 • Incidence is higher in 2000 but prevalence remains the same • Incidence is the same in 2000 but prevalence is higher than in 1999 • Both incidence and prevalence remain the same as in 1999 • Incidence is the same in 2000 but prevalence is lower than in 1999 That's correct! With increased ability to detect cases of the disease at earlier times, both the number of incidence and prevalent cases will increase through better detection. Question 29 A disease has an incidence of 10 per 1,000 persons per year, and 80% of those affected will die within 1 year. Prior to the year 2000, only 50% of cases of the disease were detected by physician diagnosis prior to death. In the year 2000, a lab test was developed that identified 90% of cases an average of 6 months prior to symptom onset; however, the prognosis did not improve after diagnosis. Which statement is true concerning the duration of the disease after the development of the lab test? • Mean duration of a case of the disease is shorter in 2000 • Mean duration of a case of the disease is the same in 2000 • Mean duration of a case of the disease is longer in 2000 • No inference about mean duration can be made since the lab test has only been available for 1 year That's correct! Though the prognosis is similar after the development of the lab test, the duration of new cases identified by the test can be increased by up to 6 months due to earlier detection. Question 30 A disease has an incidence of 10 per 1,000 persons per year, and 80% of those affected will die within 1 year. Prior to the year 2000, only 50% of cases of the disease were detected by physician diagnosis prior to death. In the year 2000, a lab test was developed that identified 90% of cases an average of 6 months prior to symptom onset; however, the prognosis did not improve after diagnosis. Which statement is true concerning the disease-specific mortality rate after the development of the lab test? • The mortality rate for the disease is decreased in 2000 • The mortality rate for the disease is the same in 2000 • The mortality rate for the disease is increased in 2000 • No inference about the mortality rate can be made since the lab test has only been available for 1 year That's correct! With the implementation of the lab test, the increase in early detection of cases will increase incidence, duration, and prevalence; however, since the prognosis is still the same, at least 80% of patients will die during the year 2000. This should result in a similar mortality rate as the previous year given no change in transmission, prevention, or medical care of the disease. Question 31 In a coastal area of a country in which a tsunami struck, there were 100,000 deaths in a population of 2.4 million for the year ending December 31, 2005. What was the all-cause crude mortality rate per 1,000 persons during 2005? That's correct! The answer is 41.7 per 1,000 persons. The rate is calculated by dividing 100,000 deaths by the population of 2,400,000 persons. To express as a rate per 1,000 persons, the rate is multiplied by 1,000. Question 32 In an industrialized nation, there were 192 deaths due to lung diseases in miners ages 20 to 64 years. The expected number of deaths in this occupational group, based on age-specific death rates for lung diseases in all males ages 20 to 64 years, was 238 during 1990. What was the standardized mortality ratio (SMR) for lung diseases in miners? That's correct! The answer is 81. The ratio is calculated by dividing 192 observed deaths by the 238 expected deaths for this age group. To express it as an SMR, the ratio is often multiplied by 100. Question 33 In 2001, a state enacted a law that required the use of safety seats for all children under 7 years of age and mandatory seatbelt use for all persons. The table below lists the number of deaths due to motor vehicle accidents (MVAs) and the total population by age in 2000 (before the law) and in 2005 (4 years after the law was enacted). What is the age-specific mortality rate due to MVAs for children ages 0 to 18 years in 2000? • 1.8 per 1,000 • 2.9 per 1,000 • 4.0 per 1,000 • 6.1 per 1,000 • Cannot be calculated from information given That's correct! The rate is found by combining the MVA deaths and total population size for the two age groups under 7 years and 7 to 18 years during the year 2000. This equals (44 + 105) divided by (3,500 + 21,000). Multiplying this rate by 1,000 persons gives the answer indicated. Question 34 In 2001, a state enacted a law that required the use of safety seats for all children under 7 years of age and mandatory seatbelt use for all persons. The table below lists the number of deaths due to motor vehicle accidents (MVAs) and the total population by age in 2000 (before the law) and in 2005 (4 years after the law was enacted). Using the pooled total of the 2000 and 2005 populations as the standard rate, calculate the age-adjusted mortality rate due to MVAs in 2005. That's correct! The correct answer is 2.3 MVA deaths per 1,000 persons. The key to calculating the age-adjusted rate is to pool the observed numbers for both time periods and to calculate the expected numbers of deaths in the 2005 population assuming that a common rate applied to the population. For example, for those under 7 years, the pooled rate equals (44 + 20) divided by (3,500 + 4,000). The pooled rate for this group is 8.5 per 1,000 persons. When this rate is multiplied by the 4,000 children under 7 years of age in 2005, the expected number of deaths is 34.13. Performing the same calculation for each age group results in 111.7 deaths in those 7 to 18 years of age, 175.8 deaths in those 19 to 49 years, and 237.35 deaths for those 50 years or more. The total number of deaths expected in 2005 based on this pooled rate is 558.98. Therefore, the age-adjusted overall rate for 2005 is 558.98 deaths divided by 240,000 persons. Question 35 In 2001, a state enacted a law that required the use of safety seats for all children under 7 years of age and mandatory seatbelt use for all persons. The table below lists the number of deaths due to motor vehicle accidents (MVAs) and the total population by age in 2000 (before the law) and in 2005 (4 years after the law was enacted). Based on the information in the table, it was reported that there was an increased risk of death due to MVAs in the state after the law was passed. These conclusions are: • Correct, because there were 1.8 times as many MVA deaths in 2005 as in 2000 • Correct, because for each age group, the mortality rates were higher in 2005 than they were in 2000 • Correct, because both the total and the age-adjusted mortality rates are higher in 2005 than in 2000 • Incorrect, because the age-adjusted mortality rate due to MVA is actually lower in 2005 than in 2000 • Incorrect, because the overall mortality rate is the same in both years That's correct! The overall crude (unadjusted) mortality rate is 2.6 per 1,000 persons in 2005. This is found by dividing 640 deaths by a population of 240,000 persons. This rate is then multiplied by 1,000. The overall adjusted mortality rate is 2.3 per 1,000 persons as calculated in question 34. Both of these rates are higher than the overall crude mortality rate of 2.0 per 1,000 persons for the year 2000. Question 36 For colorectal cancer diagnosed at an early stage, the disease can have 5-year survival rates of greater than 80%. Which answer best describes early stage colorectal cancer? • Incidence rates and mortality rates will be similar • Mortality rates will be much higher than incidence rates • Incidence rates will be much higher than mortality rates • Incidence rates will be unrelated to mortality rates • None of the above That's correct! For diseases with a long duration as indicated by high 5-year survival rates for early stage colorectal cancer, the incidence will be much higher than the mortality rate since more persons are being diagnosed with the disease than are dying of it. Question 37 The following table gives the mean annual age-specific mortality rates from measles during the first 25 years of life in successive 5-year periods. You may assume that the population is in a steady state (i.e., migrations out are equal to migrations in). The age-specific mortality rates for the cohort born in 1915-1919 are: • 2.4 2.8 1.7 1.5 0.4 • 2.9 3.7 2.8 2.0 0.6 • 2.9 2.4 1.7 1.3 0.8 • 2.4 3.3 2.0 0.6 0.1 • 1.7 2.8 2.2 1.1 0.2 That's correct! This is found by tracking the cohort of children born between 1915 and 1919 by each 5-year age group. For example, this group would be 0 to 4 years of age in 1915 to 1919 with a rate of measles mortality of 2.4. In 1920 to 1924, this group of children would be 5 to 9 years of age and have a rate of measles mortality of 3.3. Continuing in a diagonal manner, the remaining three rates can be found in the table. Question 38 The following table gives the mean annual age-specific mortality rates from measles during the first 25 years of life in successive 5-year periods. You may assume that the population is in a steady state (i.e., migrations out are equal to migrations in). Based on the information above, one may conclude: • Age-specific mortality rates for measles decreased for the period 1910–1914 to 1925–1929 • Age-specific mortality rates for measles increased for the period 1910–1914 to 1925–1929 • The case-fatality rate decreased for the period 1910–1914 to 1935–1939 • Children born in 1910–1914 had the highest rate of death in all periods • Children ages 5 to 9 had the highest rate of death in all periods That's correct! For each 5-year period, the highest mortality rate is reported among those 5 to 9 years of age. This is seen by comparing the rate for this age group to all other age groups in a row. Question 39 Which of the following characteristics indicate that mortality rates provide a reliable estimate of disease incidence? More than one answer may be correct. • Case-fatality rate is low • The case-fatality rate is high • The duration of disease is short • The prevalence of disease is greater than 5% • The proportionate mortality is high That's correct! Question 40 Which of the following statements are true? More than one answer may be correct. • A mortality rate is an example of an incidence rate • Death certificate data are generally valid regardless of the cause of death • Type of disease is the most important predictor of mortality • Changing diagnostic criteria does not affect estimates of prevalence and incidence • The case-fatality rate is calculated based on the entire population at risk That's correct! A mortality rate can approximate an incidence rate under conditions of a high case-fatality rate and a short duration of disease. Question 41 Among those who are 25 years of age, those who have been driving less than 5 years had 13,700 motor vehicle accidents in 1 year, while those who had been driving for more than 5 years had 21,680 motor vehicle accidents during the same time period. It was concluded from these data that 25-year-olds with more driving experience have increased accidents compared to those who started driving later. This conclusion is: • Correct based on the data • Incorrect because rates are not reported • Incorrect because prevalence estimates are given when incidence rates should be reported • Incorrect because there are no comparison groups identified • Both b and d are correct That's correct! The information provided only enumerates motor vehicle accidents in two groups. In order to fully compare these counts, information is needed on the denominator, i.e., the number of persons driving in each group, so that rates can be calculated. Question 42 For a disease such as liver cancer, which is highly fatal and of short duration, which of the following statements is true? Choose the best answer. • Mortality rates will be much higher than incidence rates • Mortality rates will be much higher than prevalence rates • Incidence rates will be much higher than mortality rates • Case-fatality rates will be equal to mortality rates • Incidence rates will be equal to mortality rates That's correct! Since the 5-year survival rate for liver cancer is 4%, most incident cases of liver cancer will result in a premature mortality. In this case, the mortality and incidence rates will be approximately equal. Question 43 The prevalence rate of a disease is two times greater in women than in men, but the incidence rates are the same in men and women. Which of the following statements may explain this situation? • The duration of disease is shorter in women • Men are at greater risk for developing the disease • The case-fatality rate is lower for women • The age-adjusted mortality rate will be higher for women • The proportionate mortality rate for the disease is higher for men That's correct! Since men and women develop the disease at the same rate, the survival rate in women must be increased in order to increase duration and prevalence. A low case-fatality rate would contribute to an increased duration of the disease. Question 44 The table below describes the number of illnesses and deaths caused by plague in four communities. The case-fatality rate associated with plague is lowest in which community? • Community A • Community B • Community C • Community D That's correct! The case-fatality rate equals the number of deaths occurring from plague divided by all persons with the plague. In Community C, the CFR is 300 divided by 400, or 60%. This is lower than A (67%), B (75%), and D (77%). Question 45 The table below describes the number of illnesses and deaths caused by plague in four communities. The proportionate mortality ratio associated with plague is lowest in which community? • Community A • Community B • Community C • Community D That's correct! The proportionate mortality rate equals the number of deaths occurring from plague divided by all persons with the plague. In Community D, the PMR is 500 divided by 5000, or 10%. This is lower than A (50%), B (75%), and D (38%). Chapters 5-6 Question 1 In a community-based hypertension testing program called HT-Aware, the detection level for high blood pressure is set at 140 mmHg for systolic blood pressure. A separate testing program called HT-Warning in the same community sets the level at 130 mmHg for high systolic blood pressure. Which statements are likely to be true? • The sensitivity of HT-Warning is greater than that of HT-Aware • The specificity of HT-Warning is greater than that of HT-Aware • The number of false positives is greater with HT-Warning than with HT-Aware • The number of false negatives is greater with HT-Warning than with HT-Aware • The sensitivity and specificity are the same for both tests That's correct! Question 2 A school nurse examined a population of 1,000 children in an attempt to detect nearsightedness. The prevalence of myopia in this population is known to be 15%. The sensitivity of the examination is 60% and its specificity is 80%. All children labeled as “positive” (i.e., suspected of having myopia) by the school nurse are sent for examination by an optometrist. The sensitivity of the optometrist’s examination is 98% and its specificity is 90%. How many children are labeled “positive” by the school nurse? That's correct! There are 150 children with myopia in the school population (15% prevalence among 1,000 children). The school nurse will identify 60% of those who truly have the condition, or 90 cases (60% sensitivity multiplied by 150 myopic children). Further, the school nurse will incorrectly identify 170 false positive cases of myopia among those who do not have the condition (80% specificity multiplied by 850 non-myopic children). The sum of the cases labeled as positive by the school nurse equals 260 children (90 true myopic children plus 170 false positive children). Question 3 A school nurse examined a population of 1,000 children in an attempt to detect nearsightedness. The prevalence of myopia in this population is known to be 15%. The sensitivity of the examination is 60% and its specificity is 80%. All children labeled as “positive” (i.e., suspected of having myopia) by the school nurse are sent for examination by an optometrist. The sensitivity of the optometrist’s examination is 98% and its specificity is 90%. What is the positive predictive value (PPV) of the school nurse’s exam? That's correct! The PPV of the school nurse’s exam is equal to the number of true positive cases divided by the total number of those that the school nurse labels as positive. In this exam, the PPV is 34.6% (90 true myopic children divided by 260 children labeled as myopic by the school nurse). Question 4 A school nurse examined a population of 1,000 children in an attempt to detect nearsightedness. The prevalence of myopia in this population is known to be 15%. The sensitivity of the examination is 60% and its specificity is 80%. All children labeled as “positive” (i.e., suspected of having myopia) by the school nurse are sent for examination by an optometrist. The sensitivity of the optometrist’s examination is 98% and its specificity is 90%. How many children will be labeled myopic following the optometrist’s exam? That's correct! Since the optometrist will only test children who have been labeled as myopic by the school nurse, the testing group for this sequential exam is 260 children. The optometrist labels 105 children as myopic. Among the 90 myopic children correctly referred by the school nurse, the optometrist identifies 88 of them as myopic (98% sensitivity multiplied by 90 true cases of myopia). Further, the optometrist will incorrectly identify 17 false positive cases among the 170 children referred by the school nurse who do not have myopia. The sum of the cases labeled as positive by the optometrist equals 105 children (89 true cases plus 17 false positive cases). Question 5 A school nurse examined a population of 1,000 children in an attempt to detect nearsightedness. The prevalence of myopia in this population is known to be 15%. The sensitivity of the examination is 60% and its specificity is 80%. All children labeled as “positive” (i.e., suspected of having myopia) by the school nurse are sent for examination by an optometrist. The sensitivity of the optometrist’s examination is 98% and its specificity is 90%. What is the positive predictive value (PPV) of the optometrist’s exam? That's correct! The PPV of the optometrist’s exam is equal to the number of true positive cases divided by the total number that the optometrist labels as positive. The optometrist will only test 260 children referred by the school nurse. Of these children, the optometrist will correctly identify 89 cases of myopia among 105 children labeled as positive for the condition. The PPV equals 83.8% (89 true myopic children divided by 105 children labeled as positive). Question 6 A school nurse examined a population of 1,000 children in an attempt to detect nearsightedness. The prevalence of myopia in this population is known to be 15%. The sensitivity of the examination is 60% and its specificity is 80%. All children labeled as “positive” (i.e., suspected of having myopia) by the school nurse are sent for examination by an optometrist. The sensitivity of the optometrist’s examination is 98% and its specificity is 90%. What is the negative predictive value (NPV) of the optometrist’s exam? That's correct! The NPV of the optometrist’s exam is 98.7%. The NPV equals the number of true negative cases divided by all negative cases indicated by the exam. In this instance, the optometrist correctly identifies 153 children as negative for myopia; however, there are 2 false negative cases following the optometrist’s exam (90 true cases referred by the school nurse less the 88 cases detected by the optometrist). The NPV equals 153 divided by 155, or 98.7%. Question 7 A school nurse examined a population of 1,000 children in an attempt to detect nearsightedness. The prevalence of myopia in this population is known to be 15%. The sensitivity of the examination is 60% and its specificity is 80%. All children labeled as “positive” (i.e., suspected of having myopia) by the school nurse are sent for examination by an optometrist. The sensitivity of the optometrist’s examination is 98% and its specificity is 90%. What is the overall sensitivity of the sequential examinations? That's correct! The overall sensitivity of the sequential exams is 58.7%; 88 true positive cases of myopia are found following the optometrist’s exam among the 150 prevalent cases in the school population. Question 8 A school nurse examined a population of 1,000 children in an attempt to detect nearsightedness. The prevalence of myopia in this population is known to be 15%. The sensitivity of the examination is 60% and its specificity is 80%. All children labeled as “positive” (i.e., suspected of having myopia) by the school nurse are sent for examination by an optometrist. The sensitivity of the optometrist’s examination is 98% and its specificity is 90%. What is the overall specificity of the sequential examinations? That's correct! The overall specificity of the sequential exams is 98%; 833 children will be correctly labeled as negative for myopia among the 850 true negative cases. This is found by summing the number of true positives after each exam (680 following that of the school nurse plus 153 following the optometrist) and dividing by the true negative children in the population. This equals 833 divided by 850, or 98%. Question 9 A school nurse examined a population of 1,000 children in an attempt to detect nearsightedness. The prevalence of myopia in this population is known to be 15%. The sensitivity of the examination is 60% and its specificity is 80%. All children labeled as “positive” (i.e., suspected of having myopia) by the school nurse are sent for examination by an optometrist. The sensitivity of the optometrist’s examination is 98% and its specificity is 90%. What would be the positive predictive value (PPV) of the exam for myopia if the optometrist tested all 1,000 children? That's correct! The PPV of the optometrist’s exam would be equal to the number of true positive cases divided by all children labeled positive by the optometrist. Applying the sensitivity and specificity of the optometrist’s exam to the 1,000 children would indicate that 147 true positive cases are labeled positive by the optometrist. Additionally, the optometrist would find 85 false positive cases (850 true negative cases multiplied by 90% specificity). The PPV would be 63.4% (147 true positive cases divided by 232 total positives indicated by the optometrist). Question 10 Which of the following improves the reliability of diabetes screening tests? • Having the same lab analyze all samples • Taking more than one sample for each subject and averaging the results • Insuring that the instrument is standardized before each sample is analyzed • a and c only • All of the above That's correct! Reliability is improved by consistency of analyses, especially when multiple samples are taken for a subject and the analytic instrument is routinely standardized. Question 11 A prostate specific antigen (PSA) test is a quick screening test for prostate cancer. A researcher wants to evaluate it using two groups. Group A consists of 1,500 men who had biopsy-proven adenocarcinoma of the prostate while group B consists of 3,000 age- and race-matched men all of whom showed no cancer at biopsy. The results of the PSA screening test in each group is shown in the table. What is the sensitivity of the PSA screening test in the combined groups? That's correct! The sensitivity equals the number of true positives detected among all true positives. Since a biopsy is the gold standard test for prostate cancer, all 1,500 men in group A are positive for prostate cancer. The PSA test indicated that 1,155 of these men had prostate cancer, a sensitivity of 77%. Question 12 A prostate specific antigen (PSA) test is a quick screening test for prostate cancer. A researcher wants to evaluate it using two groups. Group A consists of 1,500 men who had biopsy-proven adenocarcinoma of the prostate while group B consists of 3,000 age- and race-matched men all of whom showed no cancer at biopsy. The results of the PSA screening test in each group is shown in the table. What is the specificity of the screening test in the combined groups? That's correct! The specificity equals the number of true negatives detected among all true negatives. Among the 3,000 men who did not have prostate cancer, the test correctly identified 2,760 men as negative for prostate cancer (3,000 minus 240 false positives). This gives a sensitivity of 92%. Question 13 A prostate specific antigen (PSA) test is a quick screening test for prostate cancer. A researcher wants to evaluate it using two groups. Group A consists of 1,500 men who had biopsy-proven adenocarcinoma of the prostate while group B consists of 3,000 age- and race-matched men all of whom showed no cancer at biopsy. The results of the PSA screening test in each group is shown in the table. What is the positive predictive value (PPV) of the screening test in the combined groups? That's correct! The PPV is 83%. This value is found by dividing 1,155 true positives by the total number of all positives indicated by the PSA test (1,155 plus 24). Question 14 A prostate specific antigen (PSA) test is a quick screening test for prostate cancer. A researcher wants to evaluate it using two groups. Group A consists of 1,500 men who had biopsy-proven adenocarcinoma of the prostate while group B consists of 3,000 age- and race-matched men all of whom showed no cancer at biopsy. The results of the PSA screening test in each group is shown in the table. The PSA screening test is used in the same way in two equal-sized populations of men living in different areas of the United States, but the proportion of false positives among those who have a positive PSA test in the first population is lower than that among those who have a positive PSA test in the second population. What is the likely explanation for this finding? • It is impossible to determine what caused the difference • The prevalence of disease is higher in the first population • The specificity of the test is lower in the first population • The specificity of the test is higher in the first population • The prevalence of the disease is lower in the first population That's correct! We can assume that the specificity of the test will be similar in each population. Therefore the proportion of false positives found among the true negatives should be the same in each population. However, the proportion of false positives among all positives on the PSA screening test will be influenced by the number of true positives detected by the test. Since the sensitivity of the test will also be the same, we can assume that more true positives exist in the population of men with a lower proportion of false positive tests due to an increase in the PPV. Question 15 Test A has a sensitivity of 95% and a specificity of 90%. Test B has a sensitivity of 80% and a specificity of 98%. In a community of 10,000 people with 5% prevalence of the disease, Test A has always been given before Test B. What is the best reason for changing the order of the tests? • The net sensitivity will be increased if Test B is given first • The total number of false positives found by both tests is decreased if Test B is given first • The net specificity will be decreased if Test B is given first • The total number of false negatives found by both tests is decreased if Test B is given first • There is no good reason to change the order of the tests That's correct! A sequential testing process would only refer those with positive results to the second test. Since Test B has a higher specificity, then fewer false positives will be referred for Test A, thereby decreasing the number of false positives found. This can be shown by calculation if we assume that 500 persons have the disease among the 10,000 in the population. Test B will find only 190 false positives for referral (9,500 true negatives less the number of true negatives multiplied by 98% specificity). Performing Test A first results in 950 false positives referred for the second test (9,500 true negative less the number of true negatives multiplied by 90% specificity). Question 16 Two neurologists, Drs. J and K, independently examined 70 magnetic resonance images (MRIs) for evidence of brain tumors. As shown in the table below, the neurologists read each MRI as either “positive” or “negative” for brain tumors. Based on the above information, the overall percent agreement between the two doctors including all observations is: • 37.1% • 62.9% • 65.0% • 68.4% • 84.6% That's correct! The two doctors agree on 44 of the 70 MRI readings. This includes the 26 that they both labeled as positive for brain tumors and the 18 that they both agreed were negative for brain tumors. Question 17 Two neurologists, Drs. J and K, independently examined 70 magnetic resonance images (MRIs) for evidence of brain tumors. As shown in the table below, the neurologists read each MRI as either “positive” or “negative” for brain tumors. What is the estimate of kappa for the reliability of the two doctors’ test results? • 10.1% • 24.9% • 50.6% • 57.4% • 68.4% That's correct! The estimate of kappa expresses the observed agreement of two testers in excess of chance alone. It is found by applying the expected agreement rates for both testers. In this case, Dr. K labeled 38 of the 70 MRIs as positive (54.3% of all MRIs) and 32 as negative (45.7% of all slides). Dr. J labeled 57.1% of the MRIs as positive (40 of 70) and 42.9% as negative. We would expect that if Dr. K had the same rate of positive and negative findings as Dr. J then they would agree by chance on 21.7 of the 38 positive MRIs that were found (38 multiplied by 0.571). Further, they would agree by chance on 13.7 of the 32 negative MRIs that were found (32 multiplied by 0.429). Therefore, we would expect the two doctors to agree by chance on 50.6% of the MRIs (21.7 positive agreements plus 13.7 negative agreements equals 35.4, then divide this by the total of 70 to get an expected overall agreement of 50.6%). Now, kappa can be calculated as the observed agreement less expected divided by 100% less the expected agreement— in this instance, 62.9% minus 50.6% divided by 100% less 50.6%. 12.3% divided by 49.4% results in a kappa of 24.9%. Question 18 This table represents the results of coronary magnetic resonance (CMR) angiography compared to x-ray angiography (the gold standard in diagnosis of coronary artery disease) in a high-risk population of patients scheduled to undergo x-ray angiography for suspected coronary artery disease. In the general population, the prevalence of coronary artery disease is apporximately 6%. Assuming that this sample of patients is representative of the general population, the sensitivity of the CMR test in the general population would be approximately: • Less than 75% • Between 75% and 85% • Between 85% and 90% • Between 90% and 95% • Greater than 95% That's correct! If we assume that the prevalence of disease is similar, then we can accept that 60 persons with a positive x-ray will be true cases of coronary artery disease. In this instance, the CMR test positively identifies 56 of the 60 true cases, a sensitivity of 93.3%. Question 19 This table represents the results of coronary magnetic resonance (CMR) angiography compared to x-ray angiography (the gold standard in diagnosis of coronary artery disease) in a high-risk population of patients scheduled to undergo x-ray angiography for suspected coronary artery disease. After reviewing the results of the test comparison, an epidemiologist decides that the specificity of the test is too low. Using the same CMR images, he raises the cutoff value for a positive test to increase the specificity. What is the likely effect on the sensitivity? • Sensitivity will increase • Sensitivity will decrease • There will be no effect because the two characteristics are unrelated • The effect cannot be predicted as it will depend on the prevalence rate • Sensitivity will be higher if the positive predictive value is increased That's correct! The increase in the cutoff value for a positive test will reduce the sensitivity of the test even though the specificity is increased. This will result in the misidentification of true positive cases as false negatives if their CMR values are below the cutoff value suggested by the epidemiologist. Question 20 In comparing the mammography readings of two technicians who evaluated the same set of 600 mammograms for presence of breast cancer from a generally representative sample of women from the population, • Agreement regarding negative or normal mammograms is likely to be low • The kappa statistic measures agreement due to chance only • Overall percent agreement calculated for both readers may conceal significant disagreements regarding positive tests • A kappa of 0.9 would be unsatisfactory • A kappa of 0.6 represents poor agreement That's correct! Since the sample is from the general population, it is likely that very few will have prevalent breast cancer indicating that many readings will be regarded as normal, or negative for the disease. Since a large proportion of the readings will be negative, it is likely that the two technicians will have a high value for overall percent agreement though they may differ significantly in their readings for the few women who are labeled positive for breast cancer. Question 21 In a country with a population of 16 million people, 175,000 deaths occurred during the year ending December 31, 2005. These included 45,000 deaths from tuberculosis (TB) in 135,000 persons who were sick with TB. Assume that the population remained constant throughout the year. What was the annual mortality rate for the country during 2005? That's correct! The annual mortality rate equals the number of deaths divided by the total population. In this example, 175,000 deaths occurred among 16 million persons. Dividing these numbers and multiplying by 100,000 gives a rate of 1,094 deaths per 100,000 persons, approximately 1% of the population. Question 22 In a country with a population of 16 million people, 175,000 deaths occurred during the year ending December 31, 2005. These included 45,000 deaths from tuberculosis (TB) in 135,000 persons who were sick with TB. Assume that the population remained constant throughout the year. What was the case-fatality rate (CFR) from TB during 2005? That's correct! The CFR is the number of cause-specific deaths divided by all cases of the specific disease. In this example, 45,000 TB deaths occurred in 135,000 persons with TB. This equals a CFR of 33%. Question 23 In a country with a population of 16 million people, 175,000 deaths occurred during the year ending December 31, 2005. These included 45,000 deaths from tuberculosis (TB) in 135,000 persons who were sick with TB. Assume that the population remained constant throughout the year. What is the proportionate mortality ratio (PMR) for TB during 2005? That's correct! The PMR is the number of deaths due to a specific cause divided by all deaths. In this example, the PMR equals 45,000 TB deaths divided by 175,000 deaths, or approximately 26%. Question 24 In a country with a population of 16 million people, 175,000 deaths occurred during the year ending December 31, 2005. These included 45,000 deaths from tuberculosis (TB) in 135,000 persons who were sick with TB. Assume that the population remained constant throughout the year. Not all 135,000 cases of TB were contracted during 2005. Which of the following statements is true? • The case-fatality rate provides a reasonable estimate of incidence • The prevalence of TB for 2005 is equal to the denominator of the case-fatality rate • The duration of TB is brief • All of the above • None of the above That's correct! Since the duration of TB can be longer than 1 year, neither disease incidence nor prevalence can be validly estimated by mortality indicators. Question 25 Which of the following statements pertains to relative survival? • Refers to survival of first-degree relatives • Is equal to the case-fatality rate • Is generally closer to observed survival rates in younger age groups • Is generally closer to observed survival rates in older age groups • Provides an estimate of proportionate mortality That's correct! Relative survival is close to observed survival rate when there are few competing causes of death. This occurs primarily in younger age groups who are less likely to experience mortality events compared to older age groups. Question 26 What was the probability of surviving the second year given survival to the end of the first year? That's correct! The probability of surviving the second year given survival to the end of the year indicates that we are concerned with the survival proportion of those alive at the end of year 1. In this example, we have 950 persons alive at the beginning of year 2 (thus, the end of year 1). Of this group, 30 die by the end of the second year. This gives a survival rate of 920 divided by 950, or 97%. Question 27 What was the cumulative probability of surviving after only 2 years of follow-up? That's correct! The cumulative survival is the total number of those surviving by the end of the second year divided by all persons who were alive at the beginning of follow-up. In this example, there were 920 survivors among the 1,000 persons who were alive at the beginning of observation. This equals a cumulative survival of 92%. Alternatively, this cumulative survival can be calculated by multiplying the survival rates for each period of interest. In this example 95% survival for year 1 multiplied by 97% survival for year 2 equals a cumulative survival of 92%. Question 28 An important assumption in this type of analysis is that: • No change has occurred in the effectiveness of treatment during the 3-year period • Treatment has improved during the period of the study • Persons lost to follow-up are counted in the table • The data are age-adjusted • Both a and c That's correct! An important assumption of survival analysis is that separate strata, in this example, years of follow-up, have similar underlying rates of survival. If some external factor were to differentially influence survival during a portion of the follow-up time then we would not be able to assume a cumulative survival that is consistent during the entire study period. Question 29 Complete the table. What is the probability that a person enrolled in the study will survive to the end of the third year? That's correct! The answer is 48.6%. Completing the table gives the following results for each column: Column 5 from top to bottom: 350, 255, 184 Column 6 from top to bottom: 0.229, 0.228, 0.185 Column 7 from top to bottom: 0.771, 0.772, 0.815 Column 8 from top to bottom: 0.771, 0.596, 0.486 The cumulative survival at the end of the follow-up period equals the probability of survival during each of the years of follow-up. In this example, multiplying 0.771 by 0.772, then multiplying this product by 0.815 equals the cumulative survival rate of 0.486. Question 30 Before reporting the results of this survival analysis, the investigators compared baseline characteristics of the 38 people who withdrew from the study before its end to those who had complete follow-up. This was done for which of the following reasons: • To test whether randomization was successful • To check for changes in treatment • To check whether those remaining in the study represent the total study population • To check whether the survival estimate of those remaining in the study is the same as the general population • To check that the survival estimate for those lost to follow-up is the same as the general population That's correct! A key assumption for the use of survival analysis is that persons who are lost to follow-up have the same mortality experience as those remaining in the study. The failure to satisfy this assumption introduces a bias in the survival estimates since the observed population has different attributes that are associated with survival compared to the population that is lost to follow-up. Question 31 Which of the following is a key assumption involved in the use of life-table analysis? • The risk of disease does not change within each interval over the period of observation • There are no losses to follow-up in the study population • The frequency of exposure is similar in treatment and comparison groups • The disease is common • The study subjects are representative of the population from which they were drawn That's correct! Life-table analysis depends upon a consistent rate of survival during all periods of the study. Changes in the rate of survival may be due to external influences that are operating at later times on only a portion of the initial population. Since those who have died earlier in the study period will not experience these external influences, the comparison between periods is rendered invalid. Question 32 Which of the following is a measure of disease prognosis? • Prevalence • Median survival time • Age-adjusted mortality rates • Standardized mortality ratio • Proportionate mortality ratio That's correct! Disease prognosis indicates the likelihood of survival once a disease has become manifest. The median survival time reflects the length of time that the 50th percentile of affected persons has. It differs from the mean survival time in that the mean survival time is an average that may be influenced by extremely low or high survival times. The median survival time consists of an ordering of all survival times with the midpoint of the distribution taken as the duration of survival. Question 33 In 2003, Sudden Acute Respiratory Syndrome (SARS) appeared in several countries, mainly in Asia. The disease was determined to have been caused by a virus that could be spread from person –to person from the index case occurring in mainland China. This table reflects the total number of reported cases of SARS and deaths among those cases as best as can be determined. What is the overall case-fatality rate for the worldwide epidemic of SARS? • 9.5% • 12.4% • 16.0% • Cannot be determined as the data are not age-adjusted • Cannot be determined as the total number of all deaths is not known That's correct! This can be found by dividing the total number of deaths due to SARS by the total number of cases. This equals a case-fatality rate of 9.5%. Question 34 In 2003, Sudden Acute Respiratory Syndrome (SARS) appeared in several countries, mainly in Asia. The disease was determined to have been caused by a virus that could be spread from person –to person from the index case occurring in mainland China. This table reflects the total number of reported cases of SARS and deaths among those cases as best as can be determined. Based on the table, we can conclude that the case-fatality rate (CFR) in Vietnam: • Is the same as the case-fatality rate in Singapore • Is twice as great as the case-fatality rate in Singapore • Is almost one half that of the case-fatality rate in Singapore • Cannot be determined because the data are not age-adjusted • Depends on the number of secondary cases That's correct! The CFR in Vietnam equals 5 divided by 63, or 7.9%, while that of Singapore equals 15%. This is approximately one half the rate. Question 35 In 2003, Sudden Acute Respiratory Syndrome (SARS) appeared in several countries, mainly in Asia. The disease was determined to have been caused by a virus that could be spread from person –to person from the index case occurring in mainland China. This table reflects the total number of reported cases of SARS and deaths among those cases as best as can be determined. Following a revision in the case definition, more persons were found to have suffered from an infection with the SARS virus. The inclusion of these cases, almost all asymptomatic, did not impact the total number of SARS fatalities. What happened to the case-fatality rate (CFR) following this reclassification? • It remained the same • It was increased • It was decreased • It cannot be determined without knowing the number of new cases • It cannot be determined without age-adjustment That's correct! The increase in prevalent cases with no change in mortality would decrease the CFR since the numerator, number of deaths due to SARS, would stay the same while the denominator, number of cases, increased. Question 36 What is the probability of surviving the second year of the study given that a person survived the first year? That's correct! The independent probability of surviving the second year for all persons who survived the first year is found by dividing the number of survivors at the end of the period by the total number present at the beginning of the period. In addition, for those who withdraw during the interval, only 50% of these persons should be counted as being present during the interval. The table should be completed with the following values: Column (B) from top to bottom: 248, 124, 55 Column (E) from top to bottom: 0.410, 0.470, 0.296 Column (F) from top to bottom: 0.590, 0.530, 0.704 Column (G) from top to bottom: 0.590, 0.313, 0.220 Therefore, the second year survival probability among all those surviving in the study past the first year is 53%. The probability of dying during the second year equals the number of deaths during the interval (55) divided by the total number of persons alive at the start of the interval less one half of those withdrawing from the study (117). Subtracting this value from 100% results in a survival rate of 53% for the interval. Question 37 For all people in the study, what is the probability of surviving to the end of the second year? That's correct! The cumulative probability of survival through the second year equals the probability of survival for the first year multiplied by the probability for the second year. This equals 59% multiplied by 53%, or 31.3%. Question 38 What is the probability chance of surviving 3 years after diagnosis? That's correct! The cumulative survival probability for all 3 years equals the product of the independent interval survival probabilities. In this example, 59% multiplied by 53% multiplied by 70.4% gives a cumulative survival probability of 22%. Question 39 What is the total number of person-years of follow-up for patients in the study assuming a median survival time of one half of the year for all persons dying during an interval and an observation time of one half of the year for all persons withdrawing from the study? That's correct! This calculation involves attributing the correct amounts of person-years to each group during an interval. For the first year of the study, 96 deaths occur. Using the median survival time, we can calculate that these persons contributed 48 person-years of observation. Additionally, 28 persons withdraw from the study. Again, allocating one half of the year to each of these patients results in 14 person-years. Of the remaining 124 persons who survive for the full year, they contribute 124 person-years of observation. The total person-time for the first year of the study is 186 person-years. Continuing with this same approach for years 2 and 3 of the study, we arrive at a total of 321.5 person-years of observed study time. Question 40 Before reporting the results of this survival analysis, the investigators compared baseline characteristics of the 44 people who withdrew from the study before its end to those who had complete follow-up. This was done: • To test whether randomization produced similar groups • To check for changes in prognosis • To check whether those withdrawing from the study are similar to persons remaining in the study • To check whether the outcome of those remaining in the study are the same as the underlying population • To check for confounders in the exposed and nonexposed group That's correct! A key assumption in life table analysis is to insure that the experience of those lost to follow-up, or withdrawals from the study, is the same as those remaining under observation. Chapters 7-8 Question 1 Which of the following statements best describe efficacy? • It is an estimate of the benefit of treatment under ideal conditions • It is an estimate of the benefit of treatment under routine conditions • It is an estimate of the reduction of disease in treated groups • It is an estimate of the reduction of disease in the population • It depends on the prevalence of disease That's correct! Question 2 A study is conducted for a pharmaceutical agent that has shown promise for reducing heart disease among women. In order to more fully test the agent, an additional study is done restricting the participants to be randomized to those who have a history of hypertension. Which of the following advantages cannot be claimed by the researchers? • Power of the study is increased • Potential benefits in high-risk populations are increased • Validity of the study is increased by focus on a homogenous population • The generalizability of the study is increased • The overall cost of the study is decreased That's correct! Restricting the study to a high-risk group will only fail to increase the generalizability of the findings since the study results will apply only to a more specific group of women who share a history of hypertension. Question 3 A new drug treatment for cardiac thrombus claims to have a higher success rate than the current drug. A strong sign of the potential success is the lack of internal hemorrhaging starting 2 days after treatment. 168 patients who require treatment for cardiac thrombi are randomized after agreeing to participate in a trial of the new drug. The researchers were interested in whether the new drug reduced the need for blood transfusions due to internal hemorrhage compared to the current treatment. The following table summarizes the results of her study: What is the incidence of needing a blood transfusion in the group of persons who were randomized to the new drug treatment? • 31.0% • 41.1% • 51.2% • 62.3% • Incidence cannot be calculated with the information in this table That's correct! Incidence is the development of the outcome under investigation among those at risk. In this instance, 43 participants “developed” the need for a blood transfusion among the 84 persons in the new drug treatment group. Question 4 A new drug treatment for cardiac thrombus claims to have a higher success rate than the current drug. A strong sign of the potential success is the lack of internal hemorrhaging starting 2 days after treatment. 168 patients who require treatment for cardiac thrombi are randomized after agreeing to participate in a trial of the new drug. The researchers were interested in whether the new drug reduced the need for blood transfusions due to internal hemorrhage compared to the current treatment. The following table summarizes the results of her study: What is the number of persons who died in hospital in the study? • 7 • 17 • 28 • 35 • The number of deaths cannot be calculated as the death rate has not been age-adjusted That's correct! The death rate in the study for all participants is 0.167. Multiplying this number by 168, the total number of participants, results in 28 deaths in hospital following treatment. Question 5 A new drug treatment for cardiac thrombus claims to have a higher success rate than the current drug. A strong sign of the potential success is the lack of internal hemorrhaging starting 2 days after treatment. 168 patients who require treatment for cardiac thrombi are randomized after agreeing to participate in a trial of the new drug. The researchers were interested in whether the new drug reduced the need for blood transfusions due to internal hemorrhage compared to the current treatment. The following table summarizes the results of her study: What is the main advantage of the randomization of the 168 study participants to one of the two drug treatment groups? • Ensures that the researchers are masked to the treatment group assignment for each participant • Facilitates the age-adjustment of the death rate in each group • Reduces the potential for selection bias in allocation of treatment group • Ensures that the study groups are comparable for characteristics such as age and severity of condition prior to treatment assignment • Ensures that non-compliance will not affect the results That's correct! Though the study is being conducted in a group of persons with a similar diagnosis, there should be differences in age, gender, race, and severity of conditions in the 168 participants. In order to ensure that those with a healthier profile are not preferentially selected for one of the treatment groups, randomization is used. Question 6 A new drug treatment for cardiac thrombus claims to have a higher success rate than the current drug. A strong sign of the potential success is the lack of internal hemorrhaging starting 2 days after treatment. 168 patients who require treatment for cardiac thrombi are randomized after agreeing to participate in a trial of the new drug. The researchers were interested in whether the new drug reduced the need for blood transfusions due to internal hemorrhage compared to the current treatment. The following table summarizes the results of her study: The researchers interpret the findings to conclude that the new drug treatment is more likely to result in a blood transfusion and subsequent death. This statement is: • Incorrect as the data do not indicate the death rate among only those receiving a blood transfusion • Incorrect as the number of expected deaths is not known • Incorrect as the cause-specific death rate for internal hemorrhaging is not reported • Incorrect as the duration of time from blood transfusion to death is not reported • Correct That's correct! Though the death rate among those receiving a transfusion cannot be directly compared with this table, the high rate of transfusion and subsequent death in the new drug treatment group strongly implies that the new drug treatment is more likely to result in these outcomes. Question 7 A randomized, double-blind clinical trial of a varicella vaccine observed an estimated incidence of 25% chickenpox episodes in persons receiving the vaccine, compared to 80% among persons receiving a placebo. The estimated efficacy of the vaccine is: • 55.0% • 65.0% • 68.8% • 71.4% • 80.0% That's correct! The efficacy is calculated by subtracting the rate in those vaccinated from the placebo rate and dividing by the placebo rate. In this example, 80% minus 25% equals 55%. Dividing by 80% results in an efficacy of 68.8%. Question 8 A multicenter double-blind randomized study was carried out to compare the effect of drug X with that of a placebo in patients surviving acute myocardial infarction (AMI). Treatment with the drug started 7 days after infarction in 1,884 patients, 52% of all persons who were evaluated for entry into the study. 945 participants were randomized to treatment with drug X while 939 were assigned to the placebo group. Patients were then followed for 12 months for reinfarction. There were 152 deaths in the placebo group and 98 in the group receiving drug X. After entry into the study, patients were first classified into three groups, those who had a previous AMI, those with a first AMI who were at high risk for other cardiovascular diseases such as congestive heart failure, and those with a first AMI who were at low risk for other cardiovascular diseases. Which term best describes the study design? • Cohort study • Randomized clinical trial with crossover design • Randomized clinical trial with factorial design • Randomized clinical trial with stratified randomization • Case study design That's correct! The study design is a multicenter randomized clinical trial with a stratified design. The participants are classified into one of three strata, then randomized to either drug X or placebo groups. They are then followed for 1 year after entry into the study. Question 9 A multicenter double-blind randomized study was carried out to compare the effect of drug X with that of a placebo in patients surviving acute myocardial infarction (AMI). Treatment with the drug started 7 days after infarction in 1,884 patients, 52% of all persons who were evaluated for entry into the study. 945 participants were randomized to treatment with drug X while 939 were assigned to the placebo group. Patients were then followed for 12 months for reinfarction. There were 152 deaths in the placebo group and 98 in the group receiving drug X. After assignment to treatment group, 77% of those in the placebo group were men, while 80% of those in the drug X group were men. Which statement is most likely to be true? • Randomization failed because the percentage of men is different in each group • Randomization failed because the researchers should have made sure that each group had an equal percentage of men • Randomization failed since men are more likely to have a recurrent AMI in the drug X group • Randomization was successful because there are more men in the treatment group • Randomization was successful since the investigators did not alter the selection of participants in either group in order to ensure equal percentages of men That's correct! Randomization is the process of assigning participants to a study group with nonpredictable assignment. Randomization does not guarantee equally comparable groups; however, it ensures that the researchers do not influence the selection of individual participants into a treatment group. Over large samples, characteristics will tend to be approximately equal, but this is not guaranteed since random chance can influence assignments. Question 10 A multicenter double-blind randomized study was carried out to compare the effect of drug X with that of a placebo in patients surviving acute myocardial infarction (AMI). Treatment with the drug started 7 days after infarction in 1,884 patients, 52% of all persons who were evaluated for entry into the study. 945 participants were randomized to treatment with drug X while 939 were assigned to the placebo group. Patients were then followed for 12 months for reinfarction. There were 152 deaths in the placebo group and 98 in the group receiving drug X. A preliminary analysis was conducted after 6 months and found that 87% of participants in the placebo group and 85% of those in the drug X group had taken more than 90% of their prescribed dosages. Which statement best describes this finding? • Randomization failed to ensure an equal likelihood of compliance with treatment • The characteristics of patients who failed to comply with the treatment dosages should be assessed as they may differ from those who complied • The study will find a decreased effect of AMI prevention in the drug X group since fewer participants complied with the prescribed treatment • The study will find an increased effect of AMI prevention in the placebo group since more participants complied with the prescribed treatment • The researchers should consider a crossover design in order to calibrate the compliance rates between each group That's correct! The compliance rates are high and are approximately equal between the two groups so we can expect the estimated effects of treatment to be reasonably valid. An analysis should be conducted of characteristics of non-compliers as they may differ in terms of important predictors of recurrent AMI from those who take the prescribed dosages. Question 11 A multicenter double-blind randomized study was carried out to compare the effect of drug X with that of a placebo in patients surviving acute myocardial infarction (AMI). Treatment with the drug started 7 days after infarction in 1,884 patients, 52% of all persons who were evaluated for entry into the study. 945 participants were randomized to treatment with drug X while 939 were assigned to the placebo group. Patients were then followed for 12 months for reinfarction. There were 152 deaths in the placebo group and 98 in the group receiving drug X. Which of the following statements best describes the reason for conducting the study as a double-blind trial? • The placebo group will not have any reported side effects • The researchers might assign participants with more serious AMIs to the treatment group • Since the outcome studied is death, blinding the participants is unnecessary for this trial • Double blinding ensures that potential biases regarding selection, follow-up, and analysis can be reduced • Double blinding is no longer necessary after randomization is complete since the researchers cannot change the treatment group assignments That's correct! Both participants and researchers can have preconceived biases regarding the potential effect of a studied treatment. By masking the assignment of subjects from themselves and the researchers, the effect that these biases may have on the comparative analyses can be reduced. Question 12 A multicenter double-blind randomized study was carried out to compare the effect of drug X with that of a placebo in patients surviving acute myocardial infarction (AMI). Treatment with the drug started 7 days after infarction in 1,884 patients, 52% of all persons who were evaluated for entry into the study. 945 participants were randomized to treatment with drug X while 939 were assigned to the placebo group. Patients were then followed for 12 months for reinfarction. There were 152 deaths in the placebo group and 98 in the group receiving drug X. The researchers conclude that treatment with drug X reduces mortality in patients who have had an AMI. The researchers are: • Correct because there are a fewer number of deaths in the drug X group • Correct because the rate of death is decreased in the drug X group • Incorrect because non-compliance may have reduced the number of observed deaths in the drug X group compared to the placebo group • Incorrect because randomization was not successful • Incorrect as the results are not generalizable to all patients with AMI since the researchers excluded 48% of the persons evaluated for the study That's correct! The rate of death in the drug X group was 10.4% while it was 16.2% in the placebo group. Although a statistical test such as a chi-square test should be done, the large difference in these rates between two approximately equivalent groups indicates that drug X contributed to increased survivability compared to those receiving the placebo. Question 13 The following data come from a study of approaches to smoking cessation. Smokers who want to quit were randomized to one of four groups: control group C who received no intervention assistance, quitting guide group Q who received brochures about how to quit smoking, quitting guide and support group QS who received quitting brochures as well as social support brochures listing benefits of smoking cessation, and telephone support group T who received the brochures and a monthly phone call from a counselor. Participants received mailed surveys at 8, 16, and 24 months after randomization. The results after 2 years are in the table below. What is the overall quit rate after 2 years of follow-up? That's correct! The overall quit rate after 2 years is 17.6%. This is estimated by summing the total number of those who quit smoking (331) and dividing by all participants who returned the survey after 2 years (1877). Question 14 The following data come from a study of approaches to smoking cessation. Smokers who want to quit were randomized to one of four groups: control group C who received no intervention assistance, quitting guide group Q who received brochures about how to quit smoking, quitting guide and support group QS who received quitting brochures as well as social support brochures listing benefits of smoking cessation, and telephone support group T who received the brochures and a monthly phone call from a counselor. Participants received mailed surveys at 8, 16, and 24 months after randomization. The results after 2 years are in the table below. Which group had the least success in terms of quitting smoking? • Group C • Group Q • Group QS • Group T • It cannot be determined since each group had participants with missing outcomes That's correct! Each group has approximately equal numbers of participants with missing information. Therefore, the rates for quitting by group are 18.1% for group C, 15.2% for group Q, 14.2% for group QS, and 23% for group T. Group QS had the lowest rate of quitting among the four groups. Question 15 The following data come from a study of approaches to smoking cessation. Smokers who want to quit were randomized to one of four groups: control group C who received no intervention assistance, quitting guide group Q who received brochures about how to quit smoking, quitting guide and support group QS who received quitting brochures as well as social support brochures listing benefits of smoking cessation, and telephone support group T who received the brochures and a monthly phone call from a counselor. Participants received mailed surveys at 8, 16, and 24 months after randomization. The results after 2 years are in the table below. What is the main purpose of randomization in this study? • To avoid assigning more persons who have tried and failed to quit in the past to the control group • To blind the researchers to the treatment group assignments • To ensure that rates of smoking cessation will be the same among the groups • To minimize differences in the dropout rate between the groups • To prevent subjects in the control group from reading materials that would help them to quit smoking That's correct! The goal of randomization is to reduce selection bias in the assignment of study groups. Obviously, a participant’s previous history with smoking cessation is an important predictor of his future success. In order to avoid assigning more persons who had tried and failed in the past to one specific group, randomization of all participants is the best approach. Chapters 9-15 Question 1 A study is planned to investigate the relationship of factors associated with maternal hypertension and the risk of congenital birth defects in children born to these women. Which of the following would be a reason for using a cohort study design? • The need to obtain data on the incidence of early fetal losses due to congenital birth defects • The low rate of congenital birth defects • The development of pregnancy-related hypertension in asymptomatic women • The consistency of recall of risk factors among women having children with and without congenital birth defects and those having children • Testing hypotheses about several different risk factors for congenital birth defects such as maternal age, diabetes, and previous miscarriage history That's correct! The cohort design is best for observing the incidence of a disease in persons who do not have the outcome at baseline. In this study, the researchers will start with women planning on becoming pregnant and stratify them by presence of hypertension. Since all women will be followed over time, the occurrence of fetal loss can be tracked by the investigators during the study. Question 2 A researcher is interested in the etiology of myocardial infarction (MI) among men between 18 and 40 years of age. Her hypothesis concerns the influence of diets high in fat and subsequent development of MI. What is the best study approach to address this hypothesis? • Case-control study with cases of MI identified post-event and controls sampled from healthy men in the population, then have both groups complete dietary surveys • Case-report study describing the dietary habits in 100 men having an MI • Ecologic study with the rates of MI compared between cities with higher than average dietary fat intakes and cities with lower than average dietary fat intakes • Retrospective cohort study with medical records used to collect information on diet among men with and without an MI • Prospective cohort study identifying a population of men in this age group, administering a dietary survey and classifying men by high and low fat diet, then following both groups for the development of an MI That's correct! The choice of a prospective cohort study allows the researcher to select the population of interest (men ages 18 to 40 years), classify the exposure after an initial assessment, and then follow all men in the study for incident outcomes. This approach is best described as a cohort study. Question 3 Which of the following is an advantage to the conduct of a cohort study? • The study population is the same with regard to the risk factors for disease • The disease under study occurs rarely in the population • The incidence of the disease is high in the nonexposed group • The incidence of the disease is high in the exposed group • The study population includes a high number of undiagnosed, asymptomatic individuals with the disease That's correct! A cohort study entails classification of the study population by exposure to the risk factor of interest. The subsequent incidence of disease occurs during the follow-up time of observation of the study population. A high incidence of disease in the exposed group provides the researcher with a large number of outcomes and provides an initial association with the risk factor if the disease occurs in the exposed group. Question 4 A cohort study is planned to investigate the potential adverse health effects of daily alcohol consumption. In assessing the risk of liver cancer related to alcoholism, which of the following is not an important methodologic consideration? • The need to study a large number of persons for a rare disease outcome • The difficulty of finding enough persons with liver cancer at the beginning of the study in whom alcohol consumption could be determined • The possible bias associated with persons describing alcohol usage • The likelihood that doctors would monitor alcoholics more closely for liver cancers • The possibility that persons would change their alcohol consumption practices during the study period That's correct! A cohort study must take into account methodologic issues related to rare disease occurrences, classification of exposure throughout the study conduct, and potential biases related to identifying outcome events. Ideally, a cohort study would start with nondiseased individuals who are followed over time, thus finding persons with liver cancer at the beginning of the study would not be a consideration for a cohort study design. Question 5 Which of the following is not an advantage of a retrospective cohort study? • Allows for the study of many disease outcomes resulting from an exposure • Incidence rates can be calculated • Possible bias due to selection of the cohort is eliminated • Potential recall bias can be minimized • Requires less follow-up time than a prospective cohort study That's correct! Retrospective cohort studies depend on the ability of researchers to identify eligible cohort members, describe their past exposure using historical records, and to follow the cohort until the disease develops. Relying on past records to select persons for entry into the cohort study could be compromised by biases regarding the investigator’s theorized association of the exposure and disease. Question 6 In a study of the adverse effects of x-rays among children, a retrospective cohort study was done using records from several large children’s hospitals for the period of 1980 to 1985. 10,000 children were selected as a representative population of ill children seen at the hospitals during that time. Subjects were classified according to whether or not they received an x-ray during their stay in the hospital and were followed from their hospital stay through 2005 for the development of cancer. During the follow-up period, 49 incident cancers occurred in 3,263 children who had received an x-ray, and 47 incident cancers occurred in the 6,737 children who had not received an x-ray during their hospitalization. In this retrospective study, which of the following groups are eligible for selection into the study? • Children receiving x-rays in 1990 • Children receiving x-rays in 1975 • Children receiving x-rays for broken bones in 1983 • Children in the hospital for cancer treatment in 1985 • Children who were treated in private clinics and hospitals in 1981 That's correct! Children who received an x-ray during the defined study period and did not have a cancer diagnosis during that time can be included in the study. Question 7 In a study of the adverse effects of x-rays among children, a retrospective cohort study was done using records from several large children’s hospitals for the period of 1980 to 1985. 10,000 children were selected as a representative population of ill children seen at the hospitals during that time. Subjects were classified according to whether or not they received an x-ray during their stay in the hospital and were followed from their hospital stay through 2005 for the development of cancer. During the follow-up period, 49 incident cancers occurred in 3,263 children who had received an x-ray, and 47 incident cancers occurred in the 6,737 children who had not received an x-ray during their hospitalization. What are the rates of cancer incidence in each exposure group? That's correct! The rate of cancer incidence in the x-ray exposed group is 15 per 1,000 (49 divided by 3,263 multiplied by 1,000) and 7 per 1,000 in the nonexposed group (47 divided by 6,737 multiplied by 1,000). Question 8 In a study of the adverse effects of x-rays among children, a retrospective cohort study was done using records from several large children’s hospitals for the period of 1980 to 1985. 10,000 children were selected as a representative population of ill children seen at the hospitals during that time. Subjects were classified according to whether or not they received an x-ray during their stay in the hospital and were followed from their hospital stay through 2005 for the development of cancer. During the follow-up period, 49 incident cancers occurred in 3,263 children who had received an x-ray, and 47 incident cancers occurred in the 6,737 children who had not received an x-ray during their hospitalization. What is the attributable risk of cancer due to x-ray in this study population? What is the interpretation of this estimate? That's correct! The attributable risk equals the incidence rate in the exposed group minus the incidence rate in the nonexposed group. In this instance, the attributable risk is 8 per 1,000. This estimate is interpreted to mean that 8 of the 15 incident cases of cancer occurring in 1,000 children exposed to x-rays are due to the exposure itself. Question 9 In a study of the adverse effects of x-rays among children, a retrospective cohort study was done using records from several large children’s hospitals for the period of 1980 to 1985. 10,000 children were selected as a representative population of ill children seen at the hospitals during that time. Subjects were classified according to whether or not they received an x-ray during their stay in the hospital and were followed from their hospital stay through 2005 for the development of cancer. During the follow-up period, 49 incident cancers occurred in 3,263 children who had received an x-ray, and 47 incident cancers occurred in the 6,737 children who had not received an x-ray during their hospitalization. What is the risk ratio for the effect of exposure on the development of cancer in this study? What is the interpretation of this estimated ratio? That's correct! The risk ratio is found by dividing the rate of cancers for each exposure group. In this instance, 15 per 1,000 (0.015) divided by 7 per 1,000 (0.007) equals a risk ratio of 2.1. This indicates that the risk of cancer is twice as high in children who received x-rays during their stay in the hospital. Question 10 In a study of the adverse effects of x-rays among children, a retrospective cohort study was done using records from several large children’s hospitals for the period of 1980 to 1985. 10,000 children were selected as a representative population of ill children seen at the hospitals during that time. Subjects were classified according to whether or not they received an x-ray during their stay in the hospital and were followed from their hospital stay through 2005 for the development of cancer. During the follow-up period, 49 incident cancers occurred in 3,263 children who had received an x-ray, and 47 incident cancers occurred in the 6,737 children who had not received an x-ray during their hospitalization. Which of the following issues should the investigators consider when interpreting whether a causal association exists between cancer incidence and childhood x-ray? • Some study subjects were treated for cancer starting in 1980 • Some study subjects had parents who were diagnosed with cancer • Some children received x-rays at other hospitals not included in this study • The children were different ages when they were admitted to the hospital • All of the above That's correct! Each of these issues may be related to the exposure and cancer association that the investigators are reporting and thus they must be considered. First, subjects treated for cancers in their initial hospitalization should have been excluded from the study selection. Second, genetic predisposition to cancer is an important factor in cancer incidence. Third, misclassified exposure may influence the relationship, especially if children received x-rays at other hospitals but did not have this fact noted in their medical records at the study hospital. Finally, age of the children is an important factor related to x-ray dosage, development, and subsequent cancer incidence. All of these issues may lead to important differences between the two defined exposure groups. Question 11 Which of the following may be a factor that would result from the inability to use randomization in a cohort study? • The possibility that a factor which leads to exposure may be causally associated with the disease • The possibility that a higher proportion of exposed persons may be included in the study • The possibility that a higher proportion of nonexposed persons may be included in the study • The study will take longer to conduct if randomization is not used • The possibility that several different types of diseases will develop in the study population That's correct! Randomization removes potential bias from the designation of treatment, or exposure, groups. Without this step, it may be likely that the exposed and nonexposed groups in a cohort study are misidentified due to other factors that are associated with exposure and subsequent disease outcomes. Question 12 6,750 people who were free of disease X were enrolled in a cohort study in 1985 and followed with annual exams and interviews through 1995. Exposure to factor A was determined at study enrollment and the participants were followed until 1995 to observe new cases of disease X. Data from the study at the end of follow-up are shown in the following table. What is the incidence rate of disease X among persons exposed to factor A? • 0.04 • 0.19 • 0.25 • 4.00 • 5.17 That's correct! The incidence rate for disease X among exposed persons is found by dividing 120 (the number of people with disease X) by the total number of exposed persons (120 plus 2880). If multiplied by 100 then the incidence rate would equal 4 per 100 persons; however, this metric is not explicitly requested. Question 13 6,750 people who were free of disease X were enrolled in a cohort study in 1985 and followed with annual exams and interviews through 1995. Exposure to factor A was determined at study enrollment and the participants were followed until 1995 to observe new cases of disease X. Data from the study at the end of follow-up are shown in the following table. What is the relative risk for the effect of exposure to factor A on disease X? • 0.20 • 1.29 • 4.00 • 5.00 • 5.17 That's correct! The relative risk equals the incidence rate in the exposed divided by the incidence rate in the not exposed. In this example, the incidence rate in the exposed group is 0.04 divided by the incidence rate in the not exposed (0.008). The ratio is equal to 5.0 in this example. This indicates that the incidence rate of disease X is 5 times higher in those exposed to factor A. Question 14 In 2002, investigators started a study of the association of cholesterol levels and stroke in a group of 2,000 healthy persons who had participated in a cholesterol screening program in 1992. The investigators determined exposure categories using cholesterol levels in all persons that were measured at the time of the screening program. A cutoff value of 200 mg/dL was used to define “high” cholesterol while those with levels below 200 were identified as having “low” cholesterol. Using this definition, 1,000 persons had “high” cholesterol levels while the remaining 1,000 persons had “low” cholesterol. The investigators determined that 150 cases of stroke occurred by the end of 2004, with 113 cases occurring in the high cholesterol group. What is the study design that the investigators used? • Case-control study • Retrospective cohort study • Prospective cohort study • Cross-sectional study • Randomized clinical trial That's correct! In this study, a study population is determined to include persons who were disease-free at baseline. Using historical records, exposure status was determined for the study population. Subsequent observation enabled the researchers to ascertain incident cases of stroke among those included. Question 15 In 2002, investigators started a study of the association of cholesterol levels and stroke in a group of 2,000 healthy persons who had participated in a cholesterol screening program in 1992. The investigators determined exposure categories using cholesterol levels in all persons that were measured at the time of the screening program. A cutoff value of 200 mg/dL was used to define “high” cholesterol while those with levels below 200 were identified as having “low” cholesterol. Using this definition, 1,000 persons had “high” cholesterol levels while the remaining 1,000 persons had “low” cholesterol. The investigators determined that 150 cases of stroke occurred by the end of 2004, with 113 cases occurring in the high cholesterol group. What type of risk measure should the investigators calculate? • Odds ratio • Prevalence rate • Multiplicative interaction • Positive predictive value • Relative risk That's correct! The relative risk estimates the ratio of disease incidence in the exposed group relative to that of the nonexposed group. All other things being equal, this ratio can be interpreted to describe the relative increase (or decrease) in the incidence of disease following exposure. Question 16 In 2002, investigators started a study of the association of cholesterol levels and stroke in a group of 2,000 healthy persons who had participated in a cholesterol screening program in 1992. The investigators determined exposure categories using cholesterol levels in all persons that were measured at the time of the screening program. A cutoff value of 200 mg/dL was used to define “high” cholesterol while those with levels below 200 were identified as having “low” cholesterol. Using this definition, 1,000 persons had “high” cholesterol levels while the remaining 1,000 persons had “low” cholesterol. The investigators determined that 150 cases of stroke occurred by the end of 2004, with 113 cases occurring in the high cholesterol group. Using the reported study data, what is the estimate of the risk measure that was chosen? • 3.1 • 3.3 • 67% • 1.0 • 0.3 That's correct! The relative risk of exposure equals 3.1 in this study. This is calculated by dividing the incidence rate for stroke among those with high cholesterol (113 divided by 1,000, or 0.113) by the incidence rate for stroke among those with low cholesterol (37 divided by 1,000, or 0.037). The ratio of these incidence rates is 3.1 and can be interpreted to indicate that stroke is 3 times more likely to occur among those with high cholesterol. Question 17 In 2002, investigators started a study of the association of cholesterol levels and stroke in a group of 2,000 healthy persons who had participated in a cholesterol screening program in 1992. The investigators determined exposure categories using cholesterol levels in all persons that were measured at the time of the screening program. A cutoff value of 200 mg/dL was used to define “high” cholesterol while those with levels below 200 were identified as having “low” cholesterol. Using this definition, 1,000 persons had “high” cholesterol levels while the remaining 1,000 persons had “low” cholesterol. The investigators determined that 150 cases of stroke occurred by the end of 2004, with 113 cases occurring in the high cholesterol group. What is a necessary assumption for the study’s findings to be true? • There is no recall bias among the study participants • The cholesterol level measured in 1992 is a valid determinant of exposure status during the entire study period • The high and low cholesterol groups are randomly assigned • The age distribution of the cases and controls is equivalent • The cholesterol measure is modified by cigarette smoking practice That's correct! Using a retrospective design to determine past exposure levels means that the exposure levels determined in 1992 must be valid for the entire follow-up period. If many of those labeled as high cholesterol had lowered their cholesterol levels during the next 12 years then the exposure classification would be incorrect and the results of the study would not be valid. Question 18 The following data are from a prospective study that examined the relationship between smoking and incidence of both myocardial infarction (heart attack) and breast cancer among women. What is the proportion attributable risk of breast cancer among smokers? • 20% • 40% • 50% • 60% • 80% That's correct! The proportion attributable risk (PAR) equals the incidence in the exposed less the incidence in the nonexposed divided by the incidence in the exposed. The percentage calculated expresses the proportion of the disease under investigation that can be attributed to exposure. In this study, the incidence of breast cancer in smokers is 40 per 1,000 (0.04) while the incidence in the nonexposed is 16 per 1,000 (0.016). Subtracting the latter from the former, the difference in the incidence rate is 0.024. Dividing this difference by the incidence in smokers results in a PAR of 60%. Question 19 The following data are from a prospective study that examined the relationship between smoking and incidence of both myocardial infarction (heart attack) and breast cancer among women. What is the proportion attributable risk of breast cancer among smokers? What is the relative risk of myocardial infarction for smokers? • 0.5 • 1.0 • 1.3 • 2.0 • Cannot be calculated because the nondiseased numbers are not given That's correct! The relative risk for myocardial infarction equals the incidence rate in smokers (0.1) divided by the incidence rate in nonsmokers (0.08). The ratio of these incidence rates equals 1.3. This can be interpreted to indicate that the risk of myocardial infarction is 1.3 times greater in smokers compared to nonsmokers. Question 20 The following data are from a prospective study that examined the relationship between smoking and incidence of both myocardial infarction (heart attack) and breast cancer among women. If the proportion of smokers in this population is 30%, what is the population proportion attributable risk of breast cancer due to smoking? • 28% • 31% • 43% • 56% • 80% That's correct! The population proportion attributable risk (PPAR) equals the incidence in the total population less the incidence in the nonexposed divided by the incidence in the total population. In order to calculate the incidence in the total population, a weighted average of the two incidence rates must be calculated. The weighting factor is the prevalence of exposure in the total population. In this example, the incidence rate for the total population equals the incidence rate in smokers multiplied by the percentage of smokers plus the incidence rate in nonsmokers multiplied by the percentage of nonsmokers in the total population. In this data, the total population incidence is 0.04 times 0.3 plus 0.016 times 0.7. This gives a total population incidence of 0.023, or 23 per 1,000 persons. Obviously this incidence rate is much closer to the incidence rate in nonsmokers as the majority of the population does not smoke. Using the total population incidence in the PPAR calculation then gives an estimate of 31%. This is found by subtracting 0.016 from 0.023 and dividing this result by 0.023. Question 21 A researcher is interested in the etiology of cervical cancer among women between 18 and 35 years of age. Her hypothesis concerns the influence of sexually transmitted diseases such as human papilloma virus (HPV) and subsequent development of cancer. What is the best study approach to address this hypothesis? • Case-control study of women 18 to 35 years of age identified with cervical cancer in the hospital (cases) compared to women admitted for other diseases (controls) • Descriptive study of 100 cases of cervical cancer • Prospective cohort study of women enrolled at 18 years of age and followed to 35 years of age • Retrospective cohort study of women identified with cervical cancer • Clinical trial randomizing women to HPV vaccine or placebo That's correct! The case-control design provides the most efficient comparative study approach. Women of eligible ages can be recruited on the basis of cervical cancer diagnosis, and the hospital-based non–cervical cancer population provides a valid control group with the ability to match on age and other factors. Question 22 Suppose that 350 cervical cancer cases were identified and a random sample of women of the same age range who were admitted to the hospital included 500 eligible controls. After independent blood tests of all cases and controls, 90% of cases were positive for HPV antibodies while 63% of controls were positive for antibodies to the virus. What is the appropriate ratio measure of association and its value? • The ratio of HPV-exposed percentages equal to 1.4 • The ratio of nonexposed percentages equal to 4.1 • The number of exposed cases divided by the number of exposed controls equal to 1.0 • The number of nonexposed cases divided by the number of nonexposed controls equal to 0.2 • The ratio of the odds of exposure among cases and controls equal to 4.1 That's correct! Since this is a case-control study, a 2 × 2 table can quickly summarize the information given. Ninety percent of the cases were positive for HPV antibodies meaning that 315 of the cases were exposed. This leaves 45 cases as unexposed. Similarly, 63 % of the controls had a positive HPV test meaning that 315 controls were exposed while 185 controls were unexposed. Using the information from the table, the odds ratio can be easily calculated and equals the odds of exposure among the cases (315/45) divided by the odds of exposure among the controls (315/185). This ratio equals 4.1. Question 23 Suppose that one third of all cervical cancer cases were smokers as were one third of all controls and smoking status is independent of HPV infection. Is smoking a potential confounder in this study? • Yes, the overall odds ratio is still equal to 4.1 after stratification • No, the chance of being a smoker among women with cervical cancer is the same as that of being a smoker among women without cervical cancer • No, the stratum-specific odds ratios must be equal to indicate confounding • Yes, but there is not adequate information on the proportion of smokers in each exposure group to judge the effect on the odds ratio • Yes, smoking is highly correlated with HPV infection That's correct! The rate of smoking is independent of HPV infection. In order to be a potential confounder, a factor must be related to both exposure and disease. In this instance, the lack of an association between smoking and HPV infection clearly rules out any potential confounding. Question 24 A case-control study was conducted to determine if an association exists between workers in uranium mines and loss of fertility due to reduced sperm count. A group of 200 men with low sperm count were identified from clinics located in areas with uranium mines. Each selected case was matched with a randomly selected male control on the following factors: race, age, area of residence, and smoking status. What is the purpose of matching? • Previous studies have shown that there are racial differences in low sperm count • Men of the same age should have the same sperm count level • Future analyses using this data can investigate if low sperm count is associated with public drinking water supplies • Smoking has no effect on sperm count so it should be the same among cases and controls • Matching makes it easier to identify an eligible control for the study That's correct! In order to isolate the effect that uranium mining has on sperm counts, the investigators have chosen to create case and control groups with similar distributions of relevant confounders for the study. By matching, the estimated odds ratio should represent the specific contribution of uranium mine exposure to the outcome of the study. Question 25 The following numbers of matched pairs were reported: 4 matched pairs in which both men worked in a uranium mine, 9 pairs in which the case had mine exposure but the control did not, 2 pairs in which the case had no mine exposure but the control did, and 185 pairs in which neither man had worked in a uranium mine. What is the odds ratio for reduced sperm count among the uranium miners? • 4.5 • 14.4 • 28.8 • 41.1 • 46.3 That's correct! The matched odds ratio equals the number of discordant pairs in which only the case is exposed divided by the number of discordant pairs in which only the control is exposed. In this example, the matched odds ratio equals 9 divided by 2. Question 26 A case-control study of the relationship between high-fat diet and diabetes was performed. The results of the study are shown below, stratified by gender. What is the crude odds ratio for the association between high-fat diet and diabetes in this study? • 0.5 • 0.7 • 1.0 • 1.2 • 1.4 That's correct! The crude odds ratio measures the association between the exposure, high-fat diet, and the outcome, diabetes, in the entire study group. In this instance, combining the information presented for men and women gives an odds ratio of 0.7. This is equal to ratio of the odds of high-fat diet among all persons with diabetes (2390/2080) divided by the odds of a high-fat diet among all persons without diabetes (3240/2020). Question 27 A case-control study of the relationship between high-fat diet and diabetes was performed. The results of the study are shown below, stratified by gender. What is the odds ratio among men only? • 0.5 • 0.7 • 1.0 • 1.2 • 1.4 That's correct! Among men, this is equal to the ratio of the odds of high fat diet among all persons with diabetes (1410/1440) divided by the odds of a high fat diet among all persons without diabetes (2080/1120). Question 28 A case-control study of the relationship between high-fat diet and diabetes was performed. The results of the study are shown below, stratified by gender. What is the odds ratio among women only? • 0.5 • 0.7 • 1.0 • 1.2 • 1.4 That's correct! Among women, this is equal to the ratio of the odds of high-fat diet among all persons with diabetes (980/640) divided by the odds of a high fat diet among all persons without diabetes (1160/900). Question 29 A case-control study of the relationship between high-fat diet and diabetes was performed. The results of the study are shown below, stratified by gender. Based on the responses above, what is the most appropriate measure of association to present when reporting the results of this study? • The crude odds ratio • The weighted average of the stratum-specific odds ratios • The separate stratum-specific odds ratios • The odds ratio after adjustment for gender • None of the above; an incidence study should be done that better describes the relationship That's correct! Since the stratified odds ratios are different between men and women, they must be reported separately. As defined in the text, interaction is indicated when the association between exposure and disease is different in the strata formed by a third variable. In this instance, the effect of a high-fat diet decreases the risk of diabetes for men (odds ratio = 0.7) while a high-fat diet increases the risk of diabetes for women (odds ratio = 1.2). This is a classic indication of interaction between the exposure (high-fat diet) and another factor (gender) that influences disease (diabetes) risk. Question 30 A case-control study of the relationship between high-fat diet and diabetes was performed. The results of the study are shown below, stratified by gender. Which of the following is demonstrated by the stratified odds ratio shown above? • Confounding by gender • Effect modification by gender • Selection bias by gender • Recall bias by gender • Residual confounding by other factors that differ by gender such as exercise activity That's correct! The study demonstrates that effect modification is present since the stratified odds ratios are not equivalent. This implies that gender modifies the effect of a high-fat diet on the development of diabetes. By presenting the stratified odds ratios, the researcher presents this possibility when reporting the study results. Question 31 When incidence density sampling is used in a case-control study, which of the following is an important consideration? • A subject identified as a case may later be selected as a control • A subject selected as a control may later be selected as a case • Control subjects must remain disease free throughout the entire follow-up period • Each case is matched to a single control • Recall bias is not an issue since exposure is measured prospectively That's correct! An incidence density sampling strategy allows an investigator to conduct a case-control study within a defined population. The goal is to include each case subject as he or she develops the outcome during follow-up time. In some instances, control subjects who do not have the outcome can be matched to each case subject so that controls are selected at the same time as a case is identified. However, one important consideration of this strategy is that each control subject still remains at risk of being an “incident” case during follow-up time and should be included in the case group once the outcome is diagnosed. Question 32 A recent prospective study on baldness and coronary heart disease (CHD) concluded that there was no association between the two, despite earlier cross-sectional studies which showed that baldness was associated with CHD when the two were determined at the same time in men. Which Bradford-Hill criterion is being tested by the newer study? • Validity • Temporality • Biologic plausibility • Analogy • Dose-response That's correct! The prospective study investigates the development of incident CHD among men classified as bald or not bald. Therefore, exposure must temporally precede the outcome. In the earlier study, men were classified as bald or not bald at the time of their CHD diagnosis. Since CHD may have a long latency period, it may be possible that baldness developed subsequent to CHD. Therefore, only a prospective study can address this Bradford-Hill criterion. Question 33 A study examined the relation between use of estrogen replacement therapy (ERT) and ovarian cancer mortality using a prospective design. Of 24,231 eligible women, none had a prior history of cancer, hysterectomy, or ovarian surgery at enrollment in 1982. During 12 years of follow-up, 44 deaths from ovarian cancer occurred. In the published results, the authors note that 12,543 were excluded from the original cohort due to missing information for prior history variables. Which of the following is of greatest concern when interpreting the study results? • Selection bias • Information bias • Confounding • Effect modification • Precision That's correct! Since nearly one half of eligible subjects were excluded from the study, the accuracy of the measure of association between ERT and ovarian cancer mortality may be significantly biased. This bias could reduce the validity of the measure of association Question 34 A study examined the relation between use of estrogen replacement therapy (ERT) and ovarian cancer mortality using a prospective design. Of 24,231 eligible women, none had a prior history of cancer, hysterectomy, or ovarian surgery at enrollment in 1982. During 12 years of follow-up, 44 deaths from ovarian cancer occurred. In the published results, the authors note that 12,543 were excluded from the original cohort due to missing information for prior history variables. Age at menopause is a potential factor associated with use of ERT. The study investigators created three categories for age at menopause: less than 45 years, 46 through 54 years, and 55 years or more. After stratifying on age at menopause, the researchers reported relative risks of 0.97, 1.00 (referent), and 0.93 for each age group, respectively. Which of the following is true? • Age at menopause may modify the effect of ERT on ovarian cancer mortality • The odds ratios are biased toward the null due to information bias • The referent group of women who had menopause between age 46 and 54 years is incorrectly chosen • Age at menopause is unlikely to be a strong confounder of the relationship between ERT use and ovarian cancer mortality • The investigators need to analyze age as a continuous measure of years since creating categories may introduce misclassification That's correct! Age at menopause is unlikely to be a confounder of the relationship between ERT use and ovarian cancer mortality since the stratum-specific relative risks are nearly equivalent and are close to the null value of 1.0. Question 35 A case-control study was conducted to assess whether occupational radiation exposure among men was associated with Down syndrome in their children. The investigators matched cases and controls on age of the mother at childbirth by 5-year categories. Why was this done? • To minimize selection bias due to cases having older mothers • To minimize information bias about maternal age • To adjust for potential confounding by maternal age • To measure effect modification by increasing maternal age categories • To exclude children born to younger parents That's correct! Older maternal age is definitely associated with increased likelihood of Down syndrome in children. By matching on maternal age, the investigators reduce the role that maternal age has on the outcome. Question 36 A case-control study was conducted to assess whether occupational radiation exposure among men was associated with Down syndrome in their children. The investigators matched cases and controls on age of the mother at childbirth by 5-year categories. When possible, information on paternal radiation exposure was taken from employment records rather than from subject interviews. Why was this done? • To minimize detection bias for cases • To minimize differential misclassification of exposure • To remove selection bias of non–radiation exposed fathers • To provide dose-response information • To minimize recall bias of exposure That's correct! In a case-control study of a rare outcome, cases are more likely to recall exposures that they believe may have contributed to the outcome. In this instance, paternal radiation exposure may be recalled much more precisely by fathers of affected children when compared to fathers of nonaffected children. Question 37 An epidemiologist was interested in determining whether aspirin was associated with an increased risk of gastrointestinal (GI) bleeding. She relied on primary physicians to identify 600 patients at a hospital who were taking a daily dose of aspirin and 600 other patients who were not taking aspirin. Subjects were followed for 1 year to detect any occurrences of GI bleeding. Due to publicity about the risk of bleeding associated with aspirin, primary physicians treating patients at the hospital followed their patients who were taking aspirin more closely than they were unexposed subjects. Which of the following describes the impact that this may have on the epidemiologist’s study? • Would result in nondifferential classification of exposure • Would result in differential classification of exposure • Would result in nondifferential classification of outcome • Would result in differential classification of outcome • Would introduce recall bias That's correct! Since the publicity concerning aspirin use and GI bleeding informed primary physicians that patients taking aspirin may be at increased risk of this outcome, they would be more likely to diagnose GI bleeding among their patients who were exposed. This differential classification of the outcome by exposure group would lead to biased results of the epidemiologist’s study. Question 38 An epidemiologist was interested in determining whether aspirin was associated with an increased risk of gastrointestinal (GI) bleeding. She relied on primary physicians to identify 600 patients at a hospital who were taking a daily dose of aspirin and 600 other patients who were not taking aspirin. Subjects were followed for 1 year to detect any occurrences of GI bleeding. Due to publicity about the risk of bleeding associated with aspirin, primary physicians treating patients at the hospital followed their patients who were taking aspirin more closely than they were unexposed subjects. Suppose that the study was repeated with a second physician who was responsible for verifying a diagnosis of GI bleeding in the patients. This physician was informed that all patients were using aspirin. If the likelihood of diagnosing the outcome among unexposed subjects was increased while all other diagnostic probabilities remained the same, what impact would this have on the bias? • The bias would be eliminated • The bias would change the risk estimate so that the association between GI bleeding and aspirin use would be reversed • The bias would decrease toward the null • The bias would increase the risk estimate • None of the above That's correct! By increasing the likelihood of diagnosing GI bleeding in nonexposed subjects, the number of outcomes would increase in the nonexposed group. This increase would dilute the effect of the association between aspirin use and GI bleeding noted in the exposed subjects so that the risk measure would be closer to a null value of 1.0 depending on the strength of the true measure of effect. Question 39 Matching is employed in a case-control study in order to ensure that: • Variables associated with the outcome under study are controlled for in both the case and control groups • The eligible sample size is increased for case and control selection • Recall bias is minimized between cases and controls • The study investigators can estimate measures of association between matching variables and the outcome • The follow-up time for the study is decreased That's correct! Matching is done in case-control studies since a major concern is that the two groups may differ by some variable other than the exposure under investigation. By matching cases and controls on these variables that influence both exposure and outcome, the investigator seeks to control the effect of these variables by making their distributions identical in the two study groups. Question 40 The effect of exposure to high-density automobile traffic either as a bicyclist or pedestrian was compared to minimal or no exposure to automobile traffic. It is hypothesized that direct exposure to automobile traffic has an effect on acute myocardial infarction (MI). This association was studied with 500 incident cases of MI diagnosed in the emergency rooms of several hospitals and compared to 1,000 other subjects who visited the same emergency rooms for reasons other than cardiovascular and respiratory diseases. All subjects were asked to report the amount of time that they spent exposed to high-density traffic over the past month prior to their hospital visit. What type of study design is this? • Cross-sectional • Case-control • Retrospective cohort • Prospective cohort • Randomized clinical trial That's correct! The study design relies on hospital-based recruitment of cases (persons with an MI) and controls (other patients in the emergency room who did not have cardiovascular and respiratory diseases which may be associated with air pollution). The exposure under investigation is a time-dependent measure of exposure to high-density automobile traffic in the days preceding the emergency room visit. Question 41 The effect of exposure to high-density automobile traffic either as a bicyclist or pedestrian was compared to minimal or no exposure to automobile traffic. It is hypothesized that direct exposure to automobile traffic has an effect on acute myocardial infarction (MI). This association was studied with 500 incident cases of MI diagnosed in the emergency rooms of several hospitals and compared to 1,000 other subjects who visited the same emergency rooms for reasons other than cardiovascular and respiratory diseases. All subjects were asked to report the amount of time that they spent exposed to high-density traffic over the past month prior to their hospital visit. After completing the recruitment, the investigators compiled their data in the following table: Using the appropriate measure of association, as compared to the group with no traffic exposure, which of the following is a true statement concerning MI? • The estimated risk of MI is identical for those exposed to automobile traffic either daily or rarely • The estimated risk of MI was higher for those exposed rarely than for those exposed daily to automobile traffic • The estimated risk was higher for those exposed daily rather than for those exposed rarely to automobile traffic • Neither daily nor rare exposure to automobile traffic was associated with an increased risk for MI • None of the above That's correct! The estimated odds ratio for daily exposure to high-density automobile traffic is 0.5 while the estimated odds ratio for rare exposure is 1.5. It is evident that the estimated risk of MI was higher among those with rare exposure to automobile traffic. Question 42 The effect of exposure to high-density automobile traffic either as a bicyclist or pedestrian was compared to minimal or no exposure to automobile traffic. It is hypothesized that direct exposure to automobile traffic has an effect on acute myocardial infarction (MI). This association was studied with 500 incident cases of MI diagnosed in the emergency rooms of several hospitals and compared to 1,000 other subjects who visited the same emergency rooms for reasons other than cardiovascular and respiratory diseases. All subjects were asked to report the amount of time that they spent exposed to high-density traffic over the past month prior to their hospital visit. Which of the following may explain the reason for the observed association? • Effect modification by time spent exposed to automobile traffic • Confounding by time spent exposed to automobile traffic • Recall bias among those with daily exposure to automobile traffic • Selection bias to avoid automobile traffic among those predisposed to MI • Confounding by exercise level for those with daily exposure to automobile traffic That's correct! Since the investigators measured exposure to automobile traffic through direct contact either as a bicyclist or pedestrian, there is likely to be confounding by exercise level between the groups. Persons who either bike or walk daily are more likely to be fit than those who avoid these activities. Since lack of fitness is a risk factor for an acute MI, it is likely to influence the measure of association in this study. Question 43 Which of the following is an advantage of the case-control study design? • Recall bias is avoided • Little to no bias when assessing the outcome of interest • It is possible to study more than one exposure • It is possible to study more than one disease outcome • The study design is useful for studying rare exposures That's correct! Case-control studies start with a definition of those with a specific disease outcome, cases, and compare these persons to those without the outcome of interest, controls. A wide range of exposures can be included for assessment in the study groups and can be evaluated using the preferred measure of association, the odds ratio. Question 44 A large case-control study using multiple recruitment centers was conducted comparing 2,987 lung smoker cases to 3,013 other hospitalized persons selected as controls. One objective was to study the association between occupational exposure to chemicals and lung cancer. After compiling the data, the investigators noted that 90% of persons with lung cancer were smokers while 67% of the controls were smokers. The most practical and efficient way to eliminate differences between the cases and controls with regard to smoking would be to: • Repeat the selection of the controls matching on smoking status • Calculate incidence rates for lung cancer by smoking status • Exclude smokers from the study • Classify subjects according to smoking status and compare occupational chemical exposures by each stratum of smoking • Ignore smoking classification and report unadjusted risk estimates That's correct! Since smoking is highly prevalent among both groups and there is sufficient numbers of cases and controls, the most efficient method would be to report stratified risk estimates based on smoking history. Smoking is highly associated with lung cancer as well as other health endpoints and cannot be ignored. Question 45 An investigator is interested in studying the adverse effects of exposure to toxic metals on neurologic diseases such as Alzheimer’s disease. In assessing this risk, all of the following are important considerations for a prospective study design except: • The need to recruit a large sample size • The possible bias introduced by lifetime exposure assessments • The difficultly in finding sufficient numbers of persons with neurologic disease in whom past metal exposures could be measured at the beginning of the study • The likelihood that persons with exposure to toxic metals may be more likely to receive a diagnosis of neurologic disease • The possibility that exposure to toxic metals may change during the follow-up period That's correct! Since the study is being designed as a prospective cohort study, there is no need to identify persons with existing disease at the beginning of the study. If there are sufficiently large numbers of exposed and unexposed persons recruited at the start of the study, then there should be adequate numbers of events occurring during follow-up. Question 46 A history of dietary supplement with calcium was recorded among 10,000 women over the age of 50. The women were followed for 2 years to determine if they experienced hip fracture. Calcium supplementation was reported by 31% of women who experienced hip fracture and by 46% of all other women. In a case-control study with equal numbers of cases and controls, what is the number of women with a hip fracture who are not taking calcium supplements? • 1,550 • 2,300 • 2,700 • 3,450 • 5,000 That's correct! This is found by completing a 2 × 2 table for the study. For the 5,000 women who are considered cases, there are 1,550 who were exposed to calcium supplements. This leaves 3,450 who were not taking supplements (69% of the cases). Question 47 A history of dietary supplement with calcium was recorded among 10,000 women over the age of 50. The women were followed for 2 years to determine if they experienced hip fracture. Calcium supplementation was reported by 31% of women who experienced hip fracture and by 46% of all other women. What are the odds of a hip fracture among women who are taking calcium supplements? • 0.25 • 0.45 • 0.67 • 0.85 • 1.28 That's correct! The odds of the outcome among those exposed is found by dividing the number of exposed cases by the number of exposed controls. After completing a 2 × 2 table, this equals 1,550 divided by 2,300. Therefore the odds of hip fracture among those taking calcium supplements is 0.67. Question 48 A history of dietary supplement with calcium was recorded among 10,000 women over the age of 50. The women were followed for 2 years to determine if they experienced hip fracture. Calcium supplementation was reported by 31% of women who experienced hip fracture and by 46% of all other women. What is the measure of association between calcium supplementation and hip fracture? • Relative risk = 0.72 • Relative risk = 1.39 • Odds ratio = 0.53 • Odds ratio = 1.89 • None of the above That's correct! Since this is a case-control study with 5,000 cases and 5,000 controls, a 2 × 2 table is completed using the exposure probability listed above. For this study, that results in an odds ratio equal to (1550/3450) divided by (2300/2700), or 0.53. Therefore, the odds of a hip fracture in women taking calcium supplements is approximately one half that of women not taking supplements. Question 49 In a study of 100 cases of colon cancer in women, there were 200 age- and race-matched controls. The suspected etiologic factor was higher-than-average consumption of red meat. The absolute risk of colon cancer in persons with this level of consumption is: • 25% • 50% • 67% • 100% • Cannot be calculated That's correct! In a case-control study in which cases and controls are selected into the study, a measure of absolute disease risk such as incidence cannot be calculated. In order to calculate absolute risk, the investigators would need to start with a prospective cohort study in which persons are classified as exposed based on their level of meat consumption. After a suitable follow-up period, the incidence of colon cancer in each group could be used to estimate absolute risk. Question 50 Why are controls needed in a case-control study? • The may be followed for development of the outcome of interest • They are less likely to have recall bias issues • They increase the size of the study so that risk estimates are significant • They do not have the exposure of interest and allow for the estimation of disease frequency among the unexposed • They do not have the outcome of interest and allow for estimation of exposure frequency among those without the disease That's correct! A case-control study is the most convenient way to test the association between an exposure and a disease outcome. By comparing the proportions of exposure between persons with and without the disease of interest, an estimate of risk can be developed that expresses this relationship. Question 51 When is odds ratio obtained in a case-control study a reliable approximation of the relative risk for the general population? • The exposure distribution among cases is representative of all persons with disease • The exposure opportunity for controls is equivalent to the distribution of exposure opportunities for the population without the disease • When the disease under investigation is rare in the population • a and b only • All of the above That's correct! In a case-control study, the odds ratio is the measure of association most often estimated. In order for this measure to be an approximate estimate of the relative risk, all three conditions must be met. In essence, these conditions imply that both cases and controls are representative of the overall population from which they are sampled and that the rarity of disease occurrence indicates that most persons are not at increased risk for the disease. Question 52 In a published epidemiologic study investigating infertility related to sexually transmitted diseases (STD), the authors state that 5% of identified cases refused enrollment, 10% of identified cases were lost to follow-up prior to data collection, and 10% of interviewed cases had missing data for one or more key variables describing exposure. Based on this information, which of the following statements is most likely to be true? • Some degree of bias is inevitable • There is a potential for selection bias which could be differential with respect to cases and controls • There is a potential for selection bias which could be nondifferential with respect to cases and controls • There is likely to be nondifferential misclassification of the outcome • There is no selection bias; however, confounding may be introduced by missing variables That's correct! The loss of cases for all of the listed reasons indicates that the enrolled cases may not be representative of all persons with infertility under investigation. Therefore, this selection issue would introduce bias when estimating the measure of association between STD history and case status. Question 53 In a published epidemiologic study investigating infertility related to sexually transmitted diseases (STD), the authors state that 5% of identified cases refused enrollment, 10% of identified cases were lost to follow-up prior to data collection, and 10% of interviewed cases had missing data for one or more key variables describing exposure. After data were gathered for the study, the investigators decided to restrict the analysis to women only, rather than including both men and women in the study. Assuming that sex is a confounder of the exposure–disease relationship under investigation, this decision would have which of the following effects? • Increase internal validity • Increase potential confounding • Enable the study of sex as an effect modifier • Increase the likelihood of a statistically significant result • Introduce selection bias based on sex That's correct! Assuming that sex is a confounder of STD history and infertility, then restricting the analysis to women only would reduce the influence of this variable. This would increase the validity of the results of the study; however, any inferences made from the study estimate would be limited to conclusions about the exposure–disease association in women only. Question 54 In a published epidemiologic study investigating infertility related to sexually transmitted diseases (STD), the authors state that 5% of identified cases refused enrollment, 10% of identified cases were lost to follow-up prior to data collection, and 10% of interviewed cases had missing data for one or more key variables describing exposure. In the primary analysis of the study, the investigators measured exposure as a dichotomous variable (any history of STD compared to no history of STD). In subsequent analyses, the investigators looked at the relationship between specific STDs and infertility. They noted the following measures of association: for past history of gonorrhea, the odds ratio was 2.4 with a 95% confidence interval of 1.3 to 4.4. For past history of chlamydia, the odds ratio was 1.8 with a 95% confidence interval from 1.2 to 2.1. These results indicate that: • There is effect modification by STD type since the odds ratios are different from each other • There is confounding by STD type since the odds ratios are different from each other • The odds ratio for chlamydia is more precise than the odds ratio for gonorrhea • The odds ratio for chlamydia is biased toward the null • Neither odds ratio is a reliable approximation of the relative risk That's correct! When estimating measures of association, the 95% confidence interval is generally used to express the range of the measure under the null hypothesis. The interval covered by the confidence interval is smaller when sample sizes are large such that the potential values of the odds ratio relative to the null hypothesis are contained in a more limited range. In this instance, there is inadequate information to judge the correctness of the other responses such that c is the best answer. Question 55 If an investigator is analyzing the results of a clinical trial, then applying the “intention to treat” rule means that which type of bias is most likely to result? • Misclassification bias • Confounding • Effect modification • Selection bias • No bias would result That's correct! “intention to treat” indicates that the analysis of the data is conducted such that the subject’s assigned treatment group is retained when estimating the measure of association. For example, this would mean that a subject assigned to the placebo group would be categorized with this “exposure” even if he later took the drug given to the “exposed” group. This assumption has several advantages when information is limited about compliance; however, it is probable that misclassification of exposure could result when applying this rule Question 56 Investigators wanted to know if some military personnel are more error prone than others and would be a poor risk for training as a pilot. A study was done in which individuals who had injuries during basic training were compared to individuals who had not had an injury during training. Both groups were asked to recall episodes during childhood when they had had accidents that resulted in an injury. The individuals with a training injury reported more incidents during childhood when they had an injury. Therefore, the military command concluded that some persons are more likely to be error prone and that individuals with a childhood injury should be excluded from pilot training. One commanding officer disagreed with this conclusion. He asked the investigators to design a second study in which all individuals were asked about childhood injuries prior to the start of basic training. The group who reported having a childhood injury was compared to the group who had not had a childhood injury to determine which group had a higher rate of injuries during basic training. At the end of follow-up, there was no difference in the rate of injuries experienced by each group. What type of design was used for the first study? • Cross-sectional • Case-control • Retrospective cohort • Prospective cohort • Randomized clinical trial That's correct! The first study was retrospective and had two groups: those who had a training injury (“cases”) compared to those who did not have a training injury (“controls”). Exposure was assessed after case status and it is highly likely that both investigators and subjects were aware of case status since the subjects had recently finished basic training. Question 57 Investigators wanted to know if some military personnel are more error prone than others and would be a poor risk for training as a pilot. A study was done in which individuals who had injuries during basic training were compared to individuals who had not had an injury during training. Both groups were asked to recall episodes during childhood when they had had accidents that resulted in an injury. The individuals with a training injury reported more incidents during childhood when they had an injury. Therefore, the military command concluded that some persons are more likely to be error prone and that individuals with a childhood injury should be excluded from pilot training. One commanding officer disagreed with this conclusion. He asked the investigators to design a second study in which all individuals were asked about childhood injuries prior to the start of basic training. The group who reported having a childhood injury was compared to the group who had not had a childhood injury to determine which group had a higher rate of injuries during basic training. At the end of follow-up, there was no difference in the rate of injuries experienced by each group. What type of study design was used for the second study? • Cross-sectional • Case-control • Retrospective cohort • Prospective cohort • Randomized clinical trial That's correct! The second study was prospective and had two groups: those who reported childhood injury (“exposed”) compared to those who did not have a childhood injury (“nonexposed”). Outcome status was assessed after follow-up through basic training though no information is given that investigators were blinded to exposure status when determining whether or not a training-related injury occurred. Question 58 Investigators wanted to know if some military personnel are more error prone than others and would be a poor risk for training as a pilot. A study was done in which individuals who had injuries during basic training were compared to individuals who had not had an injury during training. Both groups were asked to recall episodes during childhood when they had had accidents that resulted in an injury. The individuals with a training injury reported more incidents during childhood when they had an injury. Therefore, the military command concluded that some persons are more likely to be error prone and that individuals with a childhood injury should be excluded from pilot training. One commanding officer disagreed with this conclusion. He asked the investigators to design a second study in which all individuals were asked about childhood injuries prior to the start of basic training. The group who reported having a childhood injury was compared to the group who had not had a childhood injury to determine which group had a higher rate of injuries during basic training. At the end of follow-up, there was no difference in the rate of injuries experienced by each group. Which study better tests the hypothesis that there is a relationship between childhood injury and subsequent injury during basic training? • Case-control study • Prospective cohort study • Both studies adequately test the hypothesis • Neither study adequately tests the hypothesis • A randomized trial should be performed to adequately test the hypothesis That's correct! Since the prospective study establishes a baseline categorization of exposure prior to follow-up for the outcome, this study is a better test of the hypothesis that childhood injury is related to training injury. Given that there may be significant differences in the definition and determinations of injury, it is not surprising that the second study reports no association between the two. Question 59 Investigators wanted to know if some military personnel are more error prone than others and would be a poor risk for training as a pilot. A study was done in which individuals who had injuries during basic training were compared to individuals who had not had an injury during training. Both groups were asked to recall episodes during childhood when they had had accidents that resulted in an injury. The individuals with a training injury reported more incidents during childhood when they had an injury. Therefore, the military command concluded that some persons are more likely to be error prone and that individuals with a childhood injury should be excluded from pilot training. One commanding officer disagreed with this conclusion. He asked the investigators to design a second study in which all individuals were asked about childhood injuries prior to the start of basic training. The group who reported having a childhood injury was compared to the group who had not had a childhood injury to determine which group had a higher rate of injuries during basic training. At the end of follow-up, there was no difference in the rate of injuries experienced by each group. Which of the following may explain why the two studies observed different results concerning the association between childhood injury and training injury? • Confounding by age • Effect modification by type of training • Misclassification bias toward the null in the prospective cohort study • Potential selection bias in the case-control study • Potential recall bias in the case-control study That's correct! The case-control study reports a positive association between childhood injury and training injury. Since cases were defined by having experienced a training-related injury, it is more likely that they would recall episodes of childhood injury relative to the controls due to their recent experience. Question 60 In a study of oral contraceptive (OC) use and hypertension, male interviewers for the study found a lower prevalence of OC use among participants than did female interviewers using the same questionnaire. Which term best describes this finding? • Selection bias • Differential misclassification • Nondifferential misclassification • Confounding • Effect modification That's correct! Male interviewers found a lower prevalence of exposure (OC use) among participants in the study whom they interviewed. This lower rate was not associated with case status (presence of hypertension) so the bias would be nondifferential by case group. Therefore, we can expect that cases and controls would be equally likely to be misclassified with regard to past exposure. This would bias the measure of association toward the null. Question 61 A matched case-control study of sunscreen use during childhood and melanoma results in an odds ratio of 1.0. Cases of melanoma were matched by sex and race to controls who were identified by random digit dialing. What is the most likely explanation for the study’s null finding? • Selection bias for controls • Confounding by age • Information bias concerning past sunscreen use • Lack of a true association between childhood sunscreen use and melanoma • Inadequate sample size That's correct! It is likely that persons are unable to recall childhood sunscreen use. This would decrease the proportion of exposure for both groups and lead to a bias toward the null that could mask the protective association between childhood sunscreen use and melanoma. Question 62 Among patients with liver cancer, current alcohol drinkers have a worse prognosis for survival than nondrinkers. What would be the impact on the odds ratio for a case-control study of current alcohol use and liver cancer mortality if prevalent cases were included with incident cases of the cancer? • Increase the odds ratio when prevalent cases are included • Decrease the odds ratio when prevalent cases are included • There would be no difference in the odds ratio estimated by either study • The odds ratio would be affected by differential selection bias • The odds ratio would be a better approximation of the relative risk That's correct! Prevalent cases of liver cancer would most likely change their drinking behavior following a diagnosis of liver cancer. This would reduce the odds ratio estimate since fewer cases would report being exposed, while there would be no change in the proportion of controls who reported current drinking. Question 63 In a cohort study, the reported relative risk was 2.0; however, the investigators concluded that the study likely had a bias away from the null hypothesis, but they concluded that an association did exist between the exposure and the outcome. The true relative risk is most likely: • 0.5 • 1.0 • 1.5 • 2.0 • 4.0 That's correct! Since the investigators concluded that a valid positive association existed between exposure and outcome, the true relative risk must be greater than 1.0. However, the reported relative risk was biased away from the null hypothesis meaning that it was greater than the true measure of association. This would imply that 1.5 is the best estimate for the relative risk. Question 64 In a case-control study of maternal cigarette smoking as a risk factor for low birth weight, the investigators concluded that mothers of children with low birth weight were more likely to report smoking during pregnancy relative to mothers of children with normal birth weight. The reporting error most likely caused the odds ratio to: • Increase above the true value • Decrease below the true value but remain positive • There was no change in the odds ratio from the true value • Change direction such that smoking prevented low birth weight • Equal the relative risk That's correct! Since exposure was more likely to be reported by mothers of children with low birth weight, the study is also more likely to find an association between smoking and low birth weight due to the increased likelihood of cases being classified as exposed. Question 65 In a case-control study of obesity and adult-onset asthma, controls are matched to cases on the basis of race and gender. This approach to selection is intended to decrease the influence of which type of bias? • Selection bias • Ecologic fallacy • Information bias • Misclassification • Confounding That's correct! Since race and gender are likely to be associated with both the exposure (obesity) and outcome (asthma), they could bias the estimated measure of association if not controlled for. Matching is the most efficient way to control for these potential confounders. Question 66 In a case-control study of computer display exposure and glaucoma, cases and controls were also asked about television watching habits. Errors in recall of exposure to video screens occurred with equal frequency among cases and controls. Which one of the following biases likely occurred? • Selection bias • Ecologic fallacy • Nondifferential misclassification • Differential misclassification • Confounding That's correct! Since the investigators concluded that recall errors were equally likely in cases and controls, then the bias would be nondifferential with respect to case status. Question 67 In a case-control study of computer display exposure and glaucoma, cases and controls were also asked about television watching habits. Errors in recall of exposure to video screens occurred with equal frequency among cases and controls. What is the most likely effect of this bias on the measure of association reported by the study? • Underestimated the true relationship • Overestimated the true relationship • No effect on the estimate • Cannot be determined because the bias is differential • The estimate is valid if adjusted for confounders That's correct! Nondifferential misclassification tends to result in an underestimation of the true effect. This is more commonly known as bias toward the null since any true association between exposure and outcome is diluted by the equal likelihood of incorrect exposure recall by both cases and controls. Question 68 In a case-control study of computer display exposure and glaucoma, cases and controls were also asked about television watching habits. Errors in recall of exposure to video screens occurred with equal frequency among cases and controls. Which of the following methods for adjusting for confounding by age is most likely to affect the generalizability of the study findings? • Randomization • Restriction of study subjects to those less than 50 years old • Stratification to several age groups • Matching by age plus or minus 5 years • Adjustment for age in a regression analysis That's correct! The findings of a study can be generalizable when the study is representative of the entire population at risk. By restricting the study to persons less than 50 years of age, no conclusions can be made concerning the risk for persons older than this. Since glaucoma tends to be a disease of older persons, the generalizability of the study may be reduced by this restriction. Question 69 In a cohort study of occupational exposure to a chemical and subsequent incidence of bladder cancer, all workers who smoked were more likely to die of other causes before bladder cancer was diagnosed. What was the effect of this premature mortality on the measure of association reported by the study? • Underestimated the true relationship • Overestimated the true relationship • No effect on the estimate • Cannot be determined because the bias is differential • The estimate is valid if adjusted for smoking That's correct! Since there is no indication that smoking differed by exposure status to the chemical of interest, it is likely that premature mortality reduced the number of bladder cancer cases in both exposed and nonexposed groups. Since this process is nondifferential, the study estimate would be biased toward the null and would underestimate the true relationship. Question 70 Which of the following statements about person-years is not true? • It allows for different lengths of follow-up time among study subjects • It is a valid denominator for estimates of risk for individuals • 20 persons followed for 5 years each contribute the same amount of person-years as 200 subjects followed for 6 months each • It is the amount of time that a subject was without the outcome • Person-years are not calculated for time during a study when outcome status is not known for subjects lost to follow-up That's correct! Person-years are a useful way to measure the rate at which events occur in a group of persons followed for different periods. However, the risk in any person-year may not be the same for different individuals. This may be true when evaluating persons for a disease with a long latency period such as cancer. A study that includes 5,000 persons for 2 years may not have an equivalent underlying risk as a study of 1,000 persons followed for 10 years. Chapters 16-20 Question 1 A large company institutes a new wellness program aimed at improving the health of its 50,000 employees. As a part of the program, all employees are given physical examinations and screening tests. One of the tests given to male employees is the prostate specific antigen (PSA) test with all employees testing positive being referred to their private physician for a thorough examination involving the standard test, a digital rectal examination (DRE). What will happen to the apparent incidence rate of prostate cancer in the company during the first year of this program? • Incidence rate will stay the same • Incidence rate will increase • Incidence rate will decrease • Incidence rate will equal the general population rate • Not enough information is available That's correct! Given that prostate cancer is one of the most common cancers of men, it is highly prevalent but often undiagnosed. Any effort to intensify screening for prostate cancer will increase the number of cases found in a local population. Question 2 A large company institutes a new wellness program aimed at improving the health of its 50,000 employees. As a part of the program, all employees are given physical examinations and screening tests. One of the tests given to male employees is the prostate specific antigen (PSA) test with all employees testing positive being referred to their private physician for a thorough examination involving the standard test, a digital rectal examination (DRE). On referral to their private physician, approximately 30% of men with a positive PSA are found to be negative for prostate cancer following the DRE. What is the sensitivity of the PSA test if DRE is assumed to be the gold standard? • 30% • 70% • 0.3 times the sensitivity of DRE • 0.7 times the sensitivity of DRE • Cannot be calculated due to missing information That's correct! Since only men with a positive PSA test are sent for the DRE, those who test negative on the PSA are not available for further testing to determine the number of false negatives from the PSA screening. The lack of this information means that the sensitivity of the test cannot be calculated. Question 3 The following table shows data describing age-standardized incidence rates for cervical and breast cancer among Irish women living in Ireland, Irish immigrants to the United States, and daughters of Irish immigrants in the United States. The rates are reported for two age categories: adult women younger than 40 years of age and older than 40 years of age. Which cancer appears to be determined primarily by environmental factors? • Cervical • Breast • Both • Neither • Cannot be determined due to confounding by area of residence That's correct! Cervical cancer is one of the most common cancers of women. The most important risk factor is infection with human papillomavirus (HPV). Since the incidence rates for the cancer varies for each group in both age categories, this cancer is determined primarily by environmental factors. Question 4 The following table shows data describing age-standardized incidence rates for cervical and breast cancer among Irish women living in Ireland, Irish immigrants to the United States, and daughters of Irish immigrants in the United States. The rates are reported for two age categories: adult women less than 40 years of age and greater than 40 years of age. Which cancer appears to be determined primarily by genetic factors? • Cervical • Breast • Both • Neither • Cannot be determined due to confounding by age That's correct! Both cancers are very common in women. Though a proportion of breast cancer is attributable to genetic factors especially in women less than 40 years of age, the incidence rates reported here show that it is not very different between subgroups of the Irish female population. Both environmental and genetic factors contribute to breast cancer incidence with age-related risk factors. Question 5 The following table shows data describing age-standardized incidence rates for cervical and breast cancer among Irish women living in Ireland, Irish immigrants to the United States, and daughters of Irish immigrants in the United States. The rates are reported for two age categories: adult women less than 40 years of age and greater than 40 years of age. Among women less than 40 years of age, what is the relative risk for cervical cancer comparing daughters of Irish immigrants to women in Ireland? • 1.50 • 1.55 • 1.64 • 2.70 • Cannot be calculated with the information provided That's correct! The relative risk is equal to the incidence rate in daughters of Irish immigrants divided by the incidence rate for women in Ireland. In this data, the relative risk equals 10.2 divided by 6.8. Question 6 The following table shows data describing age-standardized incidence rates for cervical and breast cancer among Irish women living in Ireland, Irish immigrants to the United States, and daughters of Irish immigrants in the United States. The rates are reported for two age categories: adult women less than 40 years of age and greater than 40 years of age. What is the proportion of cervical cancer risk in Irish women under 40 years of age that is attributable to moving to the United States? • 12% • 24% • 56% • 100% • Cannot be calculated with the information provided That's correct! This question asks for the percent attributable risk which is equal to the incidence in the “exposed” group (Irish immigrants to the United States) less the incidence in the “nonexposed” group (Irish women in Ireland) divided by the incidence in the nonexposed group. This calculation represents the proportion of cervical cancer risk that can be attributed to the risk factor of immigration to the United States. Question 7 The following table shows data describing age-standardized incidence rates for cervical and breast cancer among Irish women living in Ireland, Irish immigrants to the United States, and daughters of Irish immigrants in the United States. The rates are reported for two age categories: adult women less than 40 years of age and greater than 40 years of age. Which cancer has a greater risk after the onset of menopause? • Cervical • Breast • Both • Neither • Cannot be calculated with the information provided That's correct! The relative risks for cervical cancer among older women (> 40 years) compared to younger women are approximately 1.2 for each subgroup. The relative risks for breast cancer for this comparison are approximately 1.9. Therefore, the risk of breast cancer is more substantial with the onset of menopause as denoted by increasing age. Question 8 The data in the table below are from a case-control study of a genetic factor associated with neurologic disease. Cases are newly diagnosed persons with the rare neurologic condition, and population controls were used for comparison. Investigators have hypothesized that a single point mutation in a gene on the 10th chromosome is strongly related to the disease. In the table, subjects who are homozygous for the mutation are denoted as m/m; subjects with only one mutated gene (heterozygous for the mutation) are denoted as A/m; and subjects with two normal alleles (homozygous for the absence of the mutation) are denoted as A/A. The unexposed category for the study is the A/A genotype. The neurologic condition is thought to be autosomal dominant with respect to the gene; therefore, one copy of the m allele should induce the development of the condition. What is the odds ratio for subjects with at least one copy of the mutant allele? • 0.01 • 0.5 • 1.0 • 75.4 • Cannot be calculated due to zero controls in one cell That's correct! The odds ratio should be calculated after combining all persons with at least one copy of the mutation. This results in 376 exposed cases, 48 exposed controls, 40 nonexposed cases, and 385 nonexposed controls. The odds ratio equals (376 divided by 48) divided by (48 divided by 385). This calculation equals 75.4. Question 9 The data in the table below are from a case-control study of a genetic factor associated with neurologic disease. Cases are newly diagnosed persons with the rare neurologic condition, and population controls were used for comparison. Investigators have hypothesized that a single point mutation in a gene on the 10th chromosome is strongly related to the disease. In the table, subjects who are homozygous for the mutation are denoted as m/m; subjects with only one mutated gene (heterozygous for the mutation) are denoted as A/m; and subjects with two normal alleles (homozygous for the absence of the mutation) are denoted as A/A. The unexposed category for the study is the A/A genotype. The neurologic condition is thought to be autosomal dominant with respect to the gene; therefore, one copy of the m allele should induce the development of the condition. Using the odds ratio calculated above, what is the population attributable risk percent for the mutation? • 0% • 75% • 89% • 99% • Cannot be calculated due to nonestimable odds ratio That's correct! To estimate this percentage, one must use Levin’s formula with the odds ratio representing risk and the proportion of the mutation in controls representing the proportion of population with the exposure. In these data, the controls are representative of the population frequency of at least one m allele. The proportion having at least one m allele is 0.11 (48 divided by 433). When this proportion is placed in Levin’s formula using the odds ratio of 75.4 as the risk, then the calculation is (0.11 multiplied by 74.4) divided by ((0.11 multiplied by 74.4) plus 1). This gives the answer as 0.89, or 89%. Question 10 The data in the table below are from a case-control study of a genetic factor associated with neurologic disease. Cases are newly diagnosed persons with the rare neurologic condition, and population controls were used for comparison. Investigators have hypothesized that a single point mutation in a gene on the 10th chromosome is strongly related to the disease. In the table, subjects who are homozygous for the mutation are denoted as m/m; subjects with only one mutated gene (heterozygous for the mutation) are denoted as A/m; and subjects with two normal alleles (homozygous for the absence of the mutation) are denoted as A/A. The unexposed category for the study is the A/A genotype. The neurologic condition is thought to be autosomal dominant with respect to the gene; therefore, one copy of the m allele should induce the development of the condition. Does this study confirm the hypothesis that the condition is caused by an autosomal dominant mutation? Why or why not? • Yes, the strength of association is very large • Yes, all homozygous persons for the mutation are cases • No, the odds of disease among heterozygotes is 0.46 • No, the investigators have not done a prospective study • No, some of the cases are homozygous for the normal allele That's correct! If the mutation were autosomal dominant, then we would expect all persons with the m mutation to have the neurologic disease. Since this is not evidenced by the data, then the hypothesis cannot be accepted. Question 11 The basis for the healthy worker effect is that: • Having a job makes people healthier and less susceptible to disease • Employment status is correlated with health status • Persons who work are less likely to be exposed to harmful agents • Persons who work have health insurance and receive better treatment • Studies of persons who work are confounded by socioeconomic status That's correct! The ability to obtain and keep a job depends upon some level of good health. Since persons who are in the workforce are more likely to have better health status, studies which compare worker populations to the general population typically find that workers have fewer adverse health outcomes than the general population. This leads to a self-selection bias in that persons who are selected into employment are more likely to be in good health Question 12 Epidemiologists were interested in investigating the relationship between exercise and development of coronary heart disease (CHD) among women. Women ages 45 to 55 years were interviewed to determine their exercise habits at entry into the study. They were then followed for 15 years to determine the incidence of CHD in the cohort. What proportion of women who developed CHD had exercised once per week? Answer: 60 That's correct! The best answer is 60%. 67 cases of CHD occurred during the 15-year follow-up period. 40 of the cases (60%) developed in women who exercised once per week Question 13 Epidemiologists were interested in investigating the relationship between exercise and development of coronary heart disease (CHD) among women. Women ages 45 to 55 years were interviewed to determine their exercise habits at entry into the study. They were then followed for 15 years to determine the incidence of CHD in the cohort. Complete the table by calculating the incidence rates per 10,000 person-years and the rate ratios. Answer: Rates per 10,000 person-years is 7.00, 3.42, 1.59 Rate ratios is referent, 0.49, 0.23 That's correct! Rates per 10,000 person-years: 7.00, 3.41, 1.59 by increasing exercise frequency. Rate Ratios: Referent, 0.49, 0.23 by increasing exercise frequency. To calculate the rates per 10,000 person-years, divide the number of incident CHD cases by the total person-years exposed and multiply by 10,000 to standardize the rates. For example, among women who reported no exercise, 23 cases divided by 32,843 person-years gives a rate of 0.0007 events per person-year. After multiplying by 10,000, the rate equals 7.00 events per 10,000 person-years. To estimate the rate ratio, one group must be designated the referent group. All estimated ratios are relative to this group’s rate. In this study, the nonexposed group was comprised of women who reported no exercise at baseline. The rate ratio comparing the group exercising once per week to this referent category equals 3.41 divided by 7.00, or 0.49. Question 14 Epidemiologists were interested in investigating the relationship between exercise and development of coronary heart disease (CHD) among women. Women ages 45 to 55 years were interviewed to determine their exercise habits at entry into the study. They were then followed for 15 years to determine the incidence of CHD in the cohort. The investigators concluded that these data demonstrate a causal relationship between exercise and subsequent CHD. Which of the Hill criteria best applies to this data? • Biologic plausibility • Consistency • Specificity • Dose-response • Temporality That's correct! The rate ratio is a measure of relative risk for these three groups. It has a suggestive pattern that increasing exercise is correlated with less CHD. Question 15 Epidemiologists were interested in investigating the relationship between exercise and development of coronary heart disease (CHD) among women. Women ages 45 to 55 years were interviewed to determine their exercise habits at entry into the study. They were then followed for 15 years to determine the incidence of CHD in the cohort. Other epidemiologists disagreed that this was a causal finding. What error do they claim that the study investigators made when interpreting the study findings? • There is significant confounding by age • The data are not generalizable to the total population • Exposure is likely to be misclassified during the follow-up period • There is selection bias introduced by not randomizing the study participants to an exercise frequency • CHD is a heterogenous disease that manifests differently in each case That's correct! Though cohort studies have definite advantages for providing evidence for causal relationships between exposure and disease, one disadvantage of studies with long follow-up is the reliance on baseline exposure measures. Without further determination that women maintained their reported exercise frequency during the entire 15-year study, it is likely that there is information bias due to misclassification of exposure. Question 16 A cross-sectional study finds that persons younger than 70 years of age have a higher prevalence of pneumonia than those older than age 70. Which of the following is the best explanation for this observation? • Persons younger than 70 have a higher incidence of pneumonia • Persons younger than 70 have a higher case-fatality rate for pneumonia • Persons younger than 70 are more likely to have complete follow-up in pneumonia studies • Incidence rates may be equal in both age categories; however, persons older than 70 have a shorter duration of pneumonia compared to those younger than 70 • Persons younger than 70 are more likely to be exposed to pneumonia That's correct! Since the study is cross-sectional, all cases of disease are prevalent cases at the time of data collection. It is likely that the higher prevalence in the younger age group is due to either higher incidence or longer duration. In this instance, the second explanation is more compatible with the observation since pneumonia has a greater adverse effect on mortality among older persons Question 17 Meat consumption may be a risk factor for colon cancer. This hypothesis was investigated by collecting data on the amount of red meat consumed in regions of the United States and the colon cancer rates in those areas. The data are shown below: From this data, the researchers concluded that there is a significant dose-response association between red meat consumption and incident colon cancer. This observation may be incorrect because: • No statistical test is presented to support the significance claim • The data are not age-adjusted • There may be confounding by preparation methods • The meat consumption habits of persons with colon cancer are not reported • The observation is correct That's correct! This cross-sectional study measures the average amount of red meat consumption in a population and attempts to correlate it with the incident rate for colon cancer. No data are presented that describe the individual red meat consumption levels for individuals with and without colon cancer. The study suffers from the problem of assigning group level measures to individuals. This error is known as the ecologic fallacy. Question 18 Meat consumption may be a risk factor for colon cancer. This hypothesis was investigated by collecting data on the amount of red meat consumed in regions of the United States and the colon cancer rates in those areas. The data are shown below: • Case-control study • Retrospective cohort study • Prospective cohort study • All of the above • None of the above That's correct! Each of the study designs can be adapted to test the association between red meat exposure and colon cancer using a variety of data collection strategies. The key issue is the determination of individual measures of red meat consumption as well as potential confounders. Pairing this data with valid ascertainment of incident colon cancer cases is essential to conducting an etiologic study. Question 19 Which of the following are characteristics of a disease that are important for the conduct of an effective screening program? More than one answer may be correct. • High prevalence of the disease • The disease has a severe effect on health • Clear clinical symptoms associated with the disease • Treatment reduces the duration of the disease • There is a long latency period following biologic onset That's correct! Question 20 Which factor can increase the positive predictive value (PPV) estimated for a screening program? • High sensitivity for the screening test used in the program • Selection of a screening population at high risk for the disease • Reduction of the negative predictive value (NPV) by removing false negative cases • Generalizability of the screening test • The disease is rare in the population That's correct! The PPV is the number of true positive cases of the disease among all persons identified by a screening test as having a disease. This value increases when there is a high level of risk for the disease in the population, thereby increasing the likelihood that a positively identified case truly has the disease. Question 21 When evaluating disease screening programs, what is a potential bias of the measure of their effectiveness when compared to symptom-based diagnostic approaches? • Confounding by age • Selection bias among persons who undergo screening tests • Recall bias by persons who undergo screening • Lead-time bias due to early detection of incurable disease • Ecologic fallacy That's correct! Sometimes screening programs can be effective at discovering more cases of a disease even though there is no adequate treatment program. This would serve to raise the incidence and prevalence of the disease; however, the effectiveness of this is reduced if mortality measures are not improved. This can occur when the disease has no effective treatment such that the screening program has no impact on the disease-specific mortality rate. Question 22 What is the epidemiologic transition? • Change from nonexposed to exposed status during a prospective study • Development of the study disease during follow-up • Reversal of the risk estimate after adjustment for a strong confounder • Reduction in proportion of deaths due to infectious diseases in the first part of the 20th century • Generalizability of study findings to the population That's correct! The epidemiologic transition is used to describe the period from 1860 through 1950 in which many scientific breakthroughs contributed to the substantial reduction of mortality caused by infectious diseases. Epidemiology was one of many sciences that contributed to the reduction in death and the increase in life expectancy due to the prevention of many infectious diseases. Ironically, it also served to increase the prevalence of chronic diseases such as cardiovascular disease and cancer due to the survival of many more persons to older ages. Question 23 For a cross-sectional study to be a valid test of a hypothesis, which of the following must be true? • Exposure is constant over time • Underlying risk of disease is constant over time • When a disease has no latency period and clinical symptoms manifest immediately after biologic onset • Individual exposure measures have the same distribution as group measures • The results of the study are externally valid (generalizable) That's correct! Cross-sectional studies typically collect information on exposure and disease at the same point in time. This approach is convenient for testing associations between exposure and disease, but it is inadequate for many types of etiologic research since temporality is a key assumption. When exposure is constant over time for individuals, or, better stated, it is fixed (e.g., blood type, specific gene, sex), then the cross-sectional study can be used to test an etiologic hypothesis since exposure is measured for a characteristic that has always been present for each individual in the study. Question 24 Which of the following measures is best suited to the evaluation of a screening program over time? • Incidence rate • Relative risk • Cause-specific mortality rate • Survival probability • Case-fatality rate That's correct! The cause-specific mortality rate is a measure of the rate of death among persons with a specific disease. An effective screening program aims to identify persons with disease at earlier stages such that treatment can be given for the disease. Over time, the best measure of a screening program is its impact on the cause-specific mortality rate as reductions in this rate can be attributed to the benefits of treatment at earlier stages of a disease. Question 25 After a hospital in a major city adds a high-risk pregnancy and neonatal intensive care unit (NICU), the rate of adverse childbirth outcomes doubles. Administrators are concerned that this indicates that the new unit is ineffectively run. Which of the following is a reason that this concern may be unfounded? • Incidence of congenital birth defects has been increasing • Childbirth procedures and personnel are still the same as before the addition • The type of population served by the new unit has changed • Many of the new mothers attending the unit are older at first birth • None of the above That's correct! In this instance, the addition of the new unit specializing in high-risk pregnancies most likely led to a selection bias. By expanding its services, the hospital increased the number of pregnancies and childbirths considered high risk, some of which could not be treated and resulted in adverse outcomes. Question 26 In a study of immigrants to a new country, the rate of cardiovascular disease (CVD) in migrants is equivalent to the rate of CVD in their home country. This rate is lower than the rate for first generation family members and for their country of adoption. Which of the following could explain this observation? • Migrants vary in age distribution and the rate of CVD needs to be age-adjusted to reflect this • Healthier persons tend to immigrate leading to selection bias • Migrants tend to maintain similar lifestyles to their country of origin • The disease is rare in the country of origin • Migration tends to occur after the biologic onset of CVD That's correct! Since the rate of CVD is similar between migrants and persons in their country of origin, this would suggest that there is a strong genetic component; however, this hypothesis is not adequate since first generation family members in the country of adoption have a different rate of CVD. Therefore, the most likely explanation is that migrants tend to retain cultural and other characteristics that are common to their country of origin such as diet, exercise habits, and other CVD risk factors. Question 27 A large cohort study of 1,000 adult pairs of twins was conducted. Seventy-two pairs of twins were concordant for the disease under investigation, and 94 pairs of twins were discordant for the disease. In the remaining twin pairs, neither adult had the disease. What is the concordance rate for this disease among all twin pairs with at least one affected member? • 7% • 17% • 25% • 43% • Cannot be determined That's correct! The concordance rate equals the number of twin pairs in which both members have the disease divided by the total number of pairs affected by the disease. This equals 72 pairs in which both twins have the disease divided by (72 + 94) pairs in which at least one member has the disease. This equals 0.43, or 43%. Question 28 A large cohort study of 1,000 adult pairs of twins was conducted. 72 pairs of twins were concordant for the disease under investigation while 94 pairs of twins were discordant for the disease. In the remaining twin pairs, neither adult had the disease. From this observation, what is the most likely interpretation? • Genetic factors are a major determinant of the disease • Environmental factors are a major determinant of the disease • Both types of factors are responsible for the disease • Neither type of factor is • Cannot be determined from these data That's correct! Since information is not given regarding zygosity, i.e., whether the twins are identical or fraternal, the high rate of concordance is not easily interpreted. Twins typically share both genetic and environmental factors, especially for early life exposures. In the absence of specific information concerning the disease and the types of twin pairs, it is not possible to determine the type of causative agent for this disease. Question 29 Within a large manufacturing company, the division responsible for the production of agricultural chemicals has an annual rate of lung cancer equal to 17.3 cases per 100,000 persons. The rate of lung cancer for the rest of the company not exposed to agricultural chemical production is 13.6 cases per 100,000 persons. What inference can be made concerning the association of agricultural chemical production and lung cancer within this company? • The association is real • The association is confounded by differences in age distribution • The association is not real since prevalence is not measured • The association is not real due to confounding by other risk factors for lung cancer • The association is not real due to selection bias That's correct! The main risk factor for lung cancer is cigarette smoking. Without relevant information on the distribution of smoking by type of division within the company, the increase in lung cancer in the agricultural chemical production division may not be real. Question 30 For an etiologic factor to be judged to be causally related to a disease, which of the following must be true? • The etiologic factor is equally distributed throughout the population • The etiologic factor is found among all cases of the disease • Exposure to the etiologic factor must precede the onset of the disease • Persons exposed to the etiologic factor have a higher prevalence of disease • The results of an epidemiologic study of the factor must be externally valid That's correct! Of all criteria which are used to evaluate causality, temporality is the only essential factor for an etiologic relationship. Exposure to the etiologic factor must precede the onset of disease in all cases for the relationship to be causal. Epidemiology relies on the comparative distribution of disease in populations who are exposed and nonexposed to a suspected etiologic agent. Among these groups, only a proportion of persons develop the disease of interest. By making relative comparisons, epidemiologists study the risk of disease; however, causality requires a higher level of proof starting with temporality in the etiologic relationship. [Show More]
Last updated: 1 year ago
Preview 1 out of 118 pages
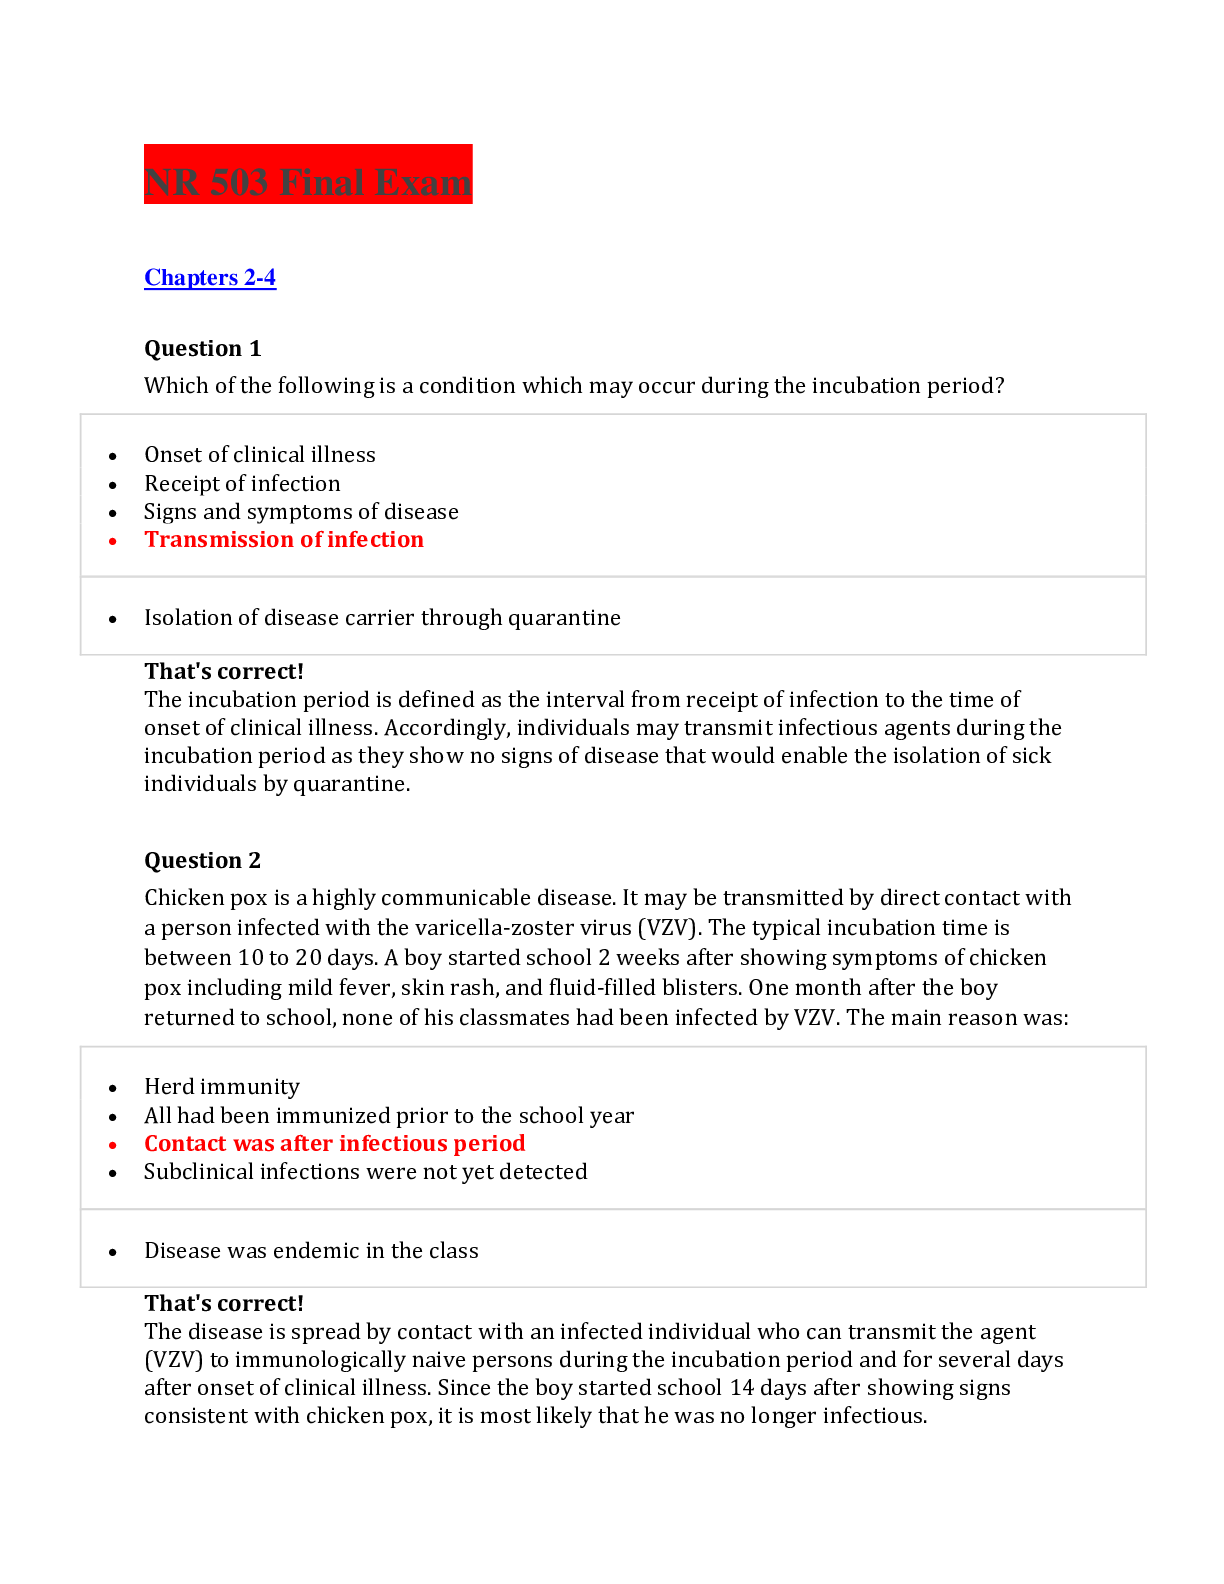
Reviews( 0 )
Document information
Connected school, study & course
About the document
Uploaded On
Nov 06, 2020
Number of pages
118
Written in

Additional information
This document has been written for:
Uploaded
Nov 06, 2020
Downloads
0
Views
59