Questions and Answers > Arizona State University AST 113 ASTRONOMY Lab 3
Document Content and Description Below
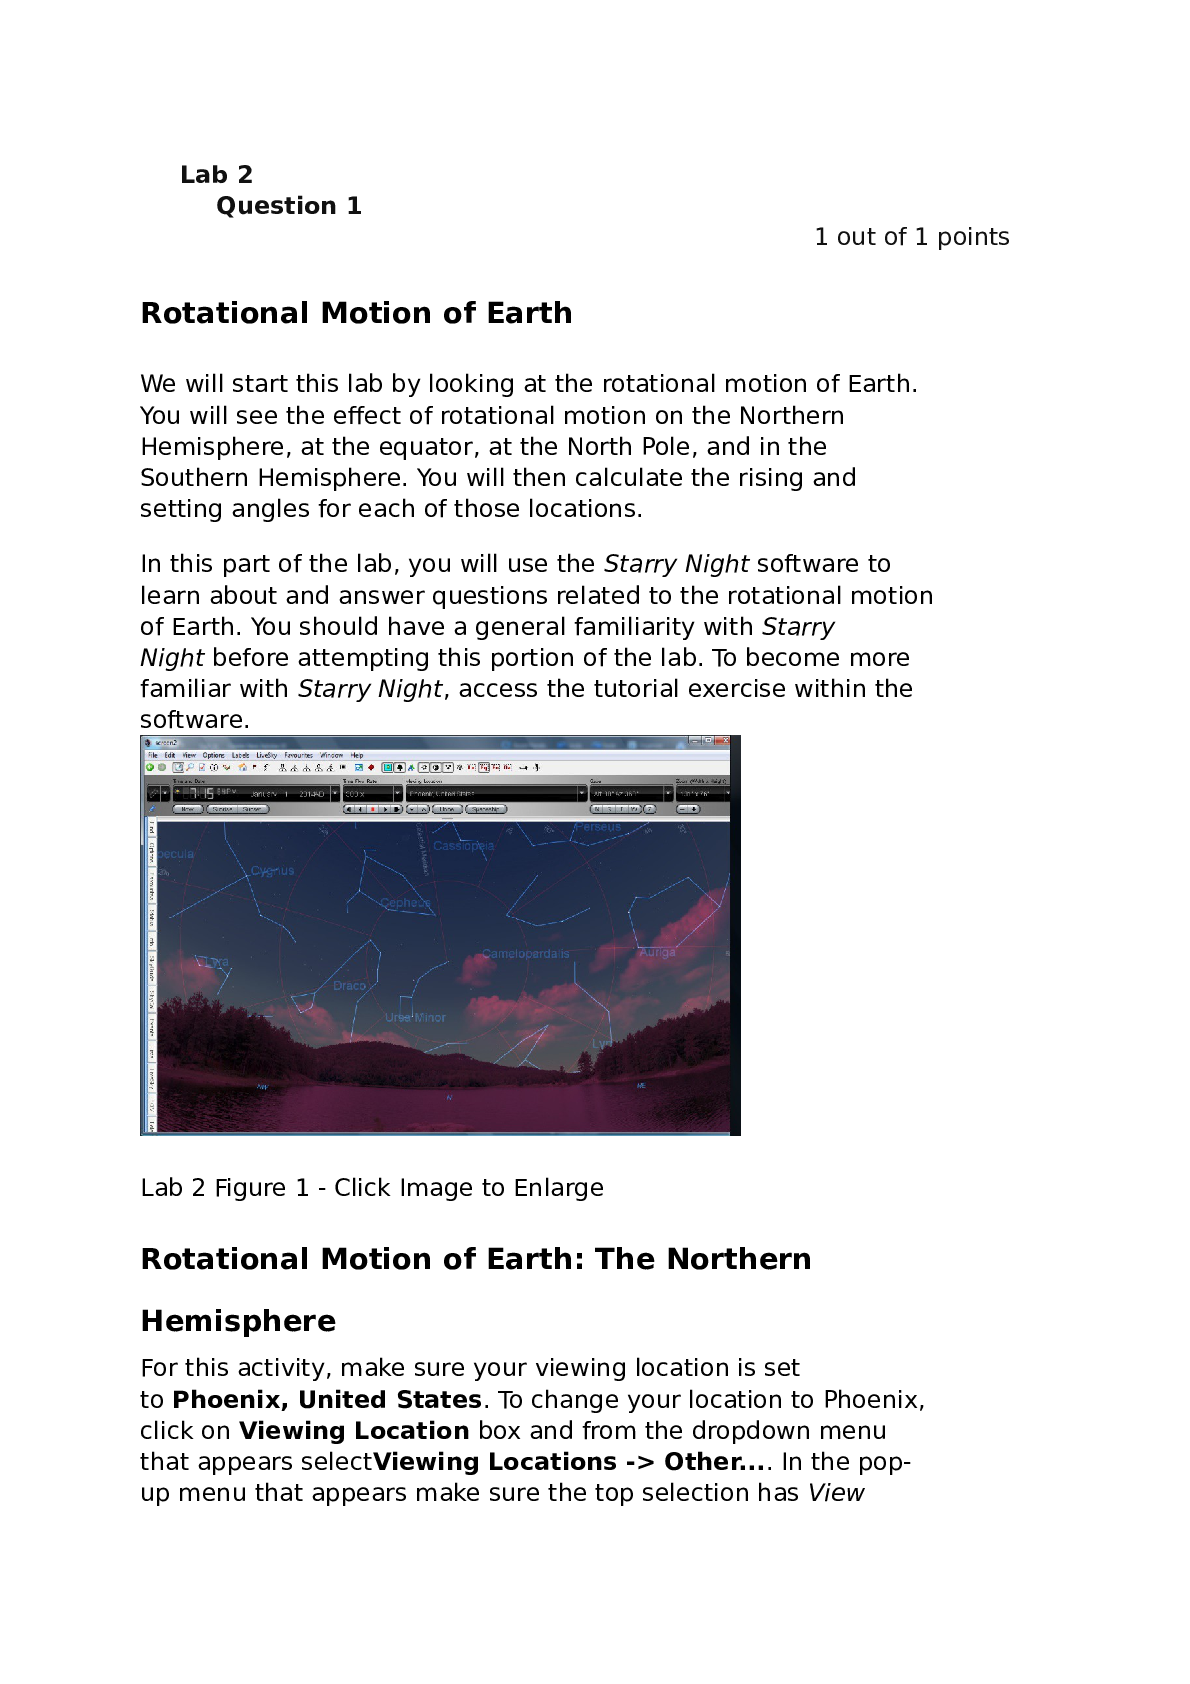
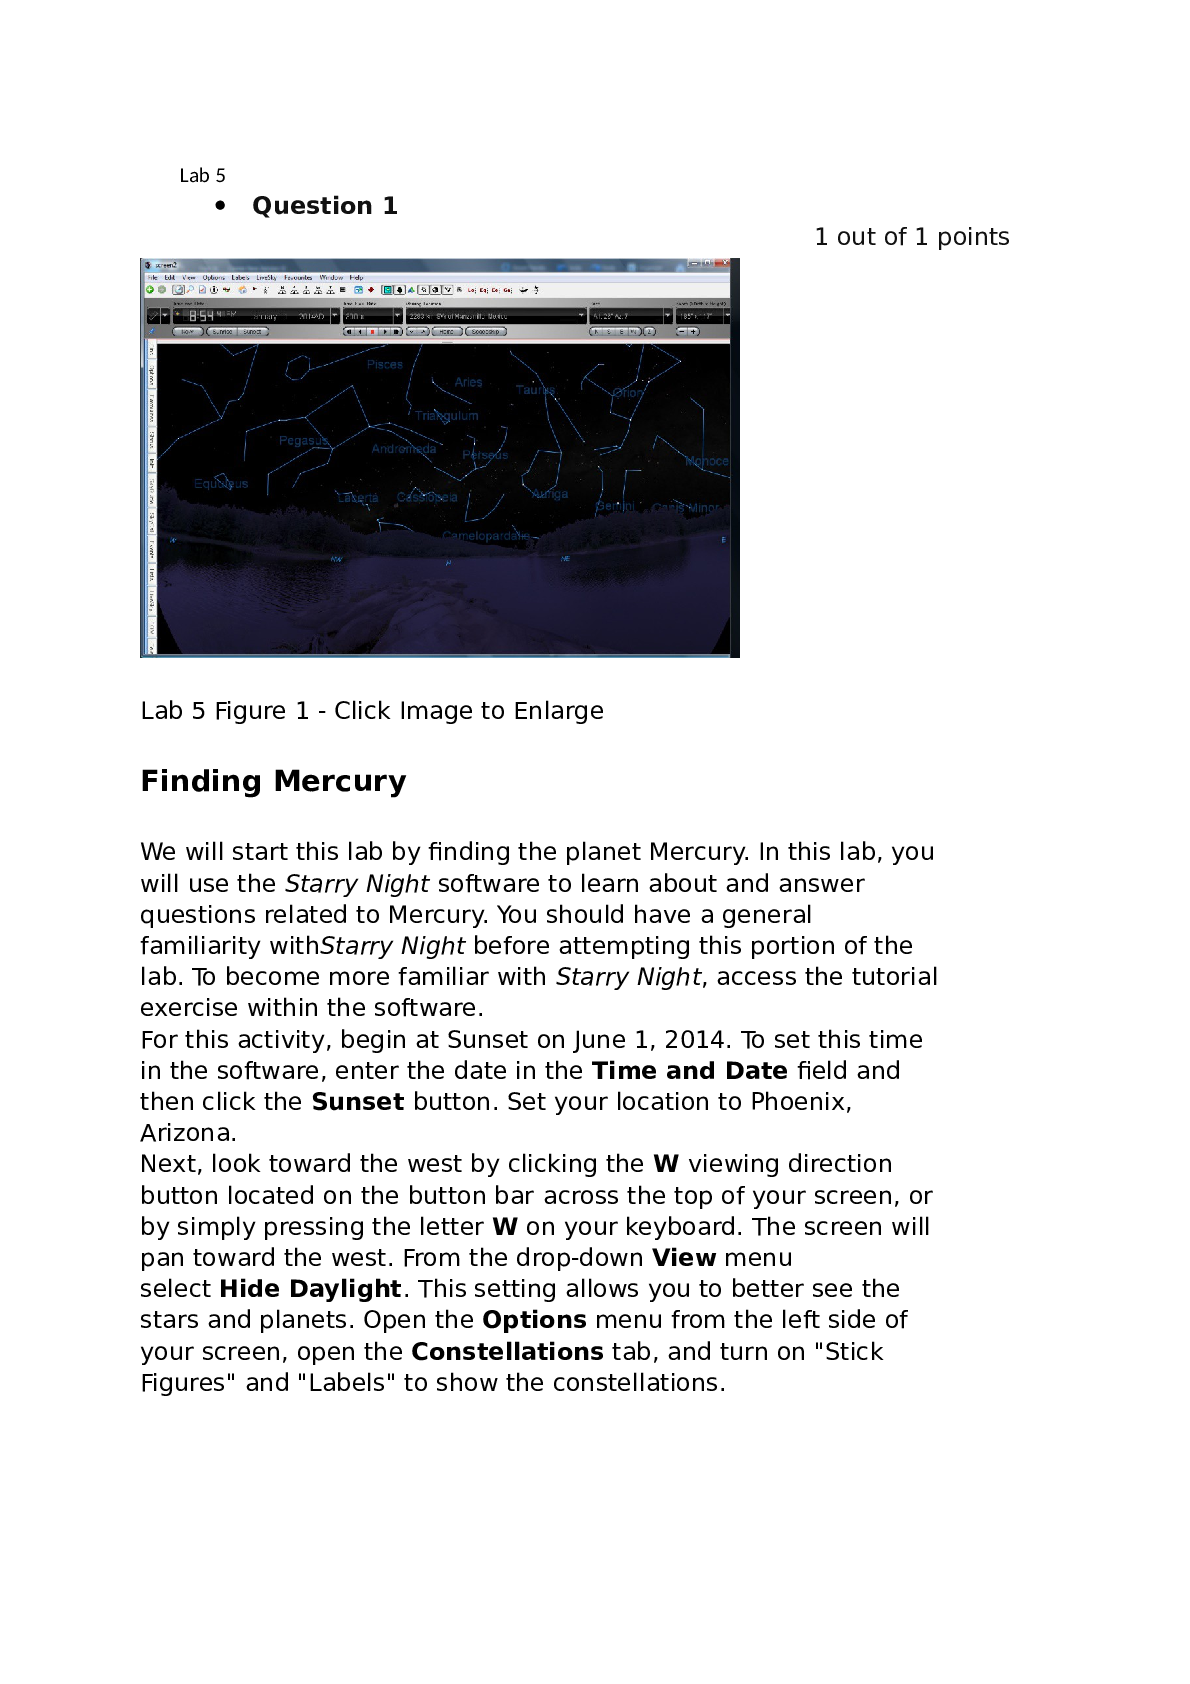
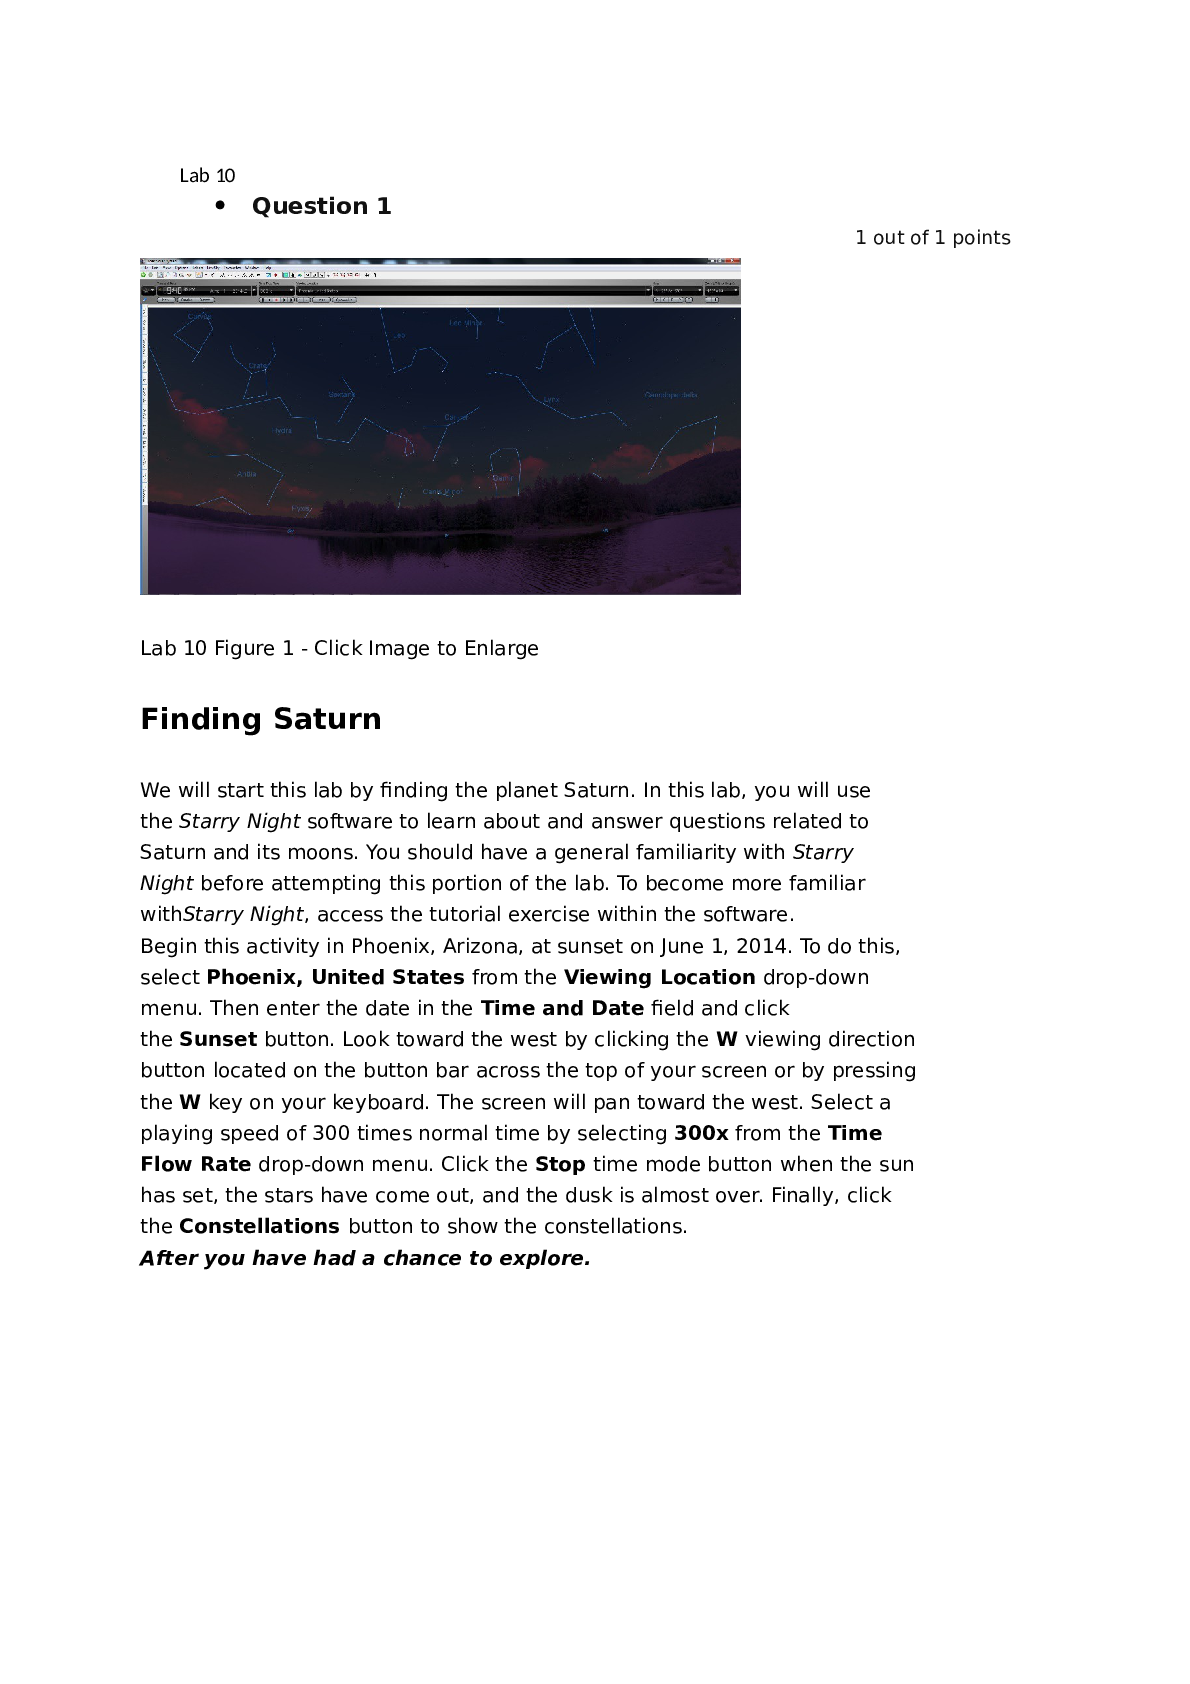
Arizona State University AST 113 ASTRONOMY Lab 3 Lab 3 Question 1 1 out of 1 points Lab 3 Figure 1 Path of the Sun Let's start by examining the path of the Sun. Figure 1 shows the... sky as seen from the continental United States. It shows that the Sun's daily path across the sky (dashed/solid line) is longest on June 21 and shortest on December 21. In addition, on June 21, which is called the summer solstice, the Sun reaches its maximum height in the southern sky above the horizon at about noon. The figure shows that the Sun never actually reaches the zenith for any observer in the continental United States. In other words, the Sun is never directly overhead. Over the six months following the summer solstice, the height of the Sun at noon moves progressively lower and lower until December 21, the winter solstice. Thus, we see that the path of the Sun through the southern sky changes considerably over the course of a year. Refer to Figure 1 when answering these Questions. According to Figure 1, in which direction would you look to see the Sun when it reaches its highest position in the sky today? Question 2 1 out of 1 points If it is currently winter (just after the winter solstice), how does the height of the Sun at noon change over the next several months? Question 3 1 out of 1 points In the continental United States, when is the sun directly overhead at the zenith at noon? Question 4 1 out of 1 points During what time of year would the Sun rise north of east? Question 5 1 out of 1 pointsDuring what time of year would the Sun rise south of east? Question 6 1 out of 1 points On what dates does the Sun rise directly in the east? Question 7 1 out of 1 points Which of the following statements best describes the location of the setting Sun in the Northern Hemisphere? Question 8 1 out of 1 points Lab 3 Figure 2Path of the Sun: Shadow Plots Figure 2 shows a small, vertical stick, which casts a shadow while it rests on a large piece of paper or poster board. You can think of this setup to be something like a sundial. For two different days of the year, the end of the shadow has been marked with an x every couple of hours throughout the day. Although this sketch is somewhat exaggerated, these shadow plots indicate how the position of the Sun changes in the sky through the course of these two days. The following Questions are designed to show the relationship between Figure 1 and Figure 2. Refer to Figure 2 when answering these Questions. How does the direction of the stick’s shadow compare to the location of the Sun at the time each x was drawn? Question 9 1 out of 1 points In which direction would the shadow of the stick be cast on the poster board if the Sun rises in the Southeast? Question 10 1 out of 1 points Which shadow plot was made in summer? Which was made in winter? (Hint, look at the length of the shadows at noon.) Question 11 1 out of 1 points Approximately how much time did it take to create each of the shadow plots? Question 12 1 out of 1 points Approximately how much time went by from the time one of the x’s was drawn until the next x was drawn? Question 13 1 out of 1 points Which shadow plot would have taken longer to create? Question 14 1 out of 1 points Lab 3 Figure 3 Seasons: Earth-Sun Distance This section of the lab discusses seasons and the Earth's distance from the Sun during each season. The following table shows the distances, in kilometers (km), between the Sun and Earth for four months of the year. Month Earth–Sun DistanceDecember 147.2 million km June 152.0 million km September 150.2 million km March 149.0 million km Figure 3 shows four different locations of Earth during its orbit around the Sun. Note that for each location drawn, Earth is correctly shown with its rotational axis tilted at an angle of 23.5°. Use Figure 3 and the Earth–Sun distance table to answer these Questions. The direction in which Earth’s axis is tilted changes as Earth orbits the Sun. Question 15 1 out of 1 points During which season (in the Northern Hemisphere) is Earth closest to the Sun? Question 16 1 out of 1 points During which season (in the Northern Hemisphere) is Earth farthest from the Sun? Question 17 1 out of 1 points The temperature stays approximately the same every month of the year at your location. Question 18 1 out of 1 points During summer in the Northern Hemisphere, what season is it in the Southern Hemisphere? Question 19 1 out of 1 points At different times of year, locations in the Northern Hemisphere can be a few thousand kilometers closer to or farther from the Sun than locations at the same latitude in the Southern Hemisphere. These differences in distance are the cause of the seasons. Question 20 Use Figure 4 to answer these Questions. Which of the two lighted areas would appear brighter? Question 21 1 out of 1 points Which of the two lighted areas is bigger? Question 22 1 out of 1 points Which of the two lighted areas receives more direct light (amount of energy on each unit of area) from the spotlight? Question 23 1 out of 1 points If a thermometer were placed in each of the lighted areas, which one would read the higher temperature? Question 24 1 out of 1 points Which area bears a closer resemblance to the way that sunlight shines on the Southern Hemisphere of Earth during its winter? Spotlight B Question 25 Lab 3 Figure 5 Amount of Daylight Consider Figure 5, which shows three different regions of Earth (the Northern Hemisphere, the Southern Hemisphere, and the equatorial region) at two different times of the year, six months apart. Refer to Figure 5 to answer Questions 1 and 2. Which location corresponds with summer in the Northern Hemisphere? Question 26 1 out of 1 points Which location corresponds with winter in the Southern Hemisphere? Question 27 1 out of 1 points During which season is the number of daylight hours thegreatest? Question 28 1 out of 1 points During summer, how many hours of daylight occur per day? Question 29 1 out of 1 points During which season is the Sun highest in the sky at noon? Question 30 1 out of 1 points Which of the following provides the best explanation for temperatures being higher in the summer? B Question 31 1 out of 1 points Which of the following most accurately describes the effect it would have on seasons if somehow the number of daylight hours did not change throughout the year but Earth was still tilted at 23.5°? Question 32 1 out of 1 points If the Northern Hemisphere were tilted 90° toward the sun, which location would be warmest in the summer? [Show More]
Last updated: 1 year ago
Preview 1 out of 13 pages
.png)
.png)
Reviews( 0 )
Document information
Connected school, study & course
About the document
Uploaded On
Aug 08, 2022
Number of pages
13
Written in

Additional information
This document has been written for:
Uploaded
Aug 08, 2022
Downloads
0
Views
67