Statistics > EXAM > California Polytechnic State University_Biostatistics Team Project 2 _Questions and Worked Solution (All)
California Polytechnic State University_Biostatistics Team Project 2 _Questions and Worked Solutions.
Document Content and Description Below
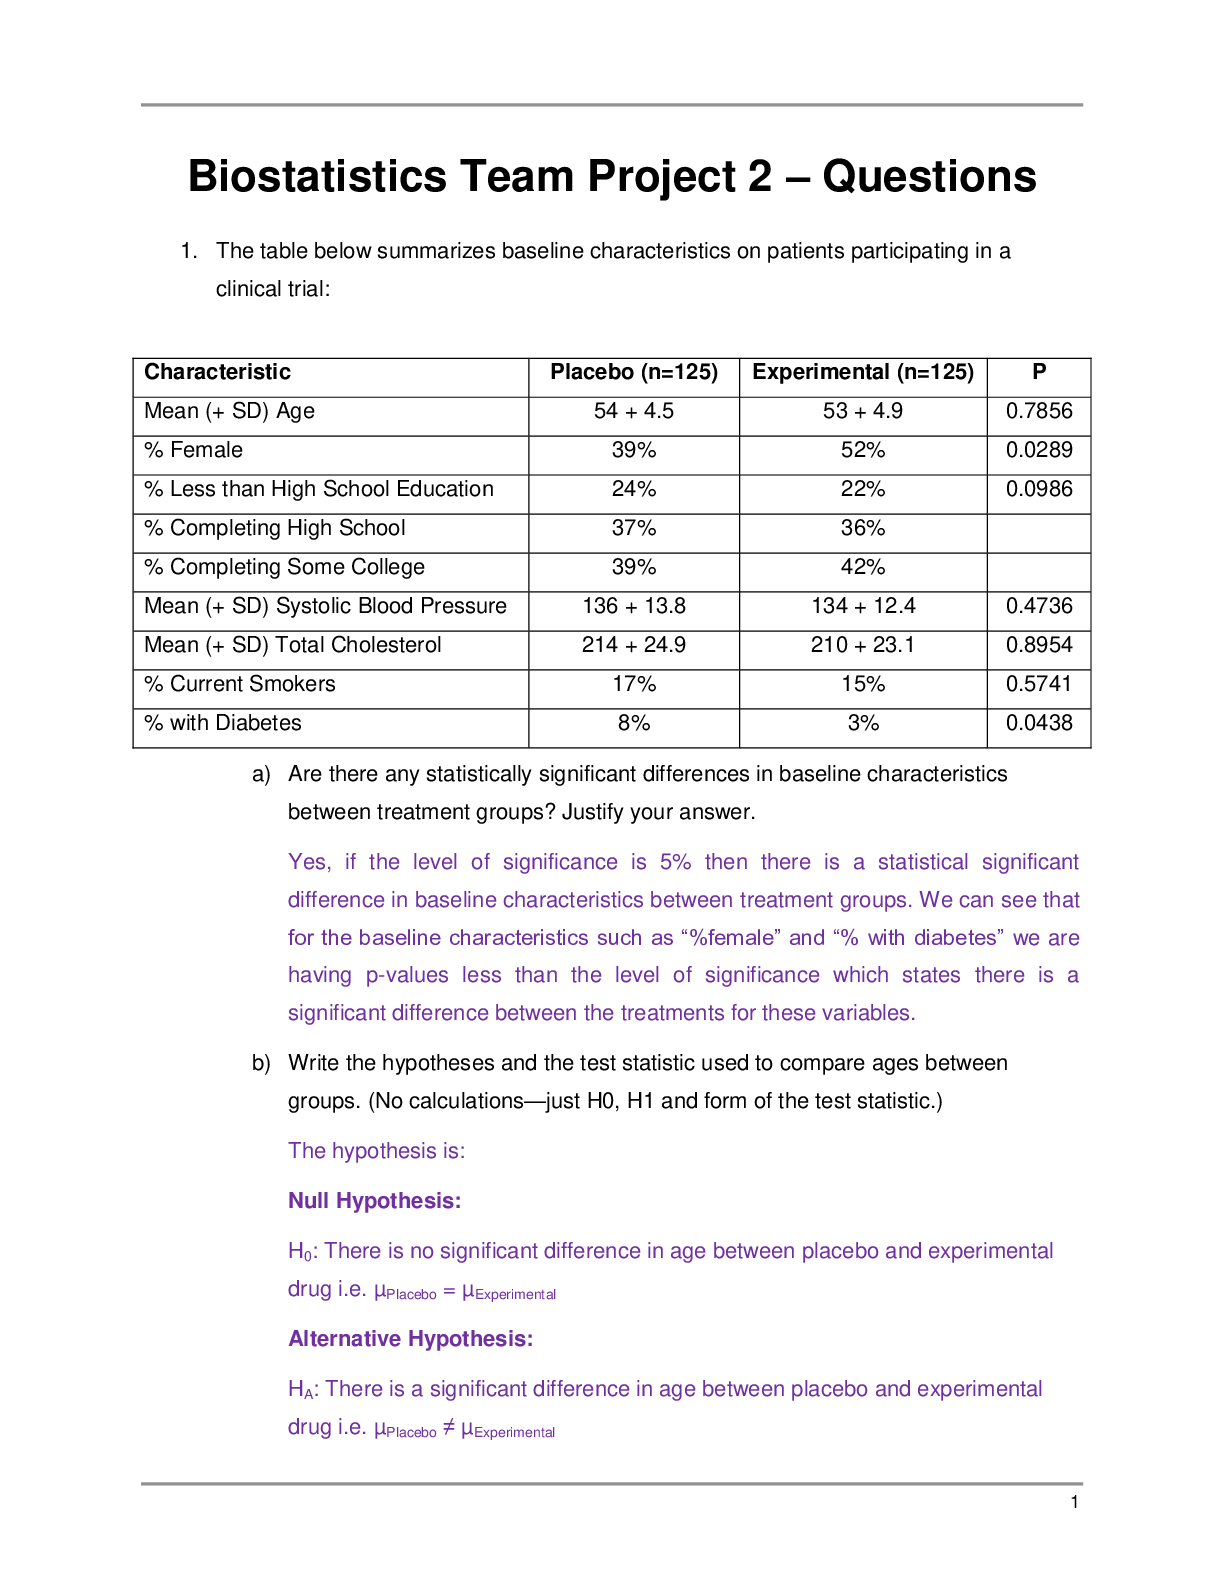
Biostatistics Team Project 2 ‒ Questions 1. The table below summarizes baseline characteristics on patients participating in a clinical trial: Characteristic Placebo (n=125) Experimental (n=125)... P Mean (+ SD) Age 54 + 4.5 53 + 4.9 0.7856 % Female 39% 52% 0.0289 % Less than High School Education 24% 22% 0.0986 % Completing High School 37% 36% % Completing Some College 39% 42% Mean (+ SD) Systolic Blood Pressure 136 + 13.8 134 + 12.4 0.4736 Mean (+ SD) Total Cholesterol 214 + 24.9 210 + 23.1 0.8954 % Current Smokers 17% 15% 0.5741 % with Diabetes 8% 3% 0.0438 a) Are there any statistically significant differences in baseline characteristics between treatment groups? Justify your answer. b) Write the hypotheses and the test statistic used to compare ages between groups. (No calculations—just H0, H1 and form of the test statistic.) c) Write the hypotheses and the test statistic used to compare percent of females between groups. (No calculations—just H0, H1 and form of the test statistic.) d) Write the hypotheses and the test statistic used to compare educational levels between groups. (No calculations—just H0, H1 and form of the test statistic.) 2. The following data were collected in a clinical trial to compare a new drug to a placebo for its effectiveness in lowering total serum cholesterol. Generate a 95 percent confidence interval for the difference in mean total cholesterol levels between treatments. New Drug (n=75) Placebo (n=75) Total Sample (n=150) Mean (SD) Total Serum Cholesterol 185.0 (24.5) 204.3 (21.8) 194.7 (23.2) Percent of Patients with Total Cholesterol < 200 78.0% 65.0% 71.5% 3. A clinical trial is run to evaluate the effectiveness of a new drug to prevent preterm delivery. A total of n=250 pregnant women agree to participate and are randomly assigned to receive either the new drug or a placebo and followed through the course of pregnancy. Among 125 women receiving the new drug, 24 deliver preterm and among 125 women receiving the placebo, 38 deliver preterm. Construct a 95 percent confidence interval for the difference in proportions of women who deliver preterm. 4. The mean BMI in patients free of diabetes was reported as 28.2. The investigator conducting the study described in Problem 1 hypothesizes that the BMI in patients free of diabetes is higher. Based on the data in Problem 1 is there evidence that the BMI is significantly higher than 28.2? Use a 5 percent level of significance. 5. Consider again the study described in the problem below, taken from the Chapter 6 quiz: Peak expiratory flow (PEF) is a measure of a patient’s ability to expel air from the lungs. Patients with asthma or other respiratory conditions often have restricted PEF. The mean PEF for children free of asthma is 306. An investigator wants to test whether children with chronic bronchitis have restricted PEF. A sample of 40 children with chronic bronchitis is studied and their mean PEF is 279 with a standard deviation of 71. Is there statistical evidence of a lower mean PEF in children with chronic bronchitis? Run the appropriate test at =0.05. 6. A different investigator conducts a second study to investigate whether there is a difference in mean PEF in children with chronic bronchitis as compared to those without. Data on PEF are collected and summarized below. Based on the data, is there statistical evidence of a lower mean PEF in children with chronic bronchitis as compared to those without? Run the appropriate test at =0.05. Group Number of Children Mean PEF Std Dev PEF Chronic Bronchitis 25 281 68 No Chronic Bronchitis 25 319 74 7. A clinical trial is run to compare the effectiveness of an experimental drug in reducing preterm delivery to a drug considered standard care and to placebo. Pregnant women are enrolled and randomly assigned to receive the experimental drug, the standard drug, or placebo. Women are followed through delivery and classified as delivering preterm (< 37 weeks) or not. The resulting data are shown below. Preterm Delivery Experimental Drug Standard Drug Placebo Yes 17 23 35 No 83 77 65 Is there a statistically significant difference in the proportions of women delivering preterm among the three treatment groups? Run the test at a 5 percent level of significance. Chi-square Contingency Table Test for Independence Experimental Drug Standard Drug Placebo Total Yes Observed 17 23 35 75 (O - E)² / E 2.56 0.16 4.00 6.72 No Observed 83 77 65 225 (O - E)² / E 0.85 0.05 1.33 2.24 Total Observed 100 100 100 300 (O - E)² / E 3.41 0.21 5.33 8.96 8. Consider the data presented in Problem 6. Previous studies have shown that approximately 32 percent of women deliver prematurely without treatment. Is the proportion of women delivering prematurely significantly higher in the placebo group? Run the test at a 5 percent level of significance. 9. A study is run comparing HDL cholesterol levels between men who exercise regularly and those who do not. The data are shown below. Regular Exercise N Mean Std Dev Yes 35 48.5 12.5 No 120 56.9 11.9 Generate a 95 percent confidence interval for the difference in mean HDL levels between men who exercise regularly and those who do not. 10. A clinical trial is run to assess the effects of different forms of regular exercise on HDL levels in persons between the ages of 18 and 29. Participants in the study are randomly assigned to one of three exercise groups: weight training, aerobic exercise, or stretching/yoga, and instructed to follow the program for 8 weeks. Their HDL levels are measured after 8 weeks and are summarized below. Exercise Group N Mean Std Dev Weight Training 20 49.7 10.2 Aerobic Exercise 20 43.1 11.1 Stretching/Yoga 20 57.0 12.5 Is there a significant difference in mean HDL levels among the exercise groups? Run the test at a 5 percent level of significance. Hint: SSerror = 7286.5. 11. The following data were collected in a clinical trial to compare a new drug to a placebo for its effectiveness in lowering total serum cholesterol. New Drug (n=75) Placebo (n=75) Total Sample (n=150) Mean (SD) Total Serum Cholesterol 185.0 (24.5) 204.3 (21.8) 194.7 (23.2) % Pati.ents with Total Cholesterol < 200 78.0% 65.0% 71.5% In Problem 2 of this project, you generated a 95 percent confidence interval for the difference in mean total cholesterol levels between treatments. Now, using this same data: a) Generate a 95 percent confidence interval for the proportion of all patients with total cholesterol < 200. b) How many patients would be required to ensure that a 95 percent confidence interval has a margin of error not exceeding 5 percent? 12. “Average adult Americans are about one inch taller, but nearly a whopping 25 pounds heavier than they were in 1960, according to a new report from the Centers for Disease Control and Prevention (CDC). The bad news, says CDC, is that average BMI (body mass index, a weight-for-height formula used to measure obesity) has increased among adults from approximately 25 in 1960 to 28 in 2002.” Boston is considered one of America’s healthiest cities. Is the weight gain since 1960 similar in Boston? A sample of n=25 adults suggested a mean increase of 17 pounds with a standard deviation of 8.6 pounds. Is Boston statistically significantly different in terms of weight gain since 1960? Run the appropriate test at a 5 percent level of significance. 13. In 2007, the CDC reported that approximately 6.6 per 1000 (0.66%) children were affected with autism spectrum disorder. A sample of 900 children from Boston was tested and 7 were diagnosed with autism spectrum disorder. Is the proportion of children affected with autism spectrum disorder higher in Boston as compared to the national estimate? Run the appropriate test at a 5 percent level of significance. 14. Consider again the data from Problem 9: Exercise Group N Mean Std Dev Weight Training 20 49.7 10.2 Aerobic Exercise 20 43.1 11.1 Stretching/Yoga 20 57.0 12.5 Suppose that in the aerobic exercise group we also measured the number of hours of aerobic exercise per week, and the mean is 5.2 hours with a standard deviation of 2.1 hours. The sample correlation is -0.42. Estimate the equation of the regression line that best describes the relationship between number of hours of exercise per week and HDL cholesterol level. (Assume that the dependent variable is HDL level.) a) Estimate the HDL level for a person who exercises 7 hours per week. b) Estimate the HDL level for a person who does not exercise. A person who does not exercise means he/she is sending zero hours on exercise. Therefore, HDL level for a person who does not exercise is 15. A clinical trial is being planned to investigate the effect of a new experimental drug designed to reduce total serum cholesterol. Investigators will enroll participants with total cholesterol levels between 200‒240, they will be randomized to receive the new drug or a placebo and followed for 2 months, and the total cholesterol will be measured. Investigators plan to run a test of hypothesis and want 80 percent power to detect a difference of 10 points in mean total cholesterol levels between groups. They assume that 10 percent of the participants randomized will be lost over the 2 month follow-up. How many participants must be enrolled in the study? Assume that the standard deviation of total cholesterol is 18.5. Consider again the randomized controlled trial described in Problem 14. Suppose that there are 63 boys assigned to the new drug group and 58 boys assigned to the placebo. Is there a statistically significant difference in the proportions of boys assigned to the treatments? Run the appropriate test at a 5 percent level of significance. 16. An observational study is conducted to investigate the association between age and total serum cholesterol. The correlation is estimated at r = 0.35. The study involves n=125 participants and the mean (std dev) age is 44.3 (10.0) years with an age range of 35 to 55 years, and mean (std dev) total cholesterol is 202.8 (38.4). a) Estimate the equation of the line that best describes the association between age (as the independent variable) and total serum cholesterol. b) Estimate the total serum cholesterol for a 50-year-old person. c) Estimate the total serum cholesterol for a 70-year-old person. 17. The following table was presented in an article summarizing a study to compare a new drug to a standard drug and to a placebo. Characteristic* New Drug Standard Drug Placebo p Age, years 45.2 (4.8) 44.9 (5.1) 42.8 (4.3) 0.5746 % Female 51% 55% 57% 0.1635 Annual Income, $000s 59.5 (14.3) 63.8 (16.9) 58.2 (13.6) 0.4635 % with Insurance 87% 65% 82% 0.0352 Disease Stage 0.0261 Stage I 35% 18% 33% Stage II 42% 37% 47% Stage III 23% 51% 20% *Table entries and Mean (SD) or %. a) Are there any statistically significant differences in the characteristics shown among the treatments? Justify your answer. b) Consider the test for differences in age among treatments. Write the hypotheses and the formula of the test statistic used (no computations required—formula only). c) Consider the test for differences in insurance coverage among treatments. Write the hypotheses and the formula of the test statistic used (no computations required—formula only). d) Consider the test for differences in disease stage among treatments. Write the hypotheses and the formula of the test statistic used (no computations required—formula only). 18. A small pilot study is run to compare a new drug for chronic pain to one that is currently available. Participants are randomly assigned to receive either the new drug or the currently available drug, and report improvement in pain on a 5-point ordinal scale: 1=Pain is much worse, 2=Pain is slightly worse, 3= No change, 4=Pain improved slightly, 5=Pain much improved. Is there a significant difference in self-reported improvement in pain? Use the Mann-Whitney U test with a 5 percent level of significance. New Drug: 4 5 3 3 4 2 Standard Drug: 2 3 4 1 2 3 No. Label Data Rank 1 New Drug: 4 10 10 2 New Drug: 5 12 10+12 3 New Drug: 3 6.5 10+12+6.5 4 New Drug: 3 6.5 10+12+6.5+6.5 5 New Drug: 4 10 10+12+6.5+6.5+10 6 New Drug: 2 3 10+12+6.5+6.5+10+3 R1=48 7 Standard Drug: 2 3 3 8 Standard Drug: 3 6.5 3+6.5 9 Standard Drug: 4 10 3+6.5+10 10 Standard Drug: 1 1 3+6.5+10+1 11 Standard Drug: 2 3 3+6.5+10+1+3 12 Standard Drug: 3 6.5 3+6.5+10+1+3+6.5 R2=30 19. For each question below, provide a brief (1‒2 sentences) response. a) How is the slope coefficient (b1) in a simple linear regression different from the coefficient (b1) in a multiple linear regression model? b) When would a survival analysis model be used instead of a logistic regression model? c) What is the appropriate statistical test to assess whether there is an association between obesity status (normal weight, overweight, obese) and 5-year incident cardiovascular disease (CVD)? Suppose each participant’s obesity status (category) is known, as is whether they develop CVD over the next 5 years or not. 20. An observational study is conducted to compare experiences of men and women between the ages of 50‒59 years, following coronary artery bypass surgery. Participants undergo the surgery and are followed until the time of death, until they are lost to follow-up, or up to 30 years, whichever comes first. The following table details the experiences of participating men and women. The data below are years of death or years of last contact for men and women. a) Estimate the survival functions for each treatment group using the Kaplan-Meier approach. b) Test whether there is a significant difference in survival between treatment groups using the log rank test and a 5 percent level of significance. [Show More]
Last updated: 1 year ago
Preview 1 out of 23 pages
Instant download
Buy this document to get the full access instantly
Instant Download Access after purchase
Add to cartInstant download
Reviews( 0 )
Document information
Connected school, study & course
About the document
Uploaded On
Jan 12, 2021
Number of pages
23
Written in

Additional information
This document has been written for:
Uploaded
Jan 12, 2021
Downloads
1
Views
79