Pump Performance
Document Content and Description Below
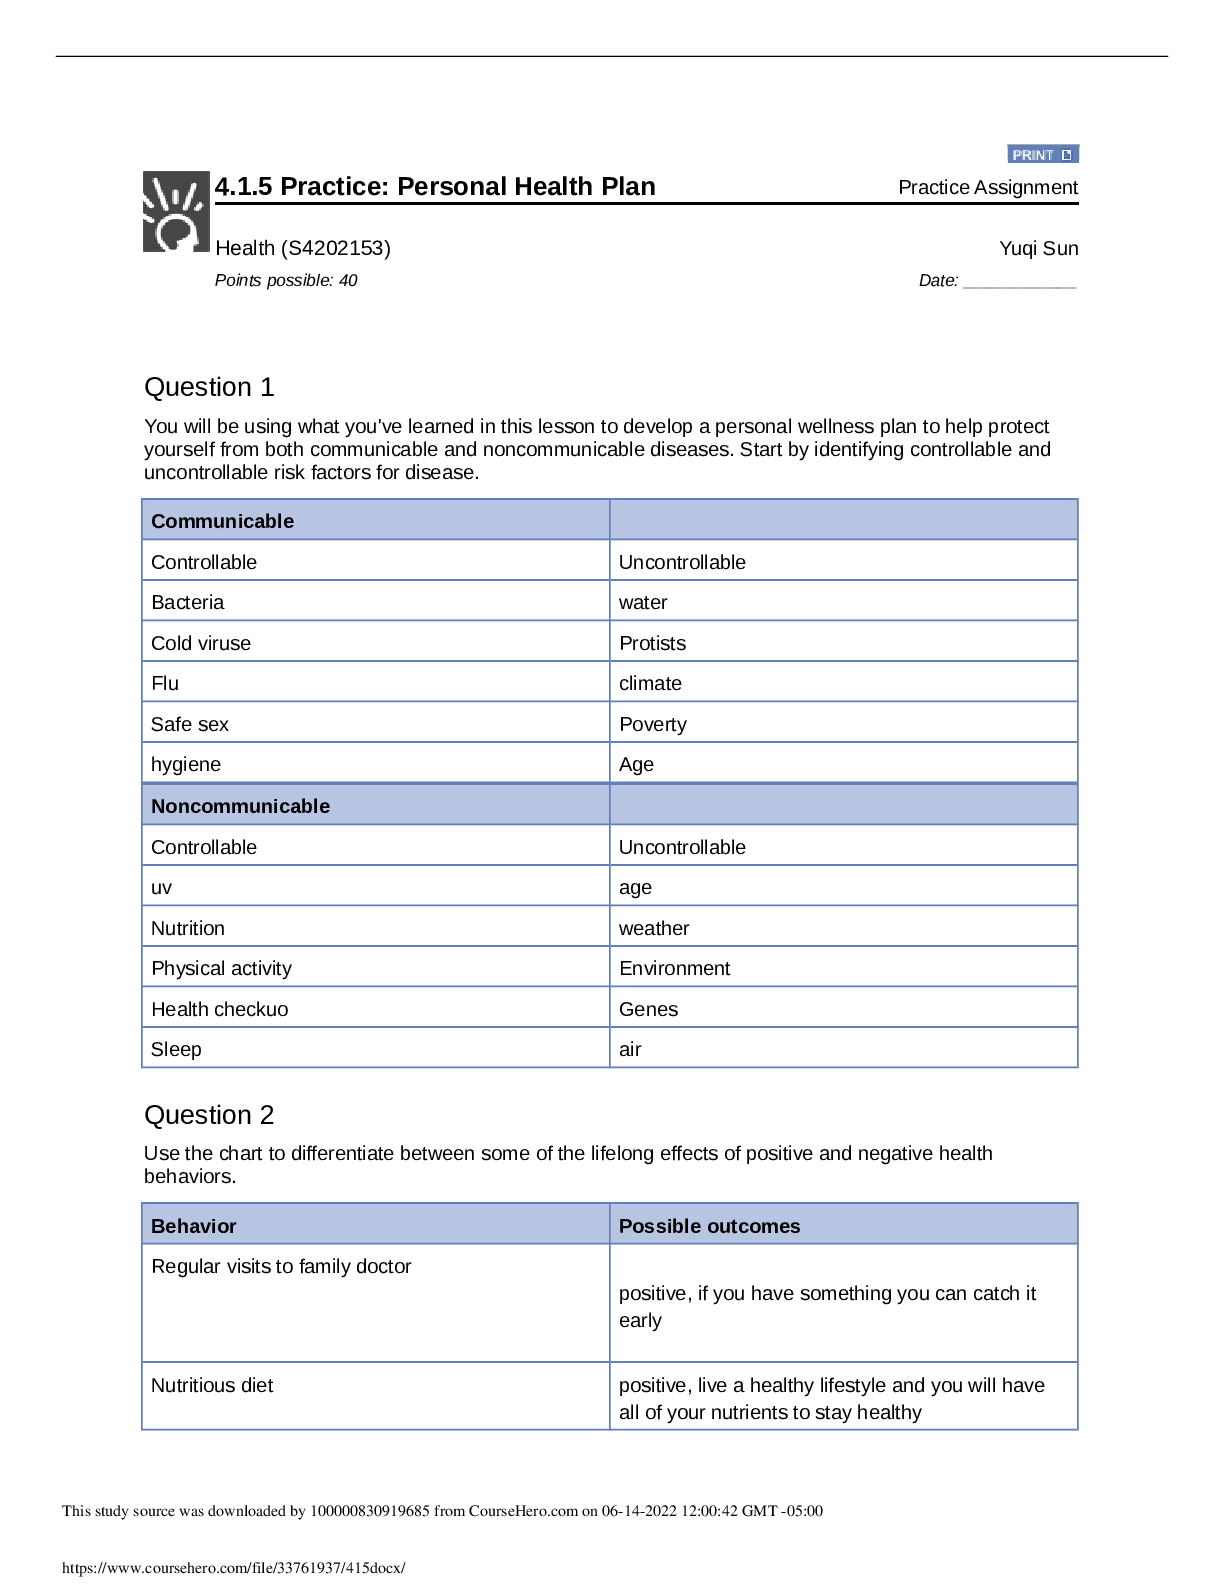
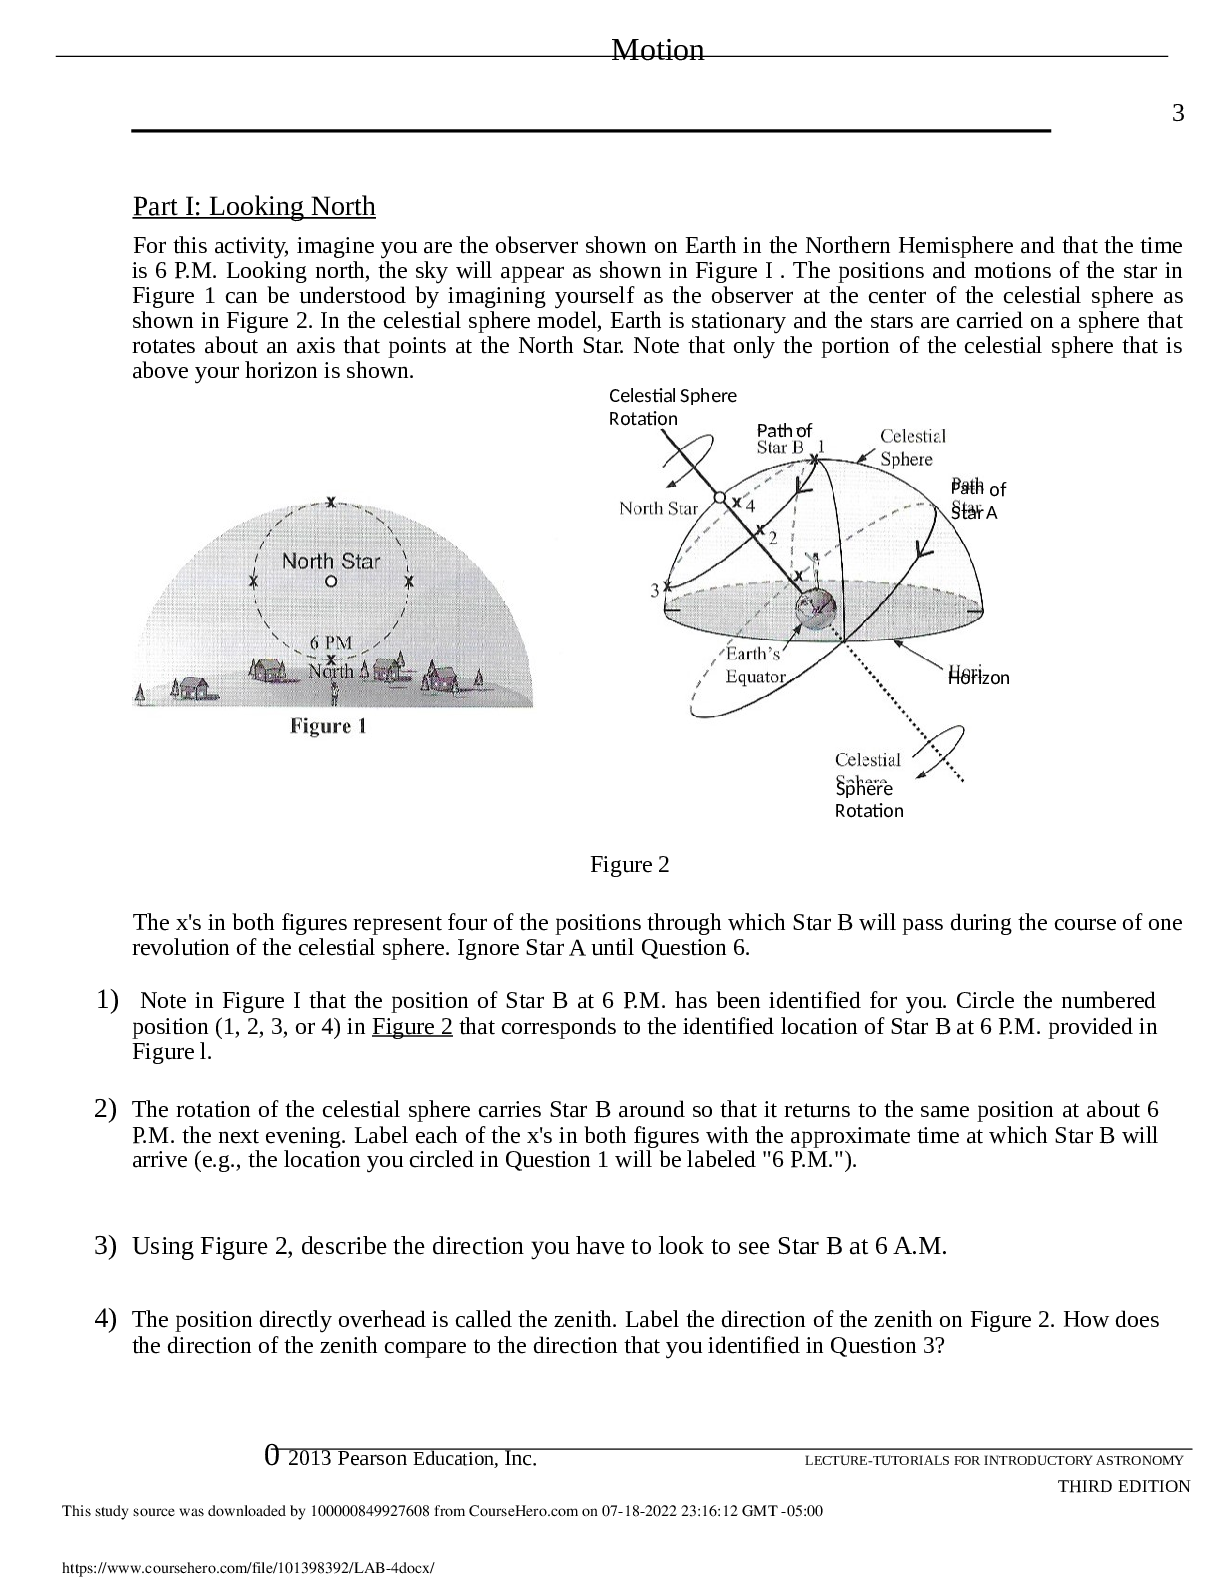
Pump Performance Pump Performance 1. Determine the transducer voltage bias average value from the data file. Include the 95% CI for this value. 95% CI = 2.82*10-5 2. Test Pump 1. See procedure in... lab manual. Complete Table 1 below using average voltage readings from data logger and corresponding pressure differential, pump head, and power draw for each flow rate. Table 1: Pump 1 measurement results Flow Rate (gpm) Voltage Reading P (psi) (lbf ????? ft/lbm) ?̇ ????(W) 15 4.23 6.05 13.98 183 12 4.47 6.80 15.7 180 9 4.95 8.30 19.2 172 6 5.17 8.98 20.8 166 0 5.99 11.5 26.7 139 3. Test Pump 2. See procedure in lab manual. Complete Table 2 below using average voltage readings from data logger and corresponding pressure differential, pump head, and power draw for each flow rate. Table 2: Pump 2 measurement results Flow Rate (gpm) Voltage Reading P (psi) (lbf ft/lbm ????? ) ?̇ ????(W) 15 4.48 6.828125 15.782504 185 12 4.82 7.890625 18.2383628 180 9 5.29 9.359375 21.6332263 168 6 5.54 10.140625 23.4390048 159 0 6.09 11.859375 27.4117175 120 4. Plot H (ft-lbf/lbm) vs. Q (gpm) curves for the Pump 1 and Pump 2 tests on the same graph along with the manufacturer’s rated values. For convenience, the manufacturer’s data are seen in Table 3 below: Vo = 2.295 +/– Table 3: Manufacturer's Data for Grundfos pumps GPM 0 2 4 6 8 10 12 14 16 18 20 Head 29.9 28.7 27.1 25 22.9 20.6 18 15.5 12.8 10.4 7.6 Figure 1 Plot showing Head Loss vs. Flow Rate Curves with error bars 5. Compare and discuss these three pump curves. As seen in Figure 1 above, all three curves follow the same inverse relationship trend, in that as flow rate increases, head loss decreases. Pumps 1 and pumps 2 both have relatively similar curves, with an almost identical slope. The manufacturer’s values however appear to have a much steeper slope. A reason for this could arise from the fact that the manufacturers’ values have more data points in its curve, thereby making its curve more precise. If there were more data points for the pumps 1 and 2 curves, those curves could possibly look more similar to the manufacturer’s curve. 6. Test Pumps 1 and 2 in Series. See procedure in lab manual. Complete Table 4 below using average voltage readings from data logger and corresponding pressure differential, pump head, and power draw for each flow rate. [Show More]
Last updated: 1 year ago
Preview 1 out of 7 pages

Reviews( 0 )
Document information
Connected school, study & course
About the document
Uploaded On
Oct 24, 2022
Number of pages
7
Written in

Additional information
This document has been written for:
Uploaded
Oct 24, 2022
Downloads
0
Views
58