*NURSING > STUDY GUIDE > NR 503 week 7 Study Guide: Review for Final | Download To Score An A (All)
NR 503 week 7 Study Guide: Review for Final | Download To Score An A
Document Content and Description Below
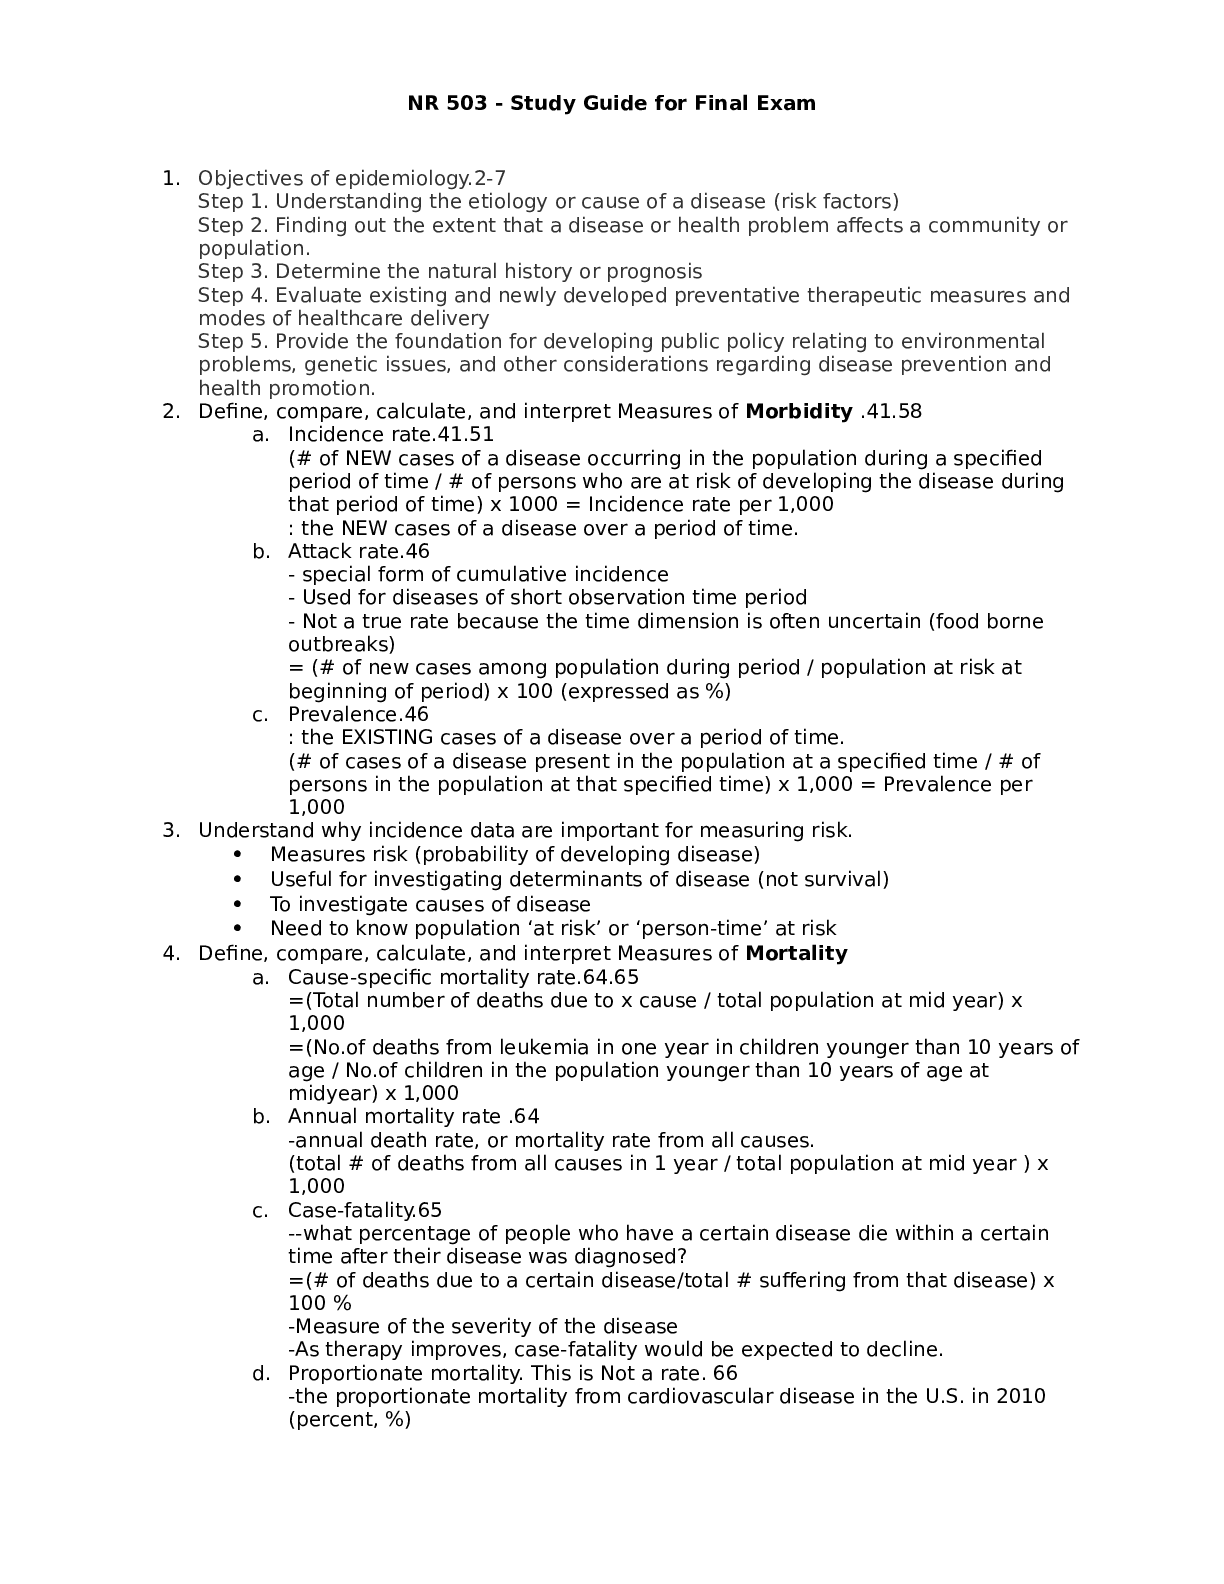
NR 503 - Study Guide for Final Exam 1. Objectives of epidemiology.2-7 Step 1. Understanding the etiology or cause of a disease (risk factors) Step 2. Finding out the extent that a disease or he... alth problem affects a community or population. Step 3. Determine the natural history or prognosis Step 4. Evaluate existing and newly developed preventative therapeutic measures and modes of healthcare delivery Step 5. Provide the foundation for developing public policy relating to environmental problems, genetic issues, and other considerations regarding disease prevention and health promotion. 2. Define, compare, calculate, and interpret Measures of Morbidity .41.58 a. Incidence rate.41.51 (# of NEW cases of a disease occurring in the population during a specified period of time / # of persons who are at risk of developing the disease during that period of time) x 1000 = Incidence rate per 1,000 : the NEW cases of a disease over a period of time. b. Attack rate.46 - special form of cumulative incidence - Used for diseases of short observation time period - Not a true rate because the time dimension is often uncertain (food borne outbreaks) = (# of new cases among population during period / population at risk at beginning of period) x 100 (expressed as %) c. Prevalence.46 : the EXISTING cases of a disease over a period of time. (# of cases of a disease present in the population at a specified time / # of persons in the population at that specified time) x 1,000 = Prevalence per 1,000 3. Understand why incidence data are important for measuring risk. • Measures risk (probability of developing disease) • Useful for investigating determinants of disease (not survival) • To investigate causes of disease • Need to know population ‘at risk’ or ‘person-time’ at risk 4. Define, compare, calculate, and interpret Measures of Mortality a. Cause-specific mortality rate.64.65 =(Total number of deaths due to x cause / total population at mid year) x 1,000 =(No.of deaths from leukemia in one year in children younger than 10 years of age / No.of children in the population younger than 10 years of age at midyear) x 1,000 b. Annual mortality rate .64 -annual death rate, or mortality rate from all causes. (total # of deaths from all causes in 1 year / total population at mid year ) x 1,000 c. Case-fatality.65 --what percentage of people who have a certain disease die within a certain time after their disease was diagnosed? =(# of deaths due to a certain disease/total # suffering from that disease) x 100 % -Measure of the severity of the disease -As therapy improves, case-fatality would be expected to decline. d. Proportionate mortality. This is Not a rate. 66 -the proportionate mortality from cardiovascular disease in the U.S. in 2010 (percent, %) -of all deaths in the US, what proportion was caused by cardiovascular disease? =( # of deaths from cardiovascular diseases in US in 2010 / total deaths in the US in 2010) x 100 5. Assess the Validity.89 and Reliability105.110 of Diagnostic and Screening Tests a. Define, compare and calculate measures of validity, including sensitivity and specificity. -Validity of test: its ability to distinguish between who has a disease and who does not. -Sensitivity of test is defined as the ability of the test to identify correctly those who have the disease. -Specificity of test is defined as the ability of the test to identify correctly those who do not have the disease. Have a Disease Do not have Disease Positive True Positive (TP) Have the disease And test positive a False Positive (FP) Do not have the disease But test positive b Positive predictive value = (TP/TP+FP)x10 0 =(a/a+b)x100 Negative False Negative (FN) Have the disease But test negative c True Negative (TN) Do not have the disease And test negative d Negative Predictive value =TN/TN+FN Sensitivity = TP /TP+FN Specificity =TN /TN+FP b. Define and calculate positive predictive value.100. -what is the probability that the patient has the disease? -PPV is proportion of people who screened positive and actually have the disease (True positive/All positives)x100 c. Relationship between Positive predictive value (PPV) and disease prevalence.101 : the higher the prevalence, the higher the predictive value. Therefore, a screening program is most productive and efficient if it is directed to a high- risk target population. Disease prevalence Positive Predictive Value 1% 17% 5% 51% d. Relationship between Positive predictive value and Specificity of the test. 104. : an increase in specificity resulted in a much greater increase in predictive value than did the same increase in sensitivity. Prevalence =10% , Sensitivity =100% Specificity Positive Predictive value 70% 27% 95% 69% 6. Epidemiologic transition • Describe a development phase which is marked by a sudden and abrupt increase in population growth rates of living organisms. This increase might be brought on by medical innovation in therapy and treatment of sickness or disease. • It may be followed by a re-leveling of population growth after subsequent declines in fertility rates. (how medical issues affect the population, how sickness spreads and to which population) • Broad change in epidemiological transition: shift from acute communicable diseases to chronic non-communicable diseases. • Causes of change in epidemiological transition: increase in food supply, clean water, environmental pollutants-smog, herbicides, radiation, migration of population, overuse of drugs. 7. Study designs (case-control.197, cross sectional.210, prospective and retrospective cohort.182, clinical trial) a. How findings from each study may be used to measure risks of disease association. b. Compare and contrast study designs, including advantages/disadvantages and methodologic considerations of each. c. Understand which study design is best suited to address the study hypothesis. d. Understand why cases and controls are matched in a case control study design. e. Understand common biases with each study design. f. Incidence density sampling in case-control study. -Are those studies where cases are incident cases. -In other words, they are recruited over a period of time as they develop. Analytic studies -Allow for testing of hypothesis; -they use explicit comparison group -Study causes of disease and test hypothesis -assess disease etiology (cause and effect) - systematically determine whether exposure is greater in diseased than non-diseased Descriptive studies -made up of population and individual level studies -Measure distribution of disease across population. -Do not assess disease etiology (cause and effect) -describe distribution of disease -Used to generate hypothesis rather than to test them -Used to allocate resources and plan programs. -limitation: cannot use to test hypothesis -Benefits: -less expensive, less time consuming b/c they use info already available -useful for describing patterns of disease occurrence -useful for formulating research questions Interventio nal studies -infer causality Observational studies Compare to Interventional study, there is no manipulation by the researcher. Strengths 1. alert us to possible relationships and epidemics 2. Inexpensive b/c often utilize easy to obtain data 3. only ecological variables can allow us to examine ecological relationships Limitations cannot test hypothesis about determinants of disease due to: 1. lack of comparison group (control groups) 2. lack of info about time course of variables 3. lack of control for confounding variables Cohort study 179 Longitudinal ex Framingham Exposed vs Not exposed Follows up both groups to compare the incidence of disease (or rate of death from disease) in the two group. Randomize d Controlled Trials Prospectiv e Concurrent Retrospecti ve Nonconcurre nt Historical cohort Case- control Retrospectiv e - Cases then exposed and not exposed. Controls (people w/o the disease) then exposed and not exposed. -You can infer an association b/w exposure and disease. But not causality b/c this is a case control study. -begin with knowledge of disease Cross sectional Prevalence studies b/c describe the prevalence of the exposure and disease in a particular population. -Design: define a population then look at who is exposed and who is not exposed. Then for exposed see who developed the disease and who did not develop the disease. Do the same for not exposed. -take place at 1 point in time; compare to cohort (done over time), --therefore can’t give you info about causality; time course of variables is unknown Clinical trial Case report Case series -Describes instance of disease -Gold standard for study design -b/c it can potentially establish a causal relationship. -but dose not mean that every randomized study will Investigator identifies the original population at the beginning of the study. Use historical data from the past so that we can telescope the frame of calendar time for the study and obtain our results sooner. To exam the possible relation of an exposure to a certain disease. We identify a group of individuals with that disease (called cases) and, -is at a single point in time, looking at a particular population, and noting how many people have the exposure and how many people have the disease. Case report to generation of hypothesis to hypothesis being proven (general flow of study design) establish a causal relationship for purposes of comparison, a group of people without that disease (called controls). -think snapshot of a defined population at a single point in time. -Survey a population; for each participant, we determine the serum cholesterol level and perform an ECG for evidence of CHD. Both exposure and disease outcome are determined simultaneousl y for each subject - documents unusual medical occurrence Case series - collections of individual case reports Limitation: Selection bias- What makes someone comparable to people in the cases, this is a broad area and can cause problems for case control studies. Strengths: good for study of rare conditions b/c you don’t have to wait for people to develop the disease, you start with people that have the disease already. -can study multiple exposures Limitation: Prevalence incidence bias is related to the fact that we have no information about the time course of variables in a crossectional study Strengths -cheap and level of exposure -Better than case report on: allow for control for other variable (control group), they can help reduce confounding variables Limitation: no control group Limitation -no compariso n group Strength -fast, cheap 8. Causal Inferences.262 a. Identify- the thought process, methods, and evidence used to support or refute a relationship as one of cause and effect Define- What is a conclusion about the presence of a health-related state or event and reason for its existence and provide examples for common biases in different epidemiological studies, including selection bias and information bias (e.g., recall, misclassification, differential classification, etc.). selection bias -Error due to systematic differences in exposures between those who are selected and those who are not Information bias -Systematic errors due to incorrect categorization -Measurement error in assessment of either exposure or outcome Nondifferential misclassification, (information bias) - If errors are about the same in both groups, it tends to minimize any true difference between the groups (bias toward the null). differential misclassification (information bias) -When there are more frequent errors in exposure or outcome classification in one of the groups Recall bias -Phenomenon where cases may recall past -exposures differently than controls recall past exposures b. Factors that could increase or decrease bias. c. Define confounding and be able to identify confounding factors in a study and approaches to handling confounding.268 -in a study of whether factor A is a cause of disease B, we say that a third factor, factor X, is a confounder 9. Identify causal association verses confounding in case control and cohort study designs.248 Necessary AND sufficient cause: a factor is both necessary and sufficient for producing the disease ex: lead exposure = lead poisoning Necessary but not sufficient cause: each factor is necessary but not, in itself, sufficient to cause the disease; multiple factors are needed ex: alcoholism sufficient but not necessary causes: factor is not required to produce a specified outcome BUT when present, is able to cause the outcome by itself. Means that there are other causes of outcome ex: exposure X = outcome Y exposure Z ALSO = outcome Y neither sufficient nor necessary causes: a cause that isn't required to produce the outcome and when present is not able to cause the outcome by itself; hence there are other causes of the specified disease 10. Understand the guidelines for determining if an observed association is causal (Bradford-Hill criterion) pg250-255 Bradford Hill, who is the person that suggested various aspects of an association to be considered when attempting to distinguish causal from noncausal associations a. Temporal: - One of Hill's guidelines for causal inference - Refers to the necessity that the cause precedes the effect in time - The only necessary criterion for a causal relationship -smoking precedes lung cancer b. Strength of association: According to Hill, what type of associations are more likely to be causal? -there should be a strong association between the incidence of the disease and exposure to the event, condition or agent. (effect size) c. Dose-response: - Refers to the presence of a monotonic (uni-directional) dose- response relationship Biological gradient Dose response-disease rates should increases with exposure Data support is not applicable d. Replication of findings-many observation have been replicated repeatedly. e. Biologic plausibility: - Refers to the biologic soundness of a hypothesis -a plausible mechanism between cause and effect is helpful, but may be limited by current knowledge f. Alternate explanations g. Cessation of exposure h. Consistency with other knowledge: One of Hill's guidelines for causal inference - Refers to the repeated observations of an association in different populations under different circumstances, reproducibility -consistent findings observed by different persons in different places with different samples strengthens the likelihood of an effect i. Specificity of the association: - One of Hill's guidelines for causal inference - Requires that a cause leads to a single effect, not multiple effects -causation is likely if there is a specific population at a specific site of the body and disease with no other likely explanation 11. Estimating Risks (risk measures) a. Calculate and interpret relative risk in a cohort study (i.e., estimate of the risk measure).217, -what is the ratio of the risk of disease in exposed individuals compared to the risk of disease in unexposed individuals. = RR= risk of exposed/risk of unexposed = a/a+b (exposed) / c/c+d (unexposed) -RR=1 ; risk in exposed equal to risk in nonexposed (no association) -RR>1 ; exposed person at greater risk, may be causal, positive association -RR<1 ; exposed person at less risk; may be protective b. Calculate and interpret an odds ratio in a cohort study and in a case-control study and to describe when the odds ratio is a good estimate of the relative risk (i.e., ratio measure of association). 222 Odds of an event-the ratio of the number of ways an event can occur divided by the number of ways that an event cannot occur =Probability of winning/prob. of losing c. Calculate and interpret absolute risk, 215 -Why can't we always calculate RR directly? -the ability to calculate RR depends on the ability to calculate absolute risk in exposed vs unexposed individuals. - absolute risk = incidence (in epi) - calculating incidence requires following individuals over time and measuring development of new cases --> sometimes this is not possible! d. Purpose of matching in case-control studies, -to select a comparison group that is comparable to the study group with respect to the distribution of one or more potential confounding variables. -Exposure-disease association is weak -Exposure is rare -Few variables to match on BUT as variables increase in number (cost increases, efficiency decreases) 12. Attributable Risk, 230 a. Calculate and interpret the attributable risk for an exposed group and a population. -Incidence of disease that is attributable to the exposure in the exposed group... • risk in nonexposed is NOT zero -- the have some risk • risk is known as background risk (Io) formula = (AR) = Ie - Io (Incidence in exposed group) - (incidence in the nonexposed group) • Risk in nonexposed is NOT zero - they have some risk • This risk is known as background risk • Every person shares the background risk regardless of whether or not he or she has had the specific exposure in question • Use formula to determine how much of the total risk in exposed persons is due to the exposure = (RR) • Subtract background risk from total risk = (AR) b. Comparison of relative risk and attributable risk • Important in establishing etiological relationship, the attributable risk is in many ways more important in clinical practice and public health • How much of the risk (incidence) of disease can we hope to prevent if we are able to eliminate exposure to the agent in question 13. Randomized trials: Internal validity vs External validity a. Internal validity, 162.163.263 -The study was done properly, and the findings of the study are therefore valid in the study population. -Validity of inferences for a given parameter for the sample at hand -the extent to which differences identified between randomized arms are a result of the intervention being tested (whether the trial results are valid for the original study population) -depends on good design, conduct, and analysis of the trial, with minimal bias -The ability of the research design to adequately test the hypothesis. -ask yourself if the study design provides strong evidence that the variables are associated with one another. -Did manipulation of the IV cause changes in the DV? b. Generalizability (external validity) -the ability to generalize results of the study to other situations. -Findings of the study are generalizable from the study population to the defined population, and presumably, to the total population. -refers to the extent to which study results can be applied to other individual or settings. -it is the ability of the results to be generalized to the ‘real world’ population (from clinical trials to practice) -concerns the generalizability of the trial results to persons(target population) other than the original study population 14. Evaluating Screening Programs a. Sources of bias that must be taken into account in assessing study findings, including referral bias, length-biased sampling, lead-time bias, five-year survival, and over-diagnosis bias. Pg326 referral bias do those who were voluntarily screened have the same characteristics as those who chose not to be screened? -volunteers healthier and more compliant, better prognosis length-biased sampling not from the type of person that comes for screening but comes from the type of disease that is selected for screening - does screening selectively identify cases of the disease which have a better prognosis? do cases that are found have a better prognosis regardless of how early therapy is initiated? - more likely to identify those with a long preclinical phase which might seem associated with living longer or better outcomes 1. compare with RCT 2. examine survival for both screened and unscreened - in the screened group, survival should be calculated for those in whom the disease is detected between screening examinations lead-time bias survival seems better because the interval from diagnosis to death is longer, but the patient is not any better off because death has not been delayed five-year survival 1. must take into account for an estimated lead time in an attempt to id any prolongation of survival above that resulting from the artifact of lead time (see below) 2. compare mortality from the disease in the entire screened group with that in the unscreened group, rather than just the case fatality rate in those in whom disease was detected by screening over-diagnosis bias people who initiate screening programs overdiagose because they are just so excited (more false-positives) overestimates association b. Characteristics and patterns of disease progression and effective screening program. 15. Considerations when evaluating individual data a) Are the characteristics of the two groups comparable—demographically, medically, and in terms of factors relating to prognosis? pg315 b) Are the measurement methods comparable (e.g., diagnostic methods and the way disease is classified) in both groups? pg315 16. Calculations and interpretations a. Risk ratio b. Relative risk, 161.217: The ratio of the risk of disease in exposed individuals to the risk of disease in non-exposed individuals. c. Odds ratio, 222: The ratio of the odds of development of disease in non- exposed person. d. Attributable risk,230: how much of the risk (incidence) of the disease we hope to prevent if able to eliminate exposure to the agent in question. e. Incidence rate, 41-46:The number of new cases of a disease that occurs during specified period of time in a population at risk for developing the disease. f. Disease incidence g. Annual mortality rate.64 h. Positive predictive value.100 i. Sensitivity and specificity.89 j. Prevalence rate.46:The number of affected persons present in the population at a specific time divided by the number of persons in the population at that same time. k. Concordance rate.290 RCT Cohort Case-control Caseseries,repor t observational observational [Show More]
Last updated: 1 year ago
Preview 1 out of 11 pages
Reviews( 0 )
Document information
Connected school, study & course
About the document
Uploaded On
Dec 01, 2022
Number of pages
11
Written in

Additional information
This document has been written for:
Uploaded
Dec 01, 2022
Downloads
0
Views
77