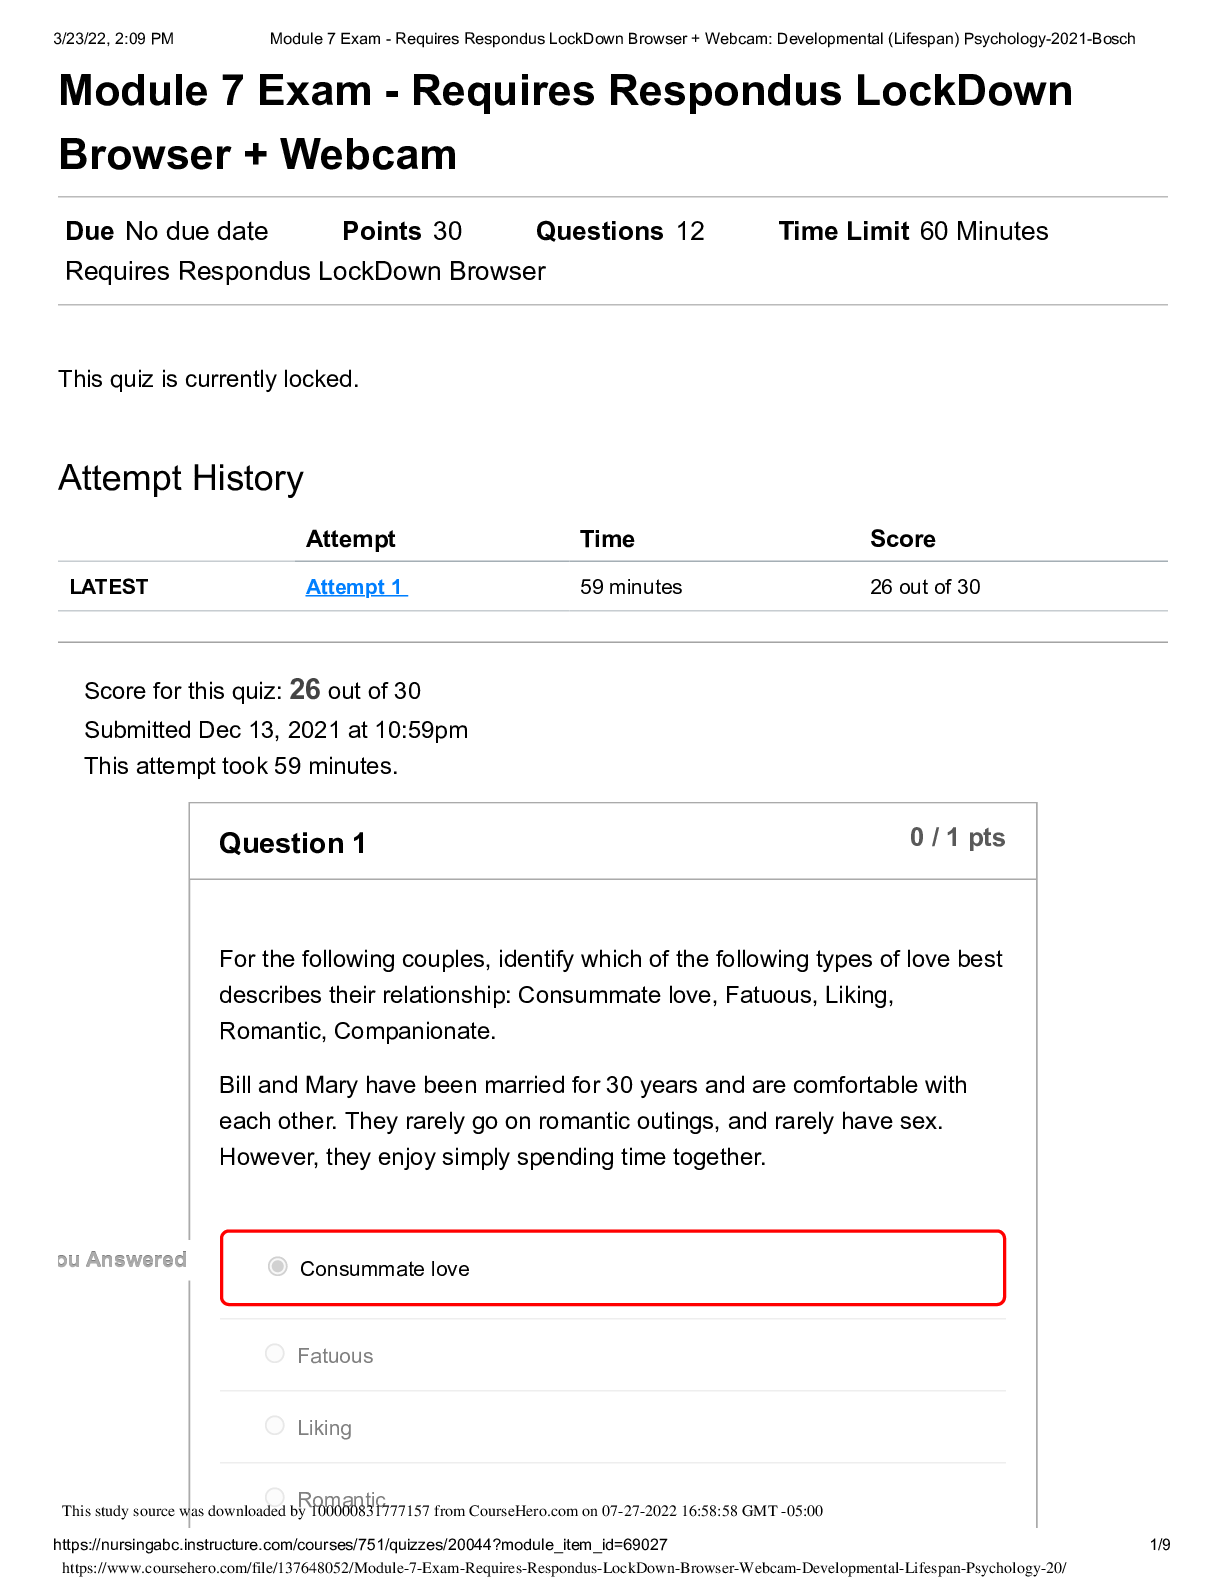
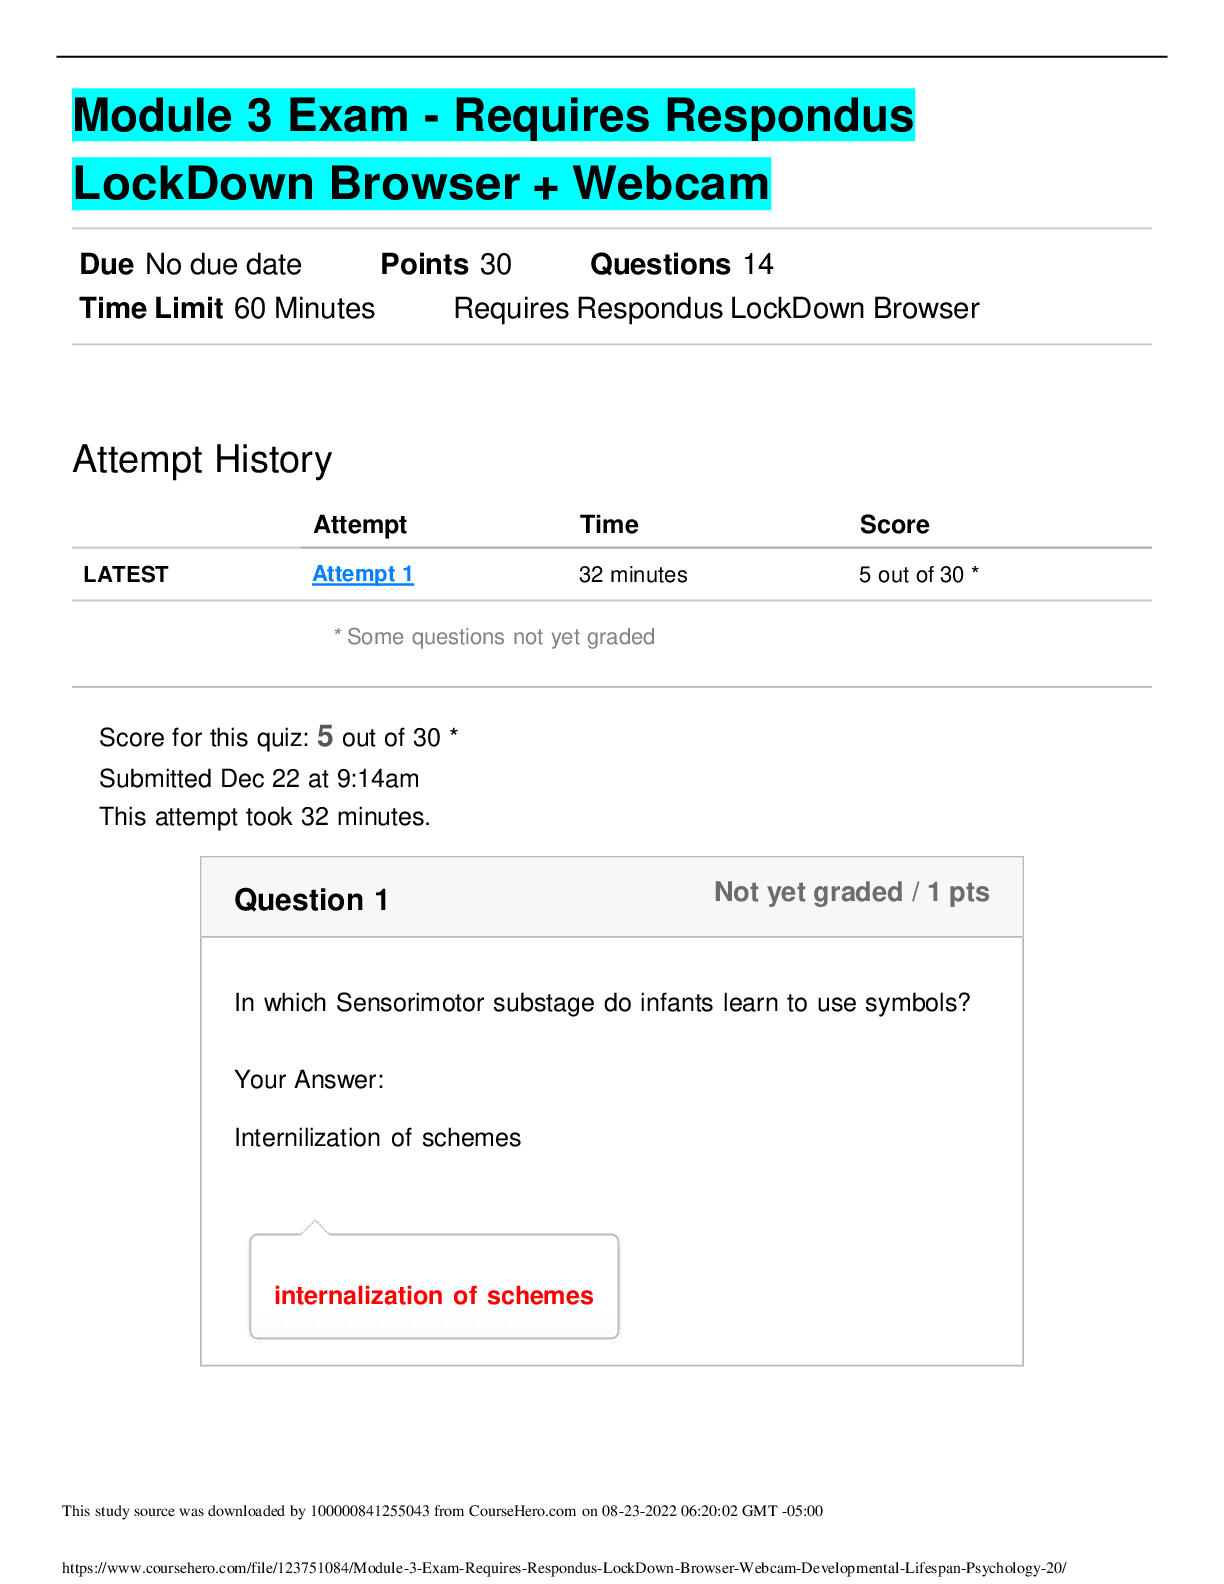
Exam>Uniformly Accelerated Particle Model Test
Document Content and Description Below
1. Consider the position vs time graph for objects A and B below. a. Draw qualitative motion maps for objects A and B. Include v and a vectors. b. Describe how the motion of object A is different fr... om that of object B. c. Qualitatively compare the following quantities for objects A and B. If A has the greater value write "A" in the blank. If B has the greater value write "B". If A=B write "=". Displacement from t = 0 s to t = 5s Displacement from t = 0 s to t = 2.5s Displacement from t = 2.5 s to t = 5s Average velocity from t = 0 s to t = 5s Average velocity from t = 0 s to t = 2.5s Instantaneous velocity at t = 5s A position (m) 5 time (s) B 2.5 vel: acc: 0m + vel: acc: 0m + A: B: ©Modeling Instruction 2013 2 U3 Uniform Acceleration - test v3.1 2. Consider the velocity vs time graph for objects A and B below. a. Draw qualitative motion maps for objects A and B. Include v and a vectors. b. Qualitatively compare the following quantities for objects A and B. If A has the greater value write "A" in the blank. If B has the greater value write "B". If A=B write "=". Instantaneous velocity at t = 0 s Instantaneous velocity at t = 2.5s Instantaneous velocity at t = 5s Average velocity from t = 0s to t = 2.5s Average velocity from t = 0s to t = 5s Displacement from t = 0 to t = 2.5s Displacement from t = 0 to t = 5s Acceleration at t = 5s. Briefly explain: time (s) 2. 5 5 8642 0 A B 0 velocity (m/s) vel: acc: 0m + vel: acc: 0m + A: B: 3. From the given graph in each of the sets below, sketch the shape of the corresponding graphs. tim e velocity tim e acceleration a. b. tim e position tim e velocity tim e acceleration tim e position c. tim e velocity tim e acceleration tim e position 4. Your teacher's car can go from rest to 25 m/s (≈60mph) in 10 seconds. The car's velocity changes at a uniform rate. a. Draw a qualitative motion map to represent the motion of the car during the 10 s. Include v and a vectors. b. Construct a quantitative velocity vs time graph to represent the motion of the car. c. Determine the acceleration of the car. Show work; use units. d. How far does the car travel in these 10 seconds? Explain or show how you got your answer. [Show More]
Last updated: 1 year ago
Preview 1 out of 6 pages

Buy this document to get the full access instantly
Instant Download Access after purchase
Add to cartInstant download
We Accept:

Reviews( 0 )
$4.00
Document information
Connected school, study & course
About the document
Uploaded On
Jan 15, 2023
Number of pages
6
Written in
Additional information
This document has been written for:
Uploaded
Jan 15, 2023
Downloads
0
Views
58

.png)
.png)
