Astronomy > QUESTION PAPER & MARK SCHEME > Q&A > 100 lab 4. University of Illinois, Urbana Champaign ASTR 100 A SP21_ Exploring the HR Diagram (All)
Q&A > 100 lab 4. University of Illinois, Urbana Champaign ASTR 100 A SP21_ Exploring the HR Diagram Lab: Attempt review_Grade 45.50 out of 50.00 (91%)
Document Content and Description Below
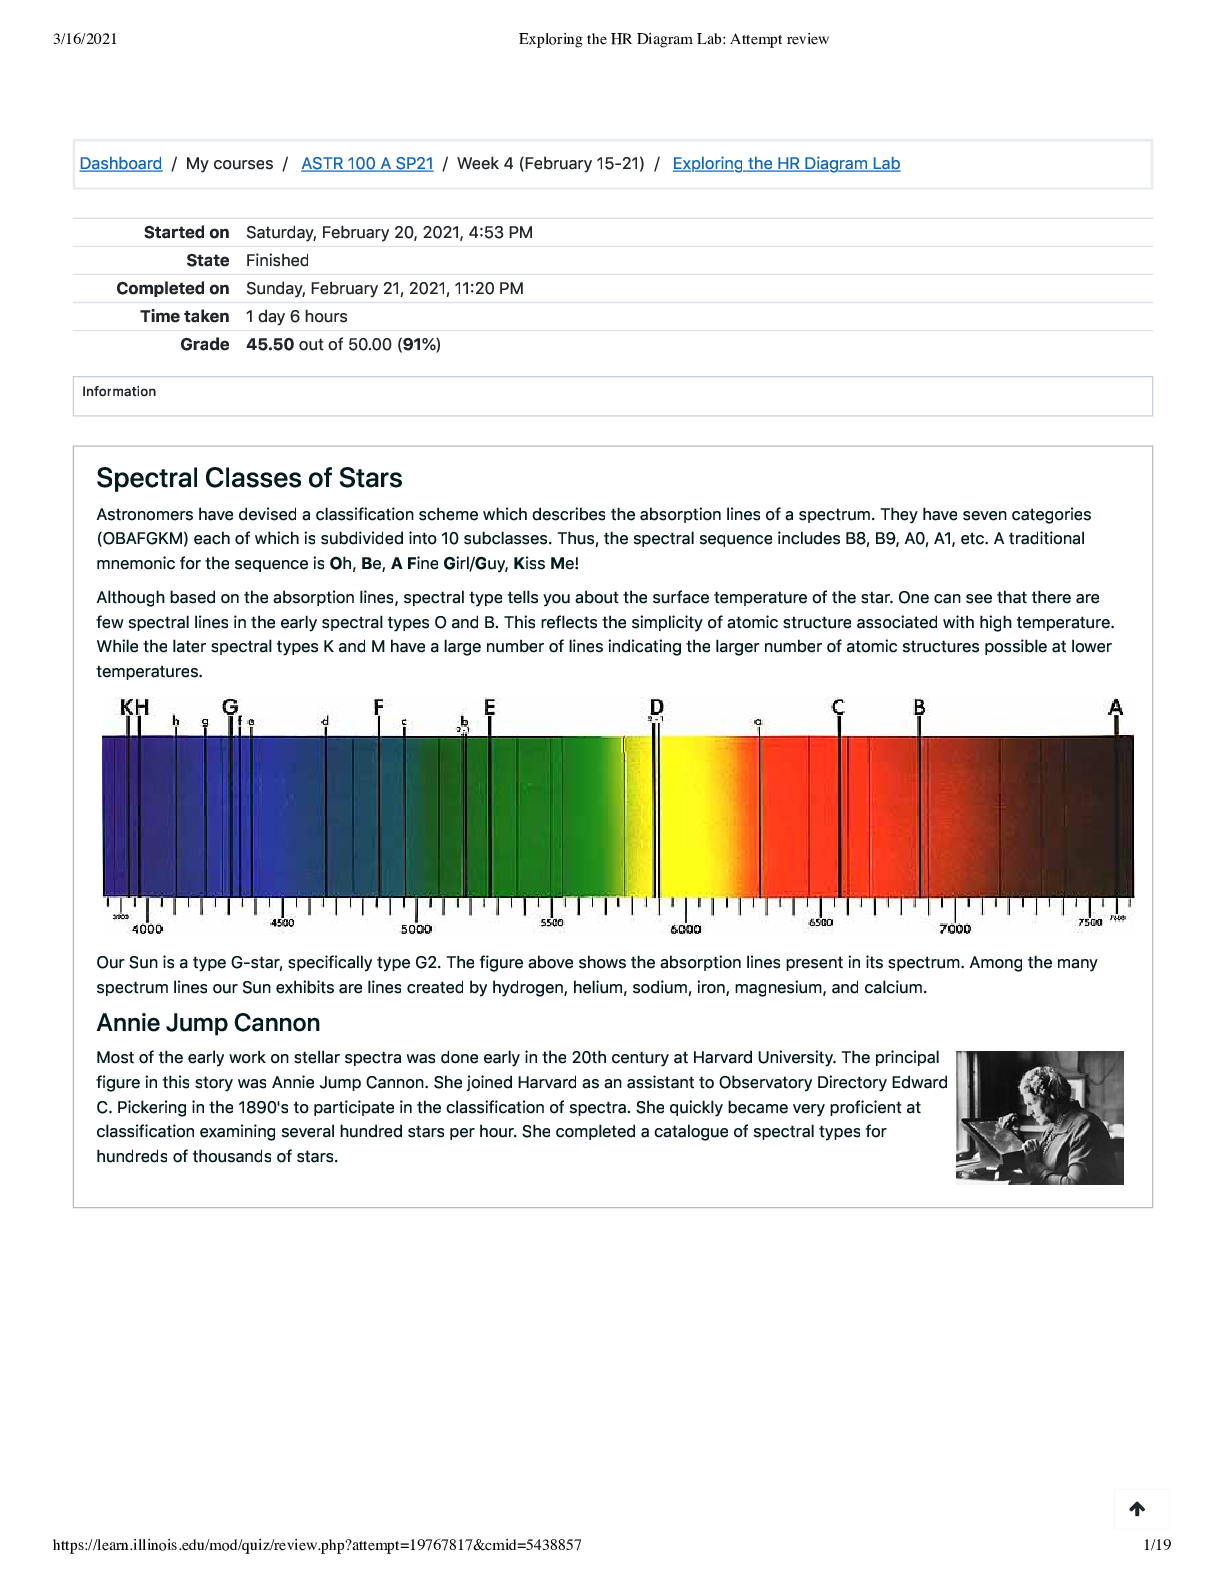
Spectral Classes of Stars Astronomers have devised a classification scheme which describes the absorption lines of a spectrum. They have seven categories (OBAFGKM) each of which is subdivided into 1... 0 subclasses. Thus, the spectral sequence includes B8, B9, A0, A1, etc. A traditional mnemonic for the sequence is Oh, Be, A Fine Girl/Guy, Kiss Me! Although based on the absorption lines, spectral type tells you about the surface temperature of the star. One can see that there are few spectral lines in the early spectral types O and B. This reflects the simplicity of atomic structure associated with high temperature. While the later spectral types K and M have a large number of lines indicating the larger number of atomic structures possible at lower temperatures. Our Sun is a type G-star, specifically type G2. The figure above shows the absorption lines present in its spectrum. Among the many spectrum lines our Sun exhibits are lines created by hydrogen, helium, sodium, iron, magnesium, and calcium. Annie Jump Cannon Most of the early work on stellar spectra was done early in the 20th century at Harvard University. The principal figure in this story was Annie Jump Cannon. She joined Harvard as an assistant to Observatory Directory Edward C. Pickering in the 1890's to participate in the classification of spectra. She quickly became very proficient at classification examining several hundred stars per hour. She completed a catalogue of spectral types for hundreds of thousands of stars. 3/16/2021 Exploring the HR Diagram Lab: Attempt review https://learn.illinois.edu/mod/quiz/review.php?attempt=19767817&cmid=5438857 2/19 Information Blackbody Curves The outward appearance of stars depends more strongly on the underlying continuous spectrum coming from the inner parts of a star than the absorption at its surface. Continuous spectra for stellar interiors at different temperatures are described by blackbody curves shown in the figure to the left. Note that as the temperature increases the total amount of light energy produced (the area under the curve) increases and the peak wavelength (the color at which the most light is produced) moves to smaller more energetic wavelengths. The temperature of a star therefore determines its apparent color. The lowest temperature stars are orang Question 1 Correct 6.00 points out of 6.00 Information Complete the blank entries in the table below, which summarizes the relationship between spectral type, temperature, and color for stars. Note that the surface temperature of the stars in the table increases. Star Surface Temperature (K) Spectral Class Color Betelgeuse M Arcturus 4,300 Sun Yellow Procyon A F Yellow-White Sirius A A White Rigel A 11,000 Delta Orionis O 3,500 Red K Orange 5,800 G 6,500 9,000 B lue-White 33,000 Blue Luminosity Luminosity is the total energy that a star produces in one second. It depends on both the radius of the star and on its surface temperature. One can calculate luminosity by finding the product of 1) how much energy each section of the surface of a star is producing (σT , the Stefan-Boltzmann Law) and 2) the entire surface area of the star (4πR ). Thus, the luminosity of a star (σT 4πR ) would increase if one increased either the size R or the surface temperature T, with temperature being the dominating factor. If we work in solar units (e.g., R , L ), we can ignore the constants and simply write L = R T . For example, if a star has the same surface temperature as the sun and a radius that is twice as big, its luminosity must be L = (2 R ) (T ) = 4L . Let's consider some additional examples: What is the luminosity of a star that is half as big as the sun and twice as hot? In this case the luminosity must be L = (0.5 R ) (2 T ) = 0.25 R 16 T = 4 L . Estimate the size of a star that has the same surface temperature as the sun but produces 100 times as much energy. In this case, we have 100 LSun = R T . Solve for R: R2 = 100 L / T =100 R R = 10 R 4 2 4 2 Sun Sun 2 4 Sun 2 Sun 4 Sun Sun 2 Sun 4 Sun2 Sun4 Sun 2 Sun4 Sun Sun4 Sun2 Sun 3/16/2021 Exploring the HR Diagram Lab: Attempt review https://learn.illinois.edu/mod/quiz/review.php?attempt=19767817&cmid=5438857 4/19 Question 2 Correct 2.00 points out of 2.00 Information Complete the following table related to the relationship between stellar luminosities, surface temperatures, and radii in solar units (L=T R ). Note: Enter only numerical values (e.g., "5.4"). Also, do not enter commas in numerical answers (e.g., enter "3000" not "3,000"). Radius (R ) Temperature (T ) Luminosity (L ) 1 1 1 1 2 16 3 1 9 1 0.5 .0625 4 2 Sun Sun Sun Plot of luminosity vs. temperature of a cluster of stars Origin of the Hertzsprung-Russell Diagram Many scientific discoveries are made first theoretically and then proven to be correct, or nearly so, in the laboratory. That was not the case however, for the Hertzsprung-Russell diagram. A significant tool to aid in the understanding of stellar evolution, the H-R diagram was discovered independently by two astronomers in 1912 using observational comparisons. They found that when stars are plotted using the properties of temperature and luminosity as in the figure to the right, the majority form a smooth curve. The actual properties originally plotted were properties which can be determined observationally. Probably more like the absolute magnitude (Mv), which is determined from how bright the star looks from Earth and its distance away, versus the B-V color index. This index comes from a difference in the amount of blue light a star emits and the amount of visual (more green) light emitted and is related to the temperature. The resulting diagram was named after the two discovering astronomers, Ejnar Hertzsprung of Denmark and Henry Norris Russell of America. Imagine plotting a random sampling of stars from our galaxy. The majority of these stars when plotted on an H-R diagram go down from left to right in a diagonal line. The temperature scale along the bottom axis goes from coolest on the right to hottest on the left. This is contrary to the normal convention, where values increase going left to right on an axis. The Luminosity scale on the left axis is dimmest on the bottom and gets brighter towards the top. This places the cooler, dimmer stars towards the lower right and the hotter, more luminous stars at the upper left. Our own star, the Sun, is nearly in the middle of both the temperature and luminosity scales relative to other stars. This puts it around the middle of the diagonal line. 3/16/2021 Exploring the HR Diagram Lab: Attempt review https://learn.illinois.edu/mod/quiz/review.php?attempt=19767817&cmid=5438857 5/19 Information The Basic H-R Diagram The stars which lie along this nearly straight diagonal line are known as main sequence stars. The main sequence line accounts for about 80% to 90% of the total stellar population. The basic H-R diagram is a temperature vs. luminosity graph. The temperature may be replaced or supplemented with spectral class (or color index as noted earlier). The main spectral classes in order from hottest to coolest are O, B, A, F, G, K, and M. These classes have particular colors. Spectral type is most often written across the top of the H-R diagram going from hot, bluer “O” stars on the left to cool, more red “M” stars on the right. A Closer Look Stellar luminosity, or a stars “brightness”, depends on two things, its surface area and its temperature. The Stefan-Boltzmann Law gives us this relation: L = 4πR σT where L is the luminosity, R is the stellar radius, and T is the temperature (alpha is a constant). From this we see that stars above the main sequence on the H-R diagram (higher luminosity) , with the same temperature as cooler main sequence stars, have greater surface areas (larger radii). Also, stars that have the same luminosity as dimmer main sequence stars, but are to the left of them (hotter) on the H-R diagram, have smaller surface areas (smaller radii). Bright, cool stars are therefore necessarily very large. These enormous stars are called Red Giants and lie above the main sequence line. Antares is a good example of a red giant. Its temperature is a cool 3548 K (the Sun is about 5770 K), while its luminosity is about 50,000 times brighter than the Sun. This must mean that it has a very large radius, in fact about 600 times larger than the solar radius! Similarly, stars that are very hot and yet still dim must have small surface areas. These small, hot stars are called White Dwarfs and lie below the main sequence. They can have radii as small as the Earth, having temperatures around 10,000 K. Looking back at the Stefan-Boltzmann Law we may notice that by holding R constant and plotting the luminosity as the temperature varies, we generate a set of diagonal lines. These constant radius lines go from the upper left to the lower right (negative slope) of the diagram. The lower figure shows these constant radius lines on the H-R diagram. Stars fall into three general categories. These categories are main sequence stars, red giants, and white dwarfs. It is important to note that the location of a star on the H-R diagram does NOT relate to its position in space. In fact, many of the brighter stars on the diagram are not among the closest to Earth. [Show More]
Last updated: 1 year ago
Preview 1 out of 19 pages
Reviews( 0 )
Document information
Connected school, study & course
About the document
Uploaded On
Jan 18, 2023
Number of pages
19
Written in

Additional information
This document has been written for:
Uploaded
Jan 18, 2023
Downloads
0
Views
44


.png)


.png)


.png)

.png)


.png)
.png)
.png)