Mathematics > QUESTIONS & ANSWERS > BA 578 FINAL EXAM 2 - Latest 2019/20 Complete solution, A+ Guide; Texas A&M University, -Commerce. (All)
BA 578 FINAL EXAM 2 - Latest 2019/20 Complete solution, A+ Guide; Texas A&M University, -Commerce.
Document Content and Description Below
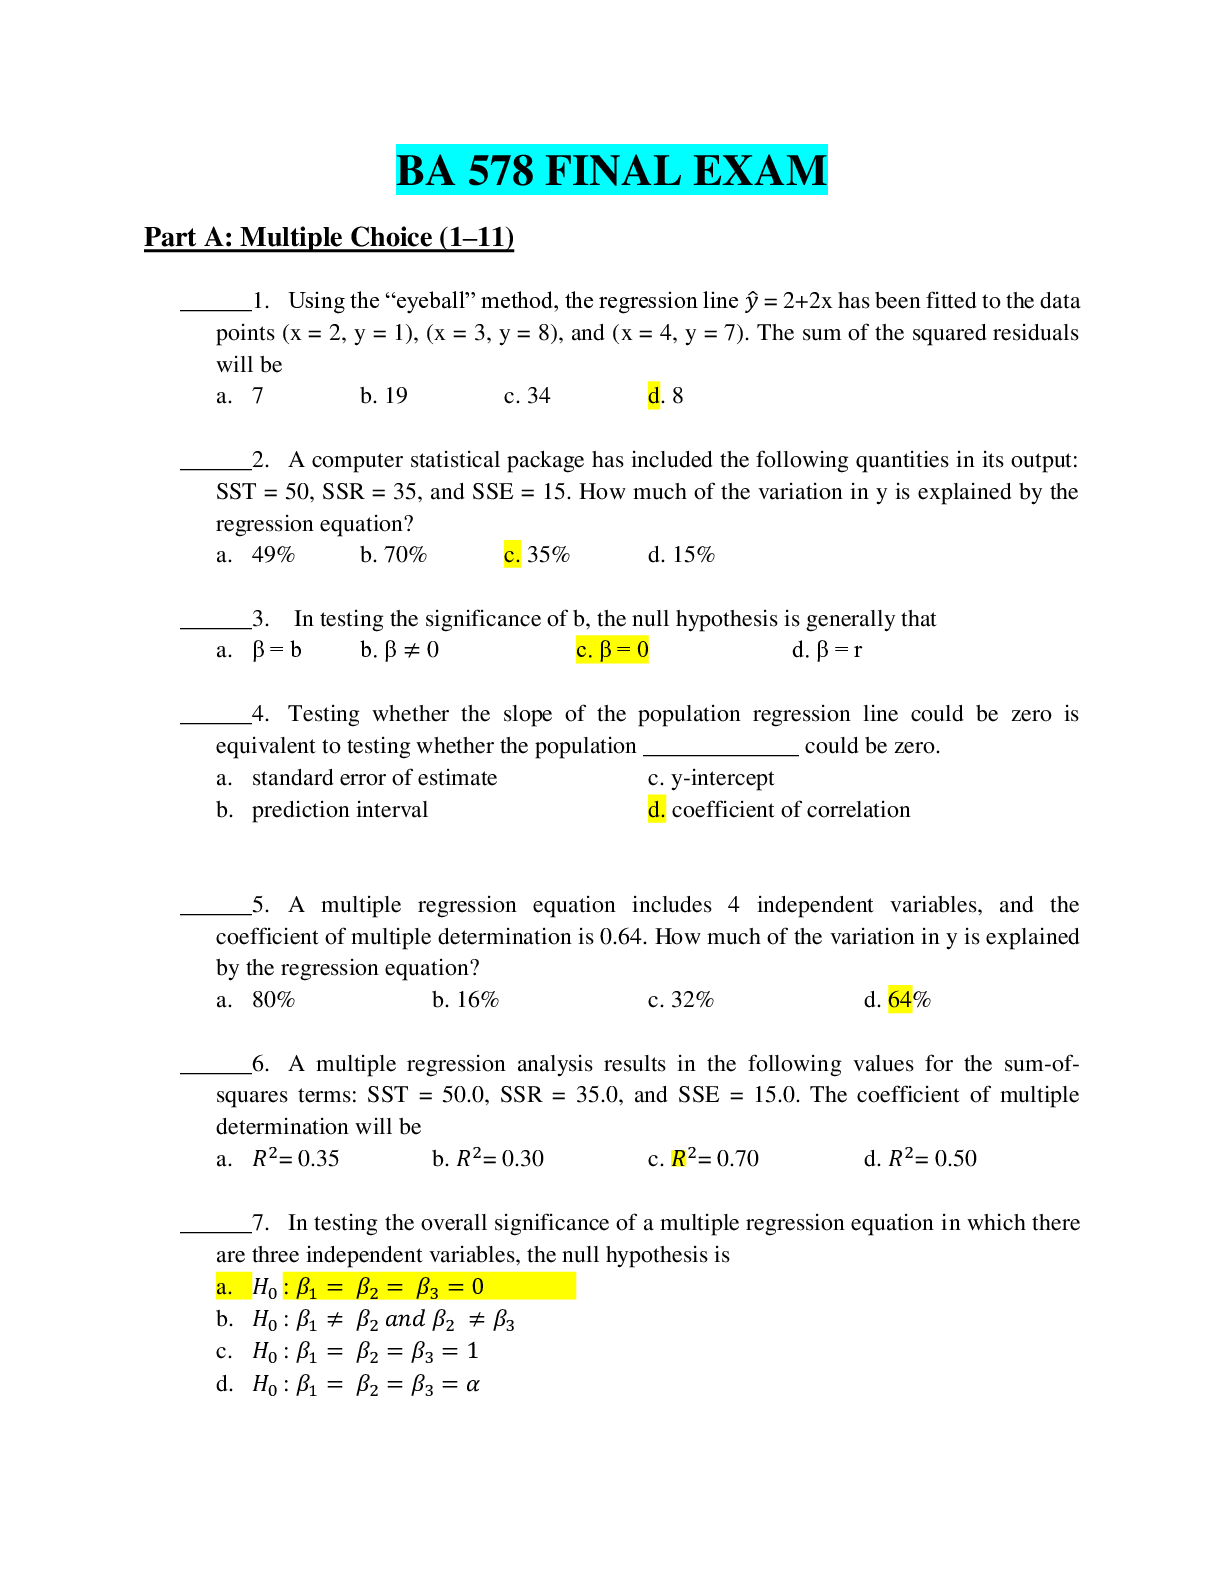
BA 578 FINAL EXAM 2 Part A: Multiple Choice (1–11) Using the “eyeball” method, the regression line y ̂ = 2+2x has been fitted to the data points (x = 2, y = 1), (x = 3, y = 8), and (x = 4... , y = 7). The sum of the squared residuals will be 7 b. 19 c. 34 d. 8 A computer statistical package has included the following quantities in its output: SST = 50, SSR = 35, and SSE = 15. How much of the variation in y is explained by the regression equation? 49% b. 70% c. 35% d. 15% In testing the significance of b_1, the null hypothesis is generally that β = b_1 b. β ≠ 0 c. β = 0 d. β = r Testing whether the slope of the population regression line could be zero is equivalent to testing whether the population _____________ could be zero. standard error of estimate c. y-intercept prediction interval d. coefficient of correlation A multiple regression equation includes 4 independent variables, and the coefficient of multiple determination is 0.64. How much of the variation in y is explained by the regression equation? 80% b. 16% c. 32% d. 64% A multiple regression analysis results in the following values for the sum-of-squares terms: SST = 50.0, SSR = 35.0, and SSE = 15.0. The coefficient of multiple determination will be R^2= 0.35 b. R^2= 0.30 c. R^2= 0.70 d. R^2= 0.50 In testing the overall significance of a multiple regression equation in which there are three independent variables, the null hypothesis is H_(0 ): β_1= β_2= β_3=0 H_(0 ): β_1≠ β_2 and β_2 ≠β_3 H_(0 ): β_1= β_2=β_3=1 H_(0 ): β_1= β_2=β_3=α In a multiple regression analysis involving 25 data points and 4 independent variables, the sum-of-squares terms are calculated as SSR = 120, SSE = 80, and SST = 200. In testing the overall significance of the regression equation, the calculated value of the test statistic will be F = 1.5 c. F = 5.5 F = 2.5 d. F = 7.5 For a set of 15 data points, a computer statistical package has found the multiple regression equation to be y ̂ = -23 + 20x_1+ 5x_2 + 25x_3 and has listed the t-ratio for testing the significance of each partial regression coefficient. Using the 0.05 level in testing whether b_1= 20 differs significantly from zero, the critical t values will be t = -1.960 and t= +1.960 t = -2.132 and t = +2.132 t = -2.201 and t = +2.201 t = -1.796 and t = +1.796 Computer analyses typically provide a p-Value for each partial regression coefficient. In the case of b_1, this is the probability that β_1 = 0 b_1 = β_1 the absolute value of b_1could be this large if β_1= 0 the absolute value of b_1could be this large if β_1≥ 1 In the multiple regression equation, y ̂ = 20,000 + 0.05x_1+ 4500x_2 , y ̂ is the estimated household income, x_1 is the amount of life insurance held by the head of the household, and x_2 is a dummy variable (x_2 = 1 if the family owns mutual funds, 0 if it doesn’t). The interpretation of b_2 = 4500 is that owing mutual funds increases the estimated income by $4500 the average value of a mutual funds portfolio is $4500 45% of the persons in the sample own mutual funds the sample size must have been at least n = 4500 Part B: True or False (12-20) _______ 12. The usual objective of regression analysis is to predict estimate the value of one variable when the value of another variable is known. _______ 13. Correlation analysis is concerned with measuring the strength of the relationship between two variables. _______ 14. In the least squares model, the explained sum of squares is always smaller than the regression sum of squares. _______ 15. The sample correlation coefficient and the sample slope will always have the same sign. _______ 16. An important relationship in regression analysis is(Y_i-Y ̅ )=(Y ̂-Y ̅ )+(Y_i-Y ̂). _______ 17. If in a regression analysis the explained sum of squares is 75 and the unexplained sum of square is 25, r2 = 0.33. _______ 18. When small values of Y tend to be paired with small values of X, the relationship between X and Y is said to be inverse. _______ 19. The probability that the test statistic will fall in the critical region, given that H0 is true, represents the probability of making a type II error. _______ 20. When we reject a true null hypothesis, we commit a Type I error. Part C: Please fill in the blank and circle your decision or answer the following questions (21-25). State whether you would reject or fail to reject the null hypothesis in each of the following cases (two-tailed): Make a decision. P = 0.12 ; α=0.05 Decision Reject / Fail to reject P = 0.03 ; α=0.05 Decision Reject / Fail to reject P = 0.001 ; α=0.01 Decision Reject / Fail to reject 22. State whether H_0 should be accepted or rejected for α=0.05, given the following; F^*= computed F (fill in the blank and circle your decision) a) F^* = 2.34; df = 2 and 11 Computed F Critical F Decision ________ ________ Reject / Fail to reject b) F^* = 2.52; df = 4 and 20 Computed F Critical F Decision ________ ________ Reject / Fail to reject c) F^* = 4.29; df = 3 and 24 Computed F Critical F Decision ________ ________ Reject / Fail to reject 23. Given the following, complete the ANOVA table and make the correct inference. Using F-value to make a decision. Source SS df MS F Treatments _____ 2 3.24 _____ Error _____ 17 _____ Total 40.98 _____ ANSWER a) What is the hypothesis being tested in this problem? b) In the above ANOVA table, is the factor significant at the 5% level? c) What is the number of observations? 24. Given the following, complete the ANOVA table and make the correct inference. Using F-value to make a decision. Source SS df MS F Treatments ____ 5 205.5 ____ Error 637 ____ ____ Total ____ 25 ANSWER a) What is the hypothesis being tested in this problem? b) In the above ANOVA table, is the factor significant at the 5% level? c) What is the number of observations? 25. Given the following, complete the ANOVA table and make the correct inference. Using F-value to make a decision. Source SS df MS F Treatments ____ 3 ____ ____ Error 88.8 ____ ____ Total 435 19 ANSWER a) What is the hypothesis being tested in this problem? b) In the above ANOVA table, is the factor significant at the 5% level? c) What is the number of observations? Part D: Must show all your work step by step in order to receive the full credit; Excel is not allowed. (26-38) Consider the following hypothesis test. Ho: µ = 17 Ha: µ ≠ 17 A sample of 25 gives a sample mean of 14.2 and sample variance of 25. a) At 5% should the null be rejected? b) Compute the value of the test statistic c) What is the p-value? d) What is your conclusion? Consider the following hypothesis test Ho: µ ≥ 10 Ha: µ < 10 A sample of 50 provides a sample mean of 9.46 and sample variance of 4. a) At 5% should the null be rejected? b) Compute the value of the test statistic c) What is the p-value? d) What is your conclusion? Use problem 13 on page 9-20 to answer the following questions. (info on last page) What is the sample mean What is the sample standard deviation Use Z or T test? And why? What is your hypothesis test At α = 0.05, what is the rejection rule? Compute the value of the test statistic. What is the p-value? What is your conclusion? Use problem 7 on page 9-36 to answer to following questions. (info on last page of document) a) At 5% should the null be rejected? b) Compute the value of the test statistic c) What is the p-value? d) What is your conclusion? 30. For n=6 data point, the following quantities have been calculated. ∑xy = 400 ∑x = 40 ∑y = 76 ∑x2 = 346 ∑y2 = 1,160 a)Find b_1 b)Find b_0 c)Write the equation d)Find (R^2 ) ̅ e)Find SST f)Find S_e g) Construct the 95% confidence interval for the mean of y when x = 7 h) Construct the 95% confidence interval for the individual value of y when x = 7 Please fill in the computer printout and answer the following questions. Given that α=0.05 SUMMARY OUTPUT Regression Statistics Multiple R 0.9037 R Square ______ Adjusted R Square ______ Standard Error ______ Observations 5 ANOVA df SS MS F Significance F Regression 1 4.9 ______ ______ 0.03535 Residual 3 1.1 ______ Total ______ ______ Coefficients Standard Error t Stat P-value Lower95% Upper 95% Lower 95.0% Upper 95.0% Intercept -0.1 ______ -0.15746 0.88488 -2.12112 1.92112 -2.12112 1.92112 X1 0.7 ______ 3.65563 0.03535 0.09061 1.30939 ______ ______ a) What percent of the variation is explained by the regression equation? b) What is the standard error of regression? c) What is the critical value of the F-statistic? d) What sample size is used in the print out? The following regression equation was obtained using the five independent variables. Given that α=0.05 a) What percent of the variation is explained by the regression equation b) What is the standard error of regression? c) Write the estimated equation. d) What is the critical value of the F-statistic? e) What sample size is used in the print out? f) What is the variance of the slope coefficient of income? g) Assuming that you are using a two-tailed test make a decision using the computed P-value. 33. Use problem 5 on page 15-9 to answer the following questions. (a-d) (info on last page) What is you hypothesis testing What is your χ^2? c) Is the χ^2 value significant at 5% level of significance? d) Write the conclusion for this question. 34. Eighty Frat Rats were blindfolded and given a taste test on different brands of beer. The table below shows the beer brands preferred. Test to see if the data fits a uniform distribution (i.e., what would happen if the Frat Rats can’t tell one beer from another). Use 5% level of significance. Beer Brand Number of Preferring that Brand Bud Light 32 Coors Light 18 Molton Golden 14 Miller Light 16 What is you hypothesis testing What is your χ^2? c) Is the χ^2 value significant at 5% level of significance? d) Write the conclusion for this question. 35. Use the computer printout below to answer the following questions. Coefficients Std. Error t-Stat P-value Intercept 729.8665 169.25751 4.3121659 0.0010099 Price -10.887 3.4952397 -3.1148078 0.0089406 Advertising 0.0465 0.0176228 2.6386297 0.0216284 ANOVA df SS MS F Significance F Regression 2 12442.8 6221.4 37.56127994 0.00000683 Residual 12 1987.6 165.63333 Total 14 14430.4 Se =12.86986 R-sq = 0.862263 R-sq(adj) = 0.8393068 α=5% a) Write and interpret the multiple regression equation b) Does the model with Price and Advertising contribute to the prediction of Y? c) Which independent variable appears to be the best predictor of sales? Explain. d) What is the number of observations used in this study? e)Find SST Assuming that the coefficient on Advertising has Ha: B1 > 0, what’s statistical decision ? f) What is the standard error of estimate? Can you use this statistic to assess the model’s fit? If so, how? g) What is the coefficient of determination, and what does it tell you about the regression model? h) What is the coefficient of determination, adjusted for degrees of freedom? What do this statistic and the statistic referr to in part (g) tell you about how well this model fits that data. i) Test the overall utility of the model. What does the p-value of the test statistic tell you? 36. Explain why a 95% confidence interval estimate for the mean value of y at a particular x is narrower than a 95% confidence interval for an individual y value at the same value of x. 37. If R^2=0.95, n=11, and ∑▒〖〖(Y-Y ̅)〗^2=100,〗 what is S_e^2? 38. You are given the following information from fitting a multiple regression with three variables to 30 sample data points: b_1=1.3 b_2=10.0 b_3=25.2 S_(b_1 )=0.3 S_(b_2 )=2.0 S_(b_3 )=15.0 Test the following hypotheses, Use α=0.05 a) β_1=0 b) β_2=0 a) β_3=0 28) from #13 on page 9-20 A bath soap manufacturing process is designed to produce a mean of 120 bars of soap per batch. Quantities over or under the standard are undesirable. A sample of ten batches shows the following number bars of soap. 108 118 120 122 119 113 124 122 120 123 Using a 0.05 level of significance, test to see whether the sample results indicate that the manufacturing process is functioning properly. 29) from #7 on page 9-36 Consider the following hypothesis test. H0: µ1- µ2=0 Ha: µ1- µ2 ≠0 n1=64 x1=5.6 s1=48 n2=38 x2=6.9 s2=17 33) from #5 on 15-9 A large hotel purchased 200 brand new color televisions several months ago: 80 of one brand and 60 each of two other brands. Records were kept for each set as to how many service calls were required, resulting in the table that follows. [Show More]
Last updated: 1 year ago
Preview 1 out of 20 pages
Instant download
Buy this document to get the full access instantly
Instant Download Access after purchase
Add to cartInstant download
Reviews( 0 )
Document information
Connected school, study & course
About the document
Uploaded On
Mar 04, 2020
Number of pages
20
Written in

Additional information
This document has been written for:
Uploaded
Mar 04, 2020
Downloads
0
Views
89

.png)