Mathematics > Lab Experiment > MATH 399N Week 2 Lab (All)
MATH 399N Week 2 Lab
Document Content and Description Below
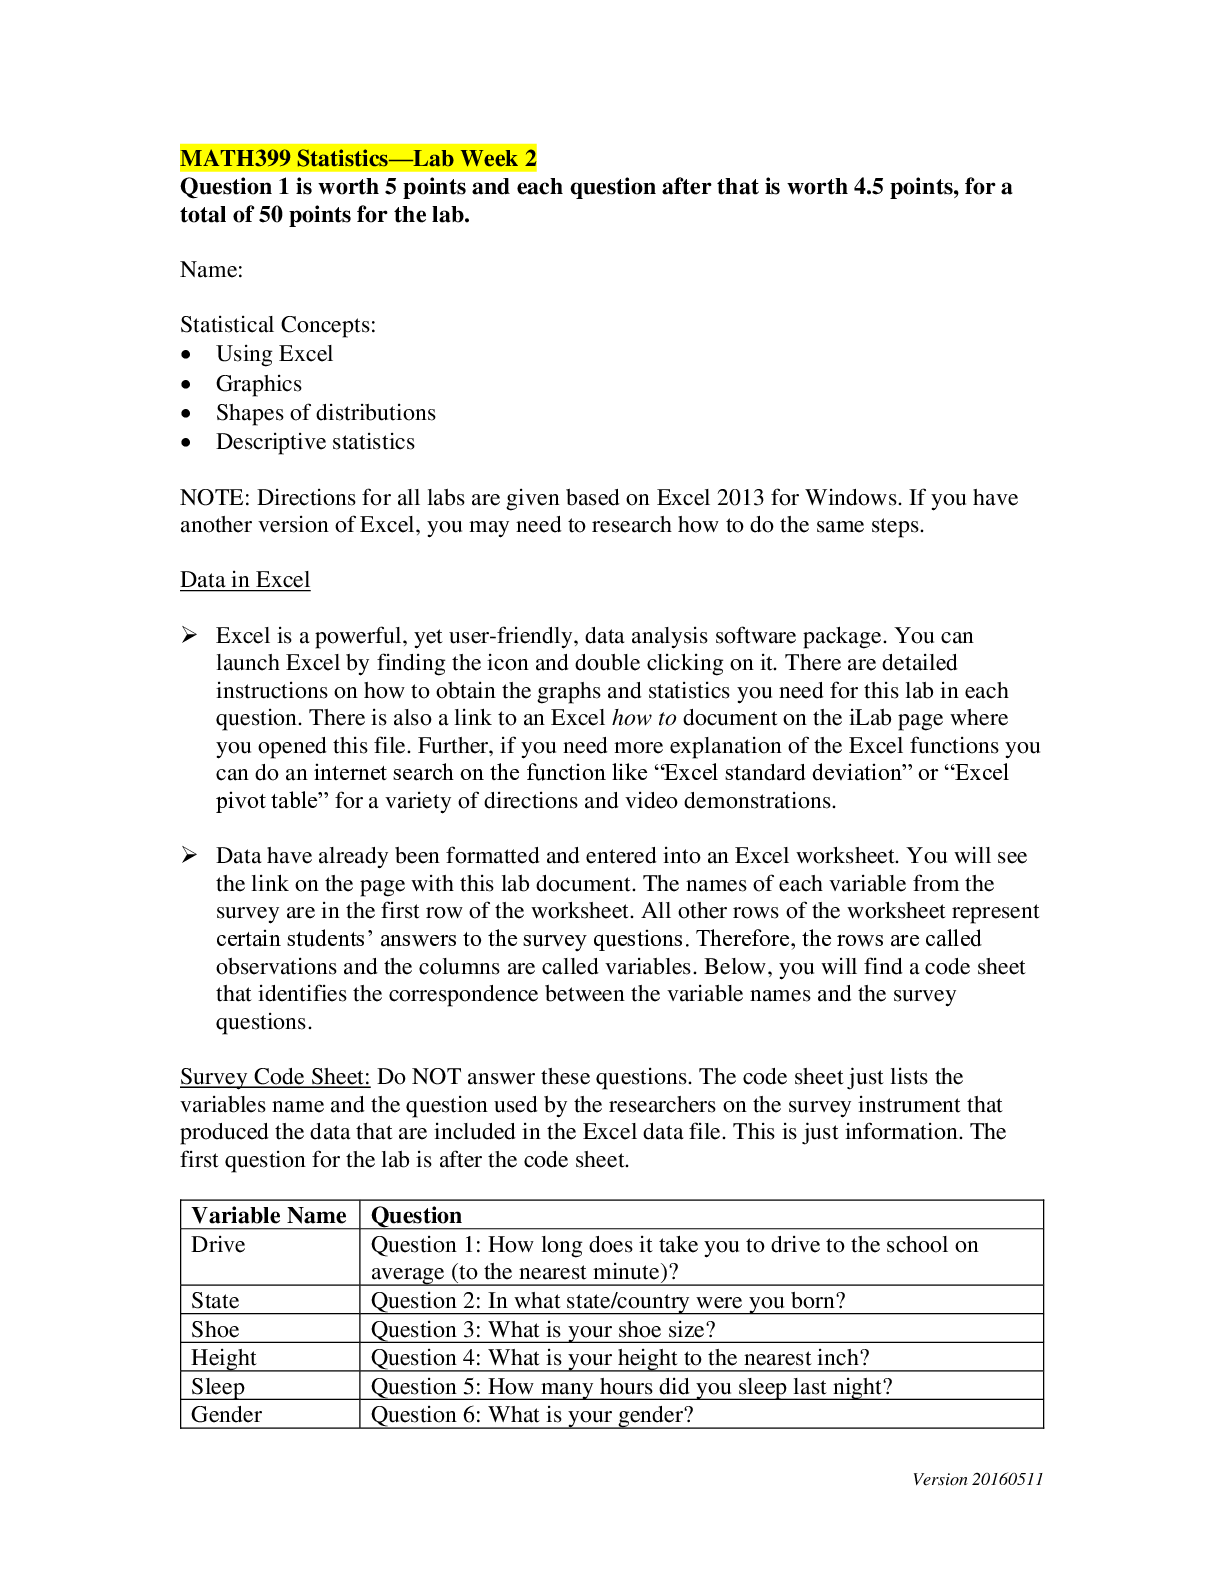
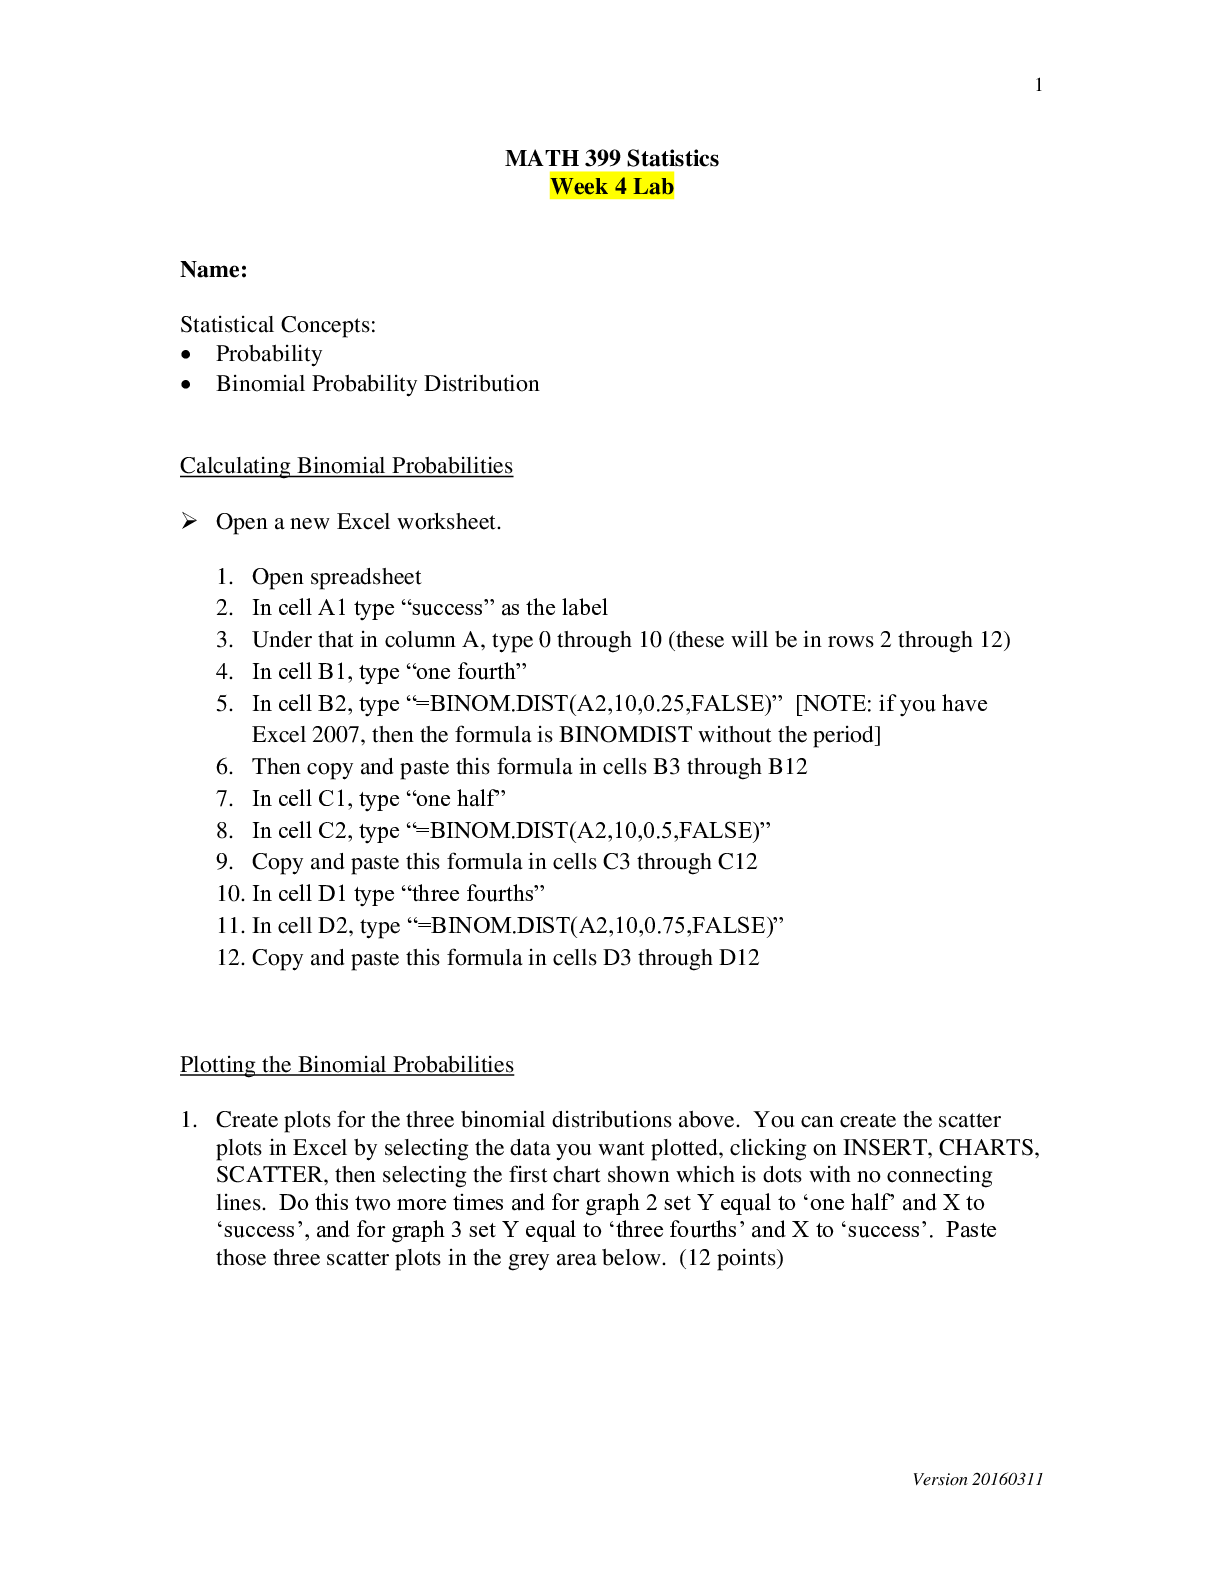
MATH 399N Week 2 Lab Name: Statistical Concepts: • Using Excel • Graphics • Shapes of distributions • Descriptive statistics NOTE: Directions for all labs are given based on Excel ... 2013 for Windows. If you have another version of Excel, you may need to research how to do the same steps. Data in Excel Excel is a powerful, yet user-friendly, data analysis software package. You can launch Excel by finding the icon and double clicking on it. There are detailed instructions on how to obtain the graphs and statistics you need for this lab in each question. There is also a link to an Excel how to document on the iLab page where you opened this file. Further, if you need more explanation of the Excel functions you can do an internet search on the function like “Excel standard deviation” or “Excel pivot table” for a variety of directions and video demonstrations. Data have already been formatted and entered into an Excel worksheet. You will see the link on the page with this lab document. The names of each variable from the survey are in the first row of the worksheet. All other rows of the worksheet represent certain students’ answers to the survey questions. Therefore, the rows are called observations and the columns are called variables. Below, you will find a code sheet that identifies the correspondence between the variable names and the survey questions. Survey Code Sheet: Do NOT answer these questions. The code sheet just lists the variables name and the question used by the researchers on the survey instrument that produced the data that are included in the Excel data file. This is just information. The first question for the lab is after the code sheet. Variable Name Question Drive Question 1: How long does it take you to drive to the school on average (to the nearest minute)? State Question 2: In what state/country were you born? Shoe Question 3: What is your shoe size? Height Question 4: What is your height to the nearest inch? Sleep Question 5: How many hours did you sleep last night? Gender Question 6: What is your gender? Car Question 7: What color of car do you drive? TV Question 8: How long (on average) do you spend a day watching TV? Money Question 9: How much money do you have with you right now? Coin Question 10: Flip a coin 10 times. How many times did you get tails? Frequency Distributions 1. Create a frequency table for the variable State. In the Excel file, you can click on Data and then Sort and choose State as the variable on which to sort. Once sorted, you can count how many students are from each state. From that table, use a calculator to determine the relative percentages, as well as the cumulative percentages. In the box below, type the states from the database in a column to the left, then type the counts, and relative and cumulative frequencies to the right of the respective state. Using the data in the table, make a statement about what the frequency counts or percentages tell about the data. Frequency table results for State: Count = 35 State Frequency Relative Frequency .. .. .. …. .. ………… Cumulative Relative Frequency CA 4 0.11428571 0.11428571 FL 3 0.085714286 0.2 GA 1 0.028571429 0.22857143 IL 2 0.057142857 0.28571429 KY 1 0.028571429 . 0.31428571 MI 7 0.2 0.51428571 NV 1 0.028571429 0.54285714 NY 3 0.085714286 0.62857143 OH 1 0.028571429 0.65714286 OR 3 0.085714286 0.74285714 PA 4 0.11428571 0.85714286 SC 2 0.057142857 0.91428571 TX 3 0.085714286 1 The data show that most students were born in the state of Michigan. The States of Georgia, Nevada, Kentucky, and Ohio have the least students born there with one each. ......SAMPLE.... [Show More]
Last updated: 1 year ago
Preview 1 out of 8 pages
Also available in bundle (1)

MATH 399N Statistics Lab 2,4,6
MATH 399N Statistics Lab 2,4,6
By YourTutor 3 years ago
$20.5
3
Reviews( 0 )
Document information
Connected school, study & course
About the document
Uploaded On
Feb 22, 2021
Number of pages
8
Written in

Additional information
This document has been written for:
Uploaded
Feb 22, 2021
Downloads
0
Views
61


.png)