Statistics > EXAM > MATH 225N Week 2 Statistics Quiz 2020 | MATH225N Week 2 Statistics Quiz _ Graded A (All)
MATH 225N Week 2 Statistics Quiz 2020 | MATH225N Week 2 Statistics Quiz _ Graded A
Document Content and Description Below
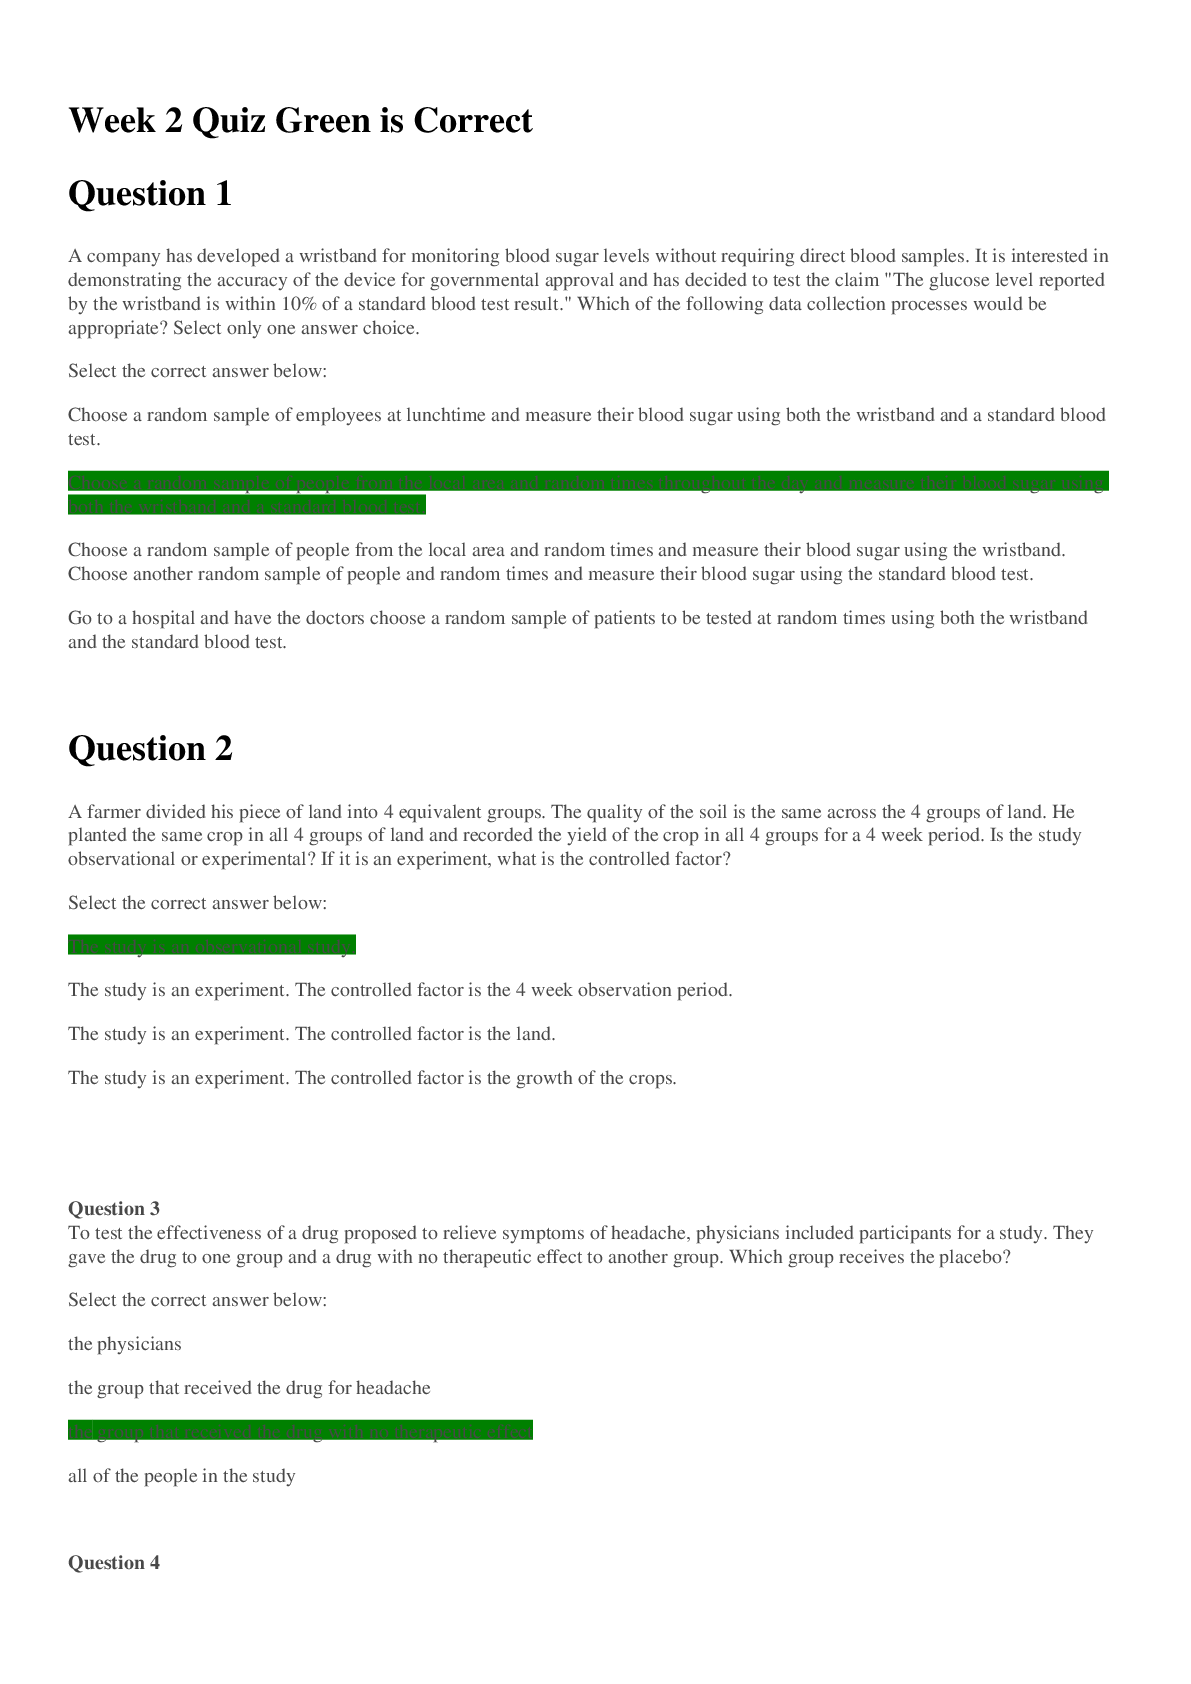
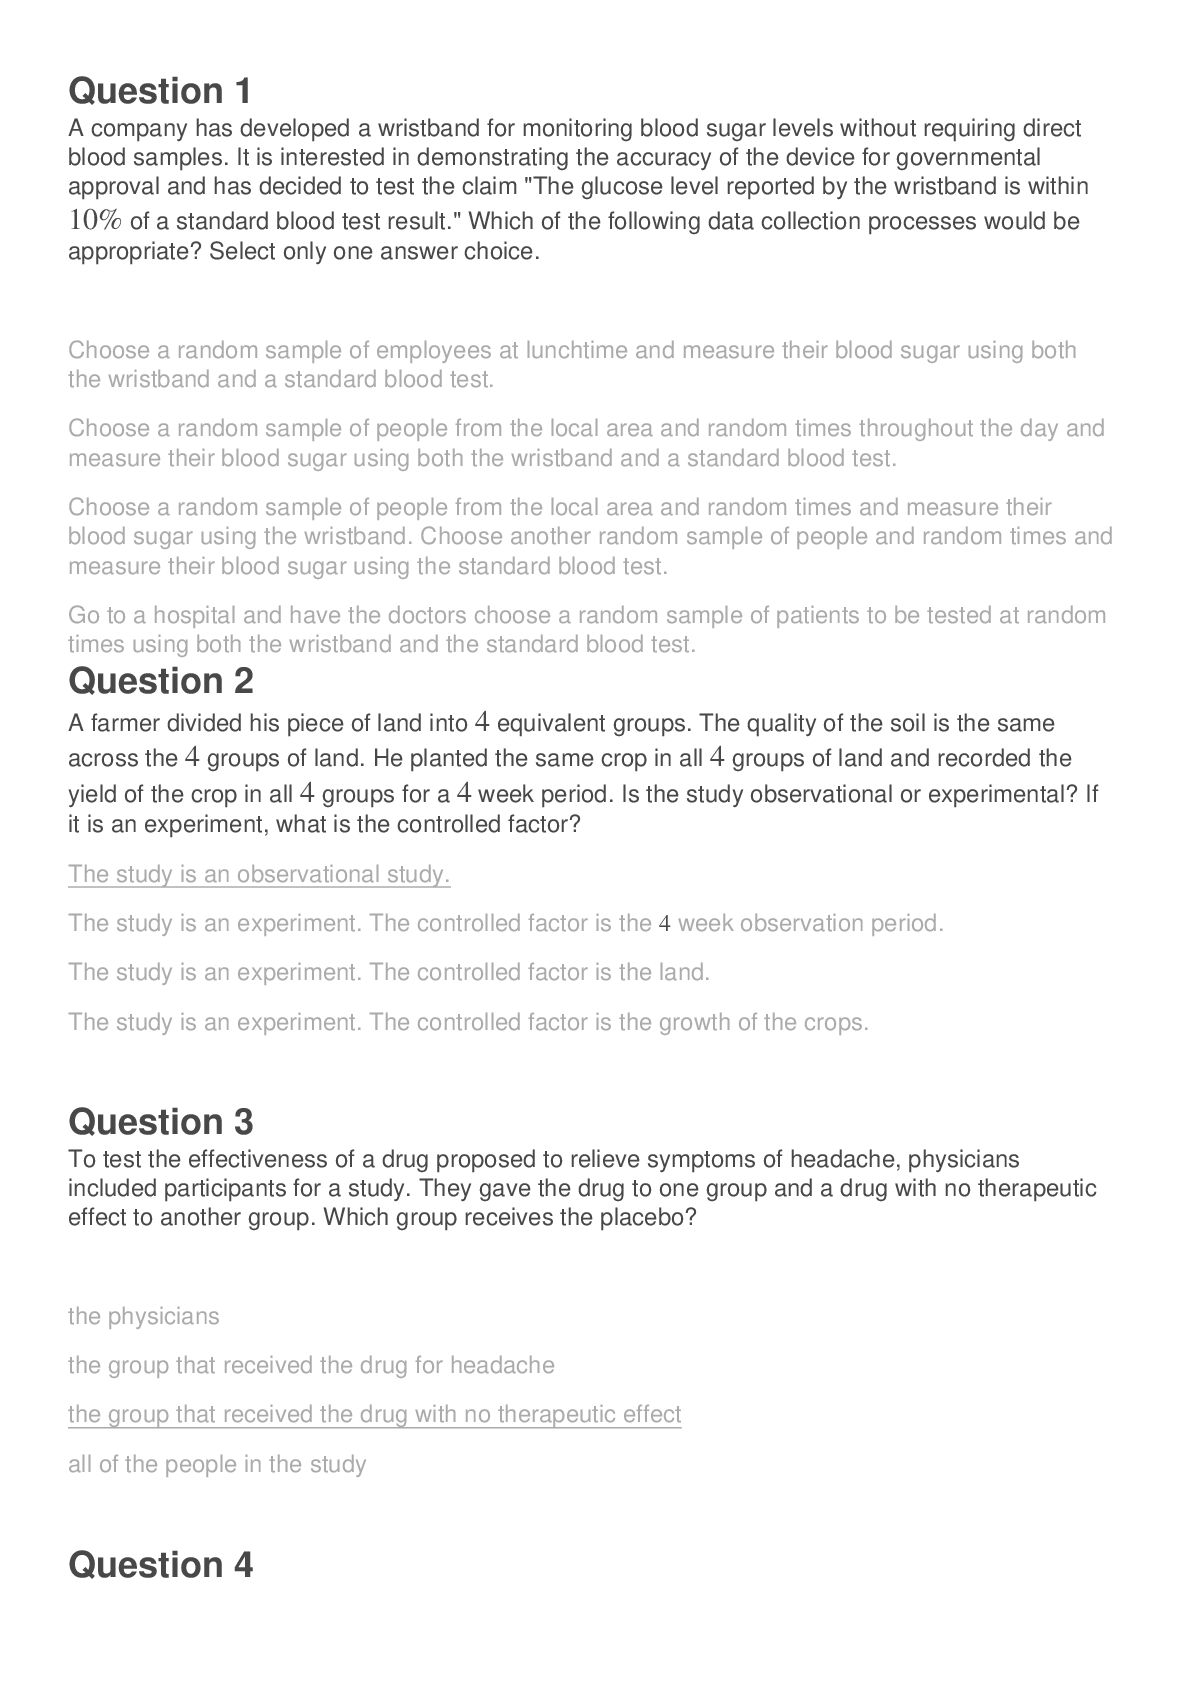
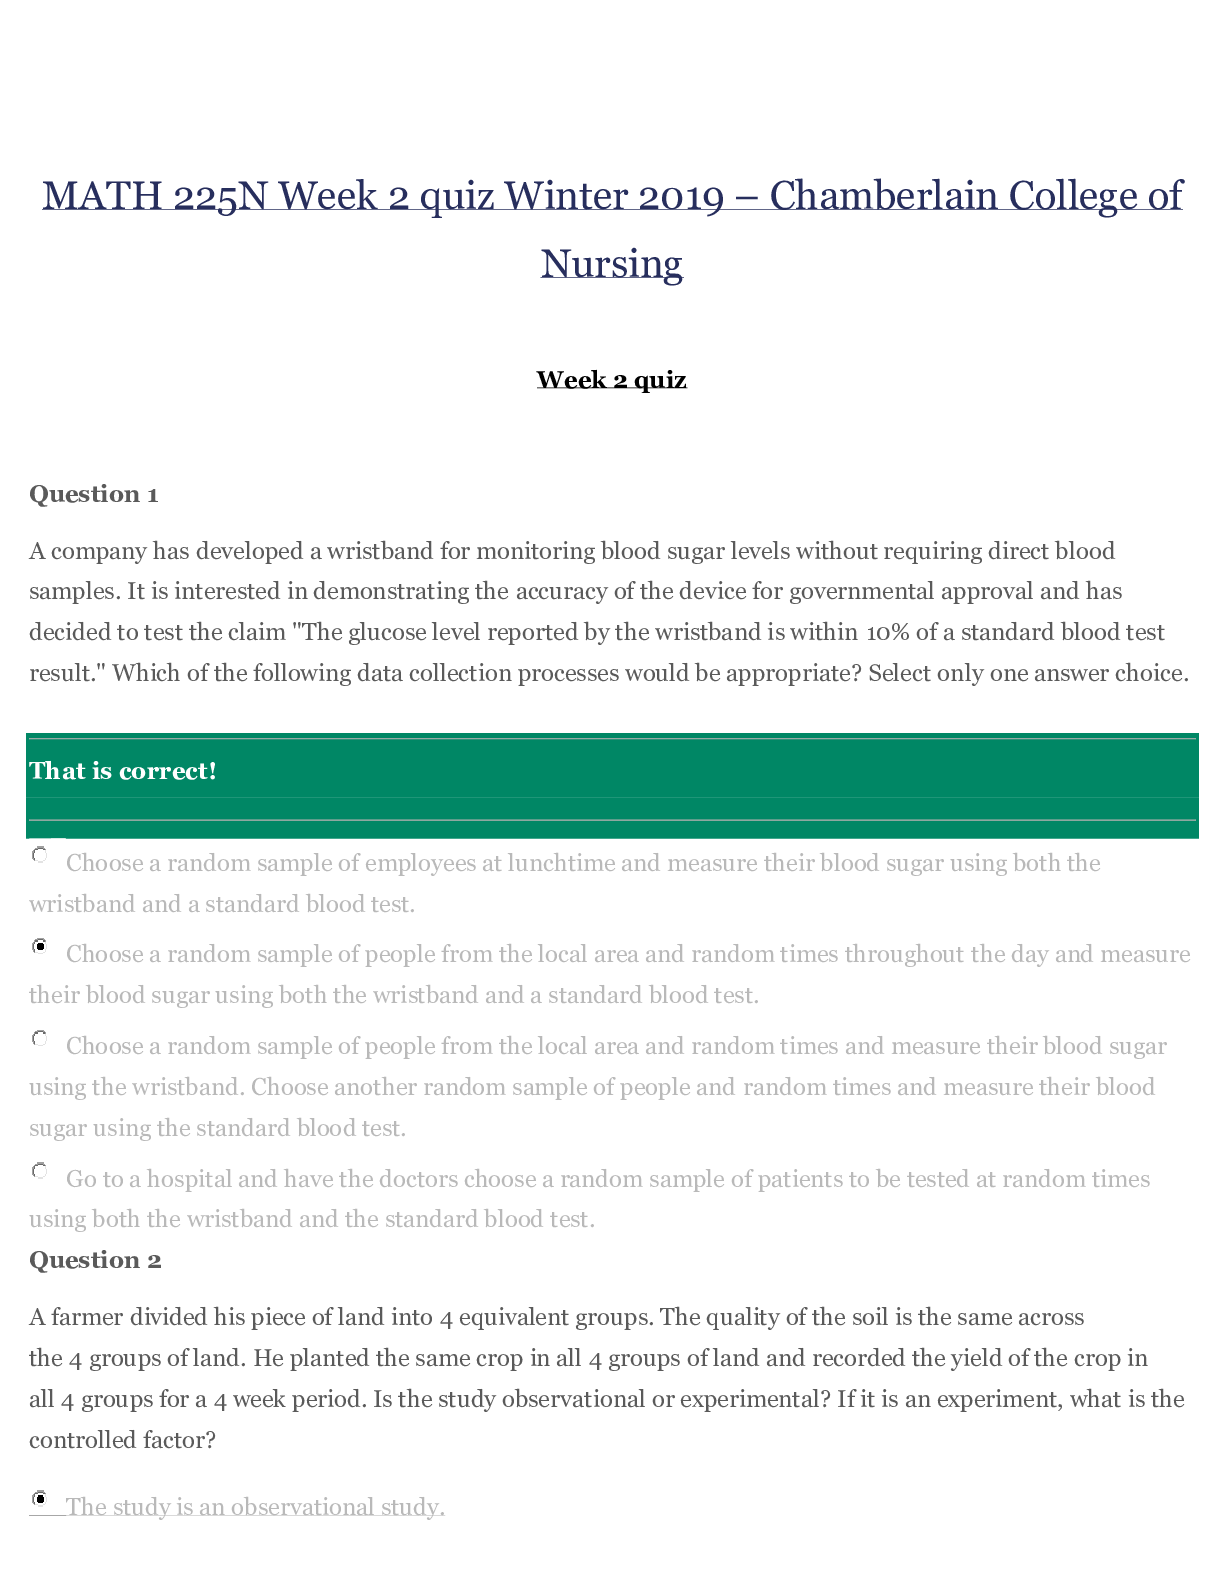
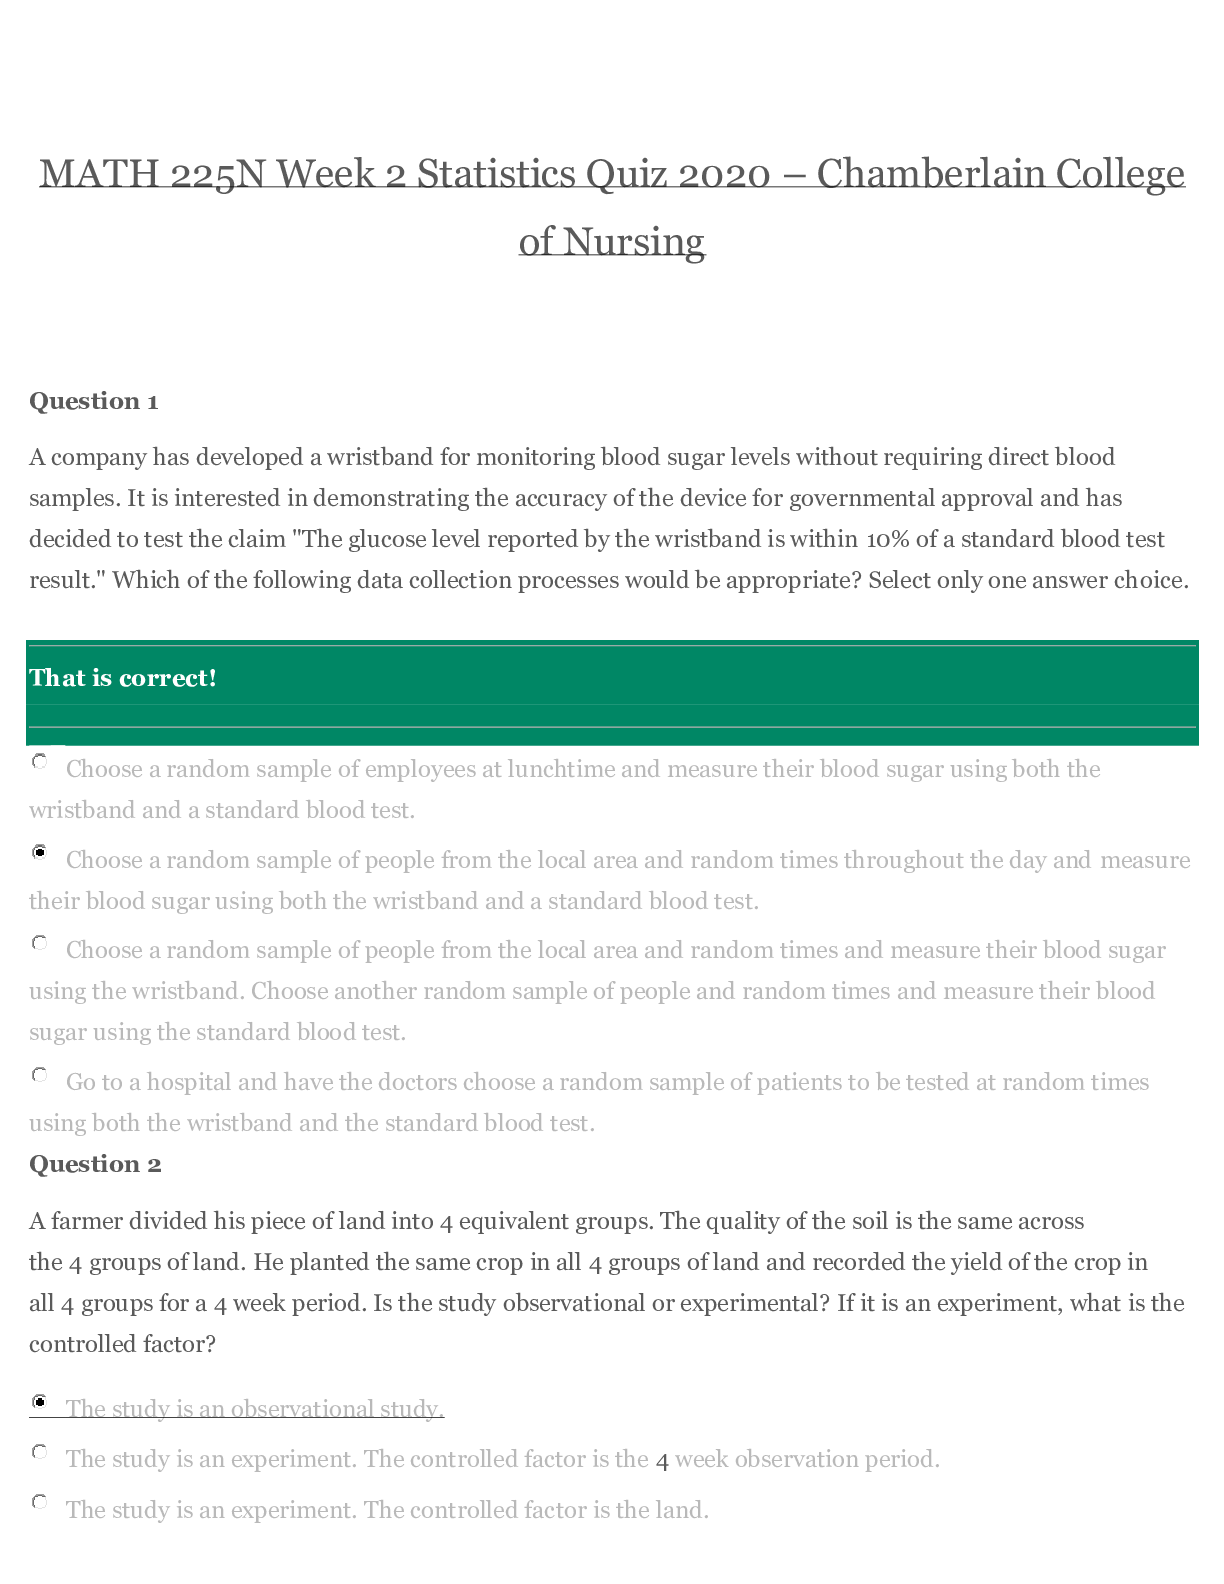
MATH 225N Week 2 Statistics Quiz 2020 – Chamberlain College of Nursing Question 1 A company has developed a wristband for monitoring blood sugar levels without requiring direct blood samples. It... is interested in demonstrating the accuracy of the device for governmental approval and has decided to test the claim "The glucose level reported by the wristband is within 10% of a standard blood test result." Which of the following data collection processes would be appropriate? Select only one answer choice. That is correct! Choose a random sample of employees at lunchtime and measure their blood sugar using both the wristband and a standard blood test. Choose a random sample of people from the local area and random times throughout the day and measure their blood sugar using both the wristband and a standard blood test. Choose a random sample of people from the local area and random times and measure their blood sugar using the wristband. Choose another random sample of people and random times and measure their blood sugar using the standard blood test. Go to a hospital and have the doctors choose a random sample of patients to be tested at random times using both the wristband and the standard blood test. Question 2 A farmer divided his piece of land into 4 equivalent groups. The quality of the soil is the same across the 4 groups of land. He planted the same crop in all 4 groups of land and recorded the yield of the crop in all 4 groups for a 4 week period. Is the study observational or experimental? If it is an experiment, what is the controlled factor? The study is an observational study. The study is an experiment. The controlled factor is the 4 week observation period. The study is an experiment. The controlled factor is the land.The study is an experiment. The controlled factor is the growth of the crops. Question 3 To test the effectiveness of a drug proposed to relieve symptoms of headache, physicians included participants for a study. They gave the drug to one group and a drug with no therapeutic effect to another group. Which group receives the placebo? That is correct! the physicians the group that received the drug for headache the group that received the drug with no therapeutic effect all of the people in the study Question 4 Matthew has created a survey to test whether or not gender has any effect on political party associations. What is the explanatory variable in this situation? That is correct! the number of people surveyed political party associations gender none of the above Question 5 Is the statement below true or false? Continuous data are the type of quantitative data that is the result of measuring. That is correct!True False Question 6 A doctor notes her patient's temperature in degrees Fahrenheit every hour to make sure the patient does not get a fever. What is the level of measurement of the data? That is correct! nominal ordinal interval ratio Question 7 Karen wants to estimate the mean number of siblings for each student in her school. She records the number of siblings for each of 200 randomly selected students in the school. What is the sample? That is correct! the 200 randomly selected students the specific number of siblings for each randomly selected student all the students in the school the mean number of siblings for the randomly selected students the mean number of siblings for all students in the school Question 8 True or False? In reference to different sampling methods, systematic sampling includes the steps: divide the population into groups; use simple random sampling to identify a proportionate number of individuals from each group.That is correct! True False Question 9 While standing on a highway overpass, Jennifer wonders what proportion of the vehicles that pass on the highway below are trucks. The highway has 4 lanes running in each direction. Jennifer is only interested in the proportion of vehicles that pass over the course of the hour that she spends there. Which of the following sampling methods would be best for Jennifer to employ? Obtain a cluster sample by randomly selecting 3 of the 36 numbers and letters that might be at the beginning of a license plate, and select every vehicle whose license plate starts with one of those 3 numbers or letters. Obtain a convenience sample by watching 1 lane and selecting every vehicle that passes in that lane. Obtain a systematic sample by selecting every 20th vehicle that passes (in any lane and going in any direction). Obtain a stratified sample by, during every minute, spending 712 second watching each of the 8 lanes and selecting the last vehicle that passes during the time it is being watched (or the first vehicle after that time if no cars pass during that time). Question 10 As a member of a marketing team, you have been tasked with determining the number of DVDs that people have rented over the past six months. You sample twenty adults and decide that the best display of data is a frequency table for grouped data. Construct this table using four classes. 15,30,28,19,14,18,28,19,10,19,10,24,14,18,24,27,10,18,16,23 orrect answers: • 1$10$10 • 2$15$15 • 3$6$6 • 4$16$16 • 5$21$21• 6$7$7 • 7$22$22 • 8$27$27 • 9$4$4 • 10$28$28 • 11$33$33 • 12$3$3 Note that the data is not ordered and that we have been asked to use 4 classes. To determine the class width, use the formula: Max Value−Min ValueNumber of Classes=30−104=5. Since this value is an integer, there is no need to round. Use the minimum value, 10, for the lower class limit of the first class. To find all other lower class limits, add the class width, 5, plus 1. For example, the second lower class limit would be: 10+5+1=16. Lower Class Limit Upper Class Limit Frequency 10 16 22 28 To find the upper class limits, add the class width, 5, to each lower class limit. For example, the upper class limit of the first class would be: 10+5=15. Lower Class Limit Upper Class Limit Frequency 10 15 16 21 22 27 28 33To find the frequency for each class, count the number of data values that fall within the range of each class. For example, the data values 15, 14, 10, 10, 14, and 10 fall within the range of the first class, 10-15. So, the frequency of this class is 6. Lower Class Limit Upper Class Limit Frequency 10 15 6 16 21 7 22 27 4 28 33 3 Answer: 1=10, 2=15, 3=6, 4=16, 5=21, 6=7, 7=22, 8=27, 9=4, 10=28, 11=33, 12=3 [Show More]
Last updated: 1 year ago
Preview 1 out of 16 pages
Instant download
Buy this document to get the full access instantly
Instant Download Access after purchase
Add to cartInstant download
Reviews( 0 )
Document information
Connected school, study & course
About the document
Uploaded On
Mar 18, 2021
Number of pages
16
Written in

Additional information
This document has been written for:
Uploaded
Mar 18, 2021
Downloads
0
Views
51