Mathematics > QUESTIONS & ANSWERS > MATH 225N Week 8 Assignment: Correlation Questions-Answers (Summer 2020) Chamberlain. (All)
MATH 225N Week 8 Assignment: Correlation Questions-Answers (Summer 2020) Chamberlain.
Document Content and Description Below
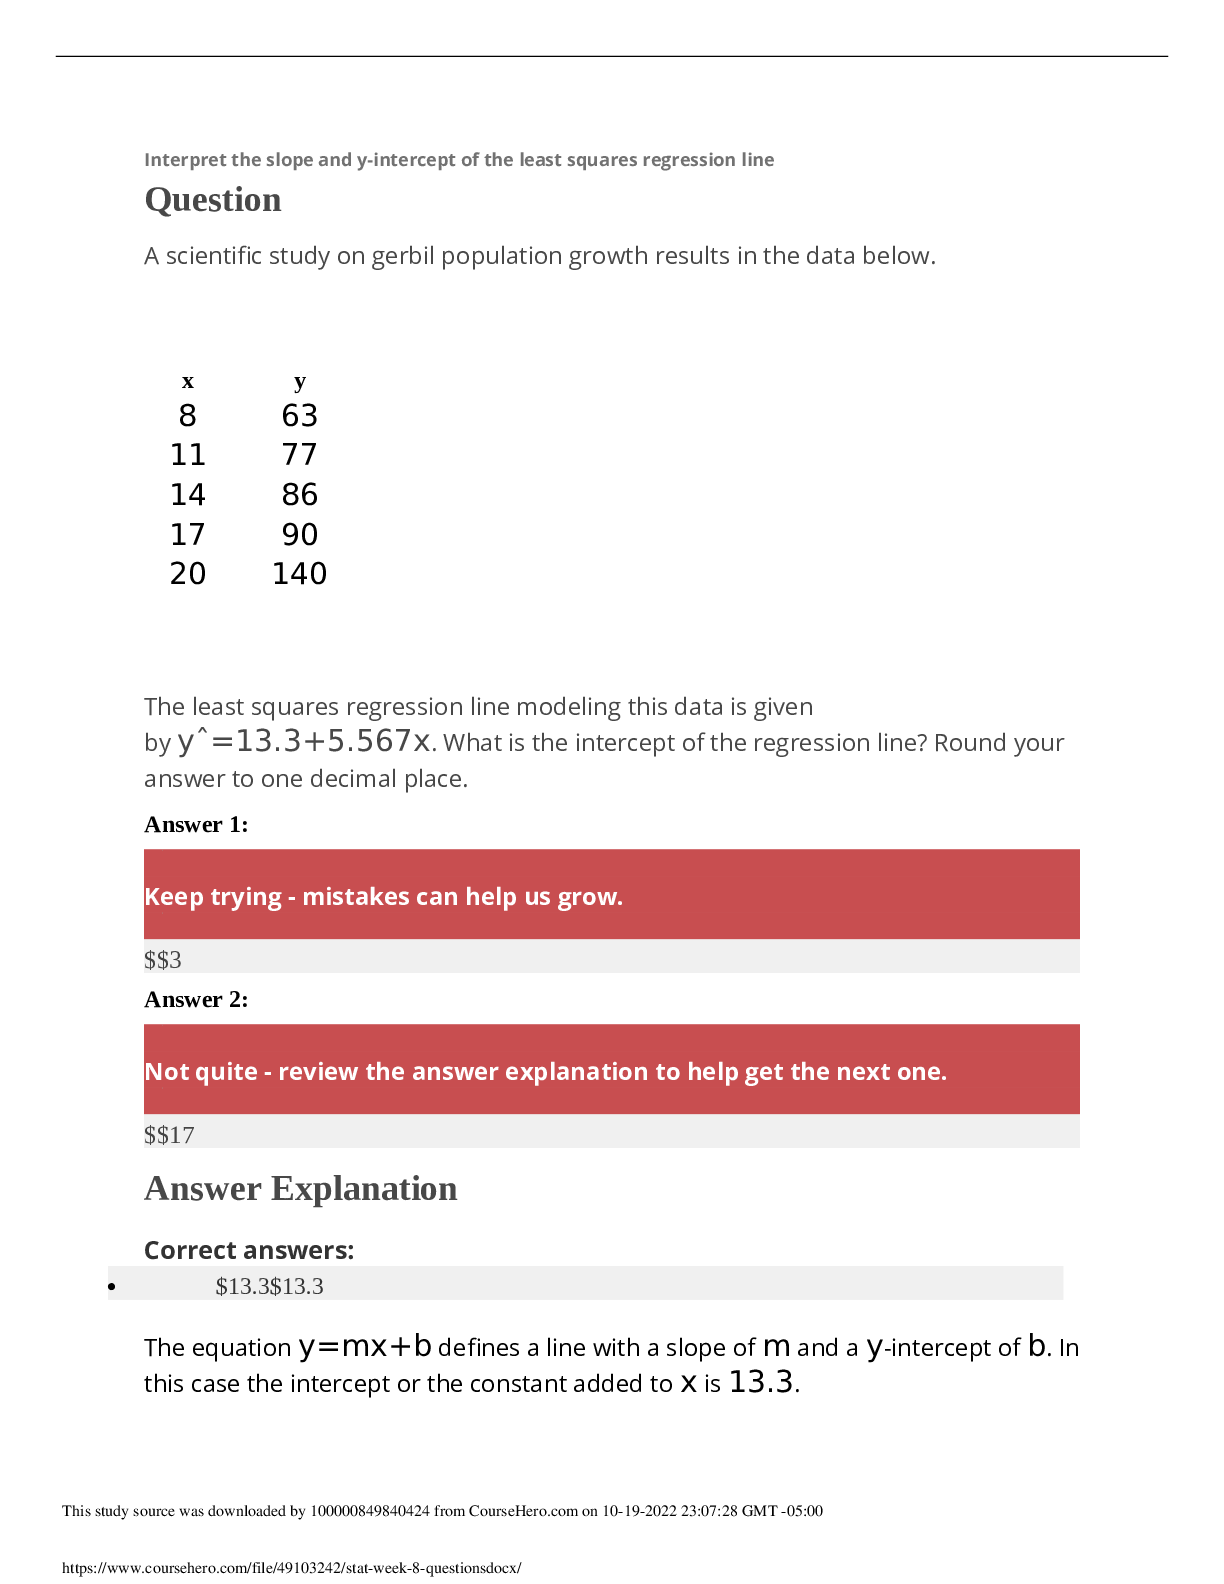
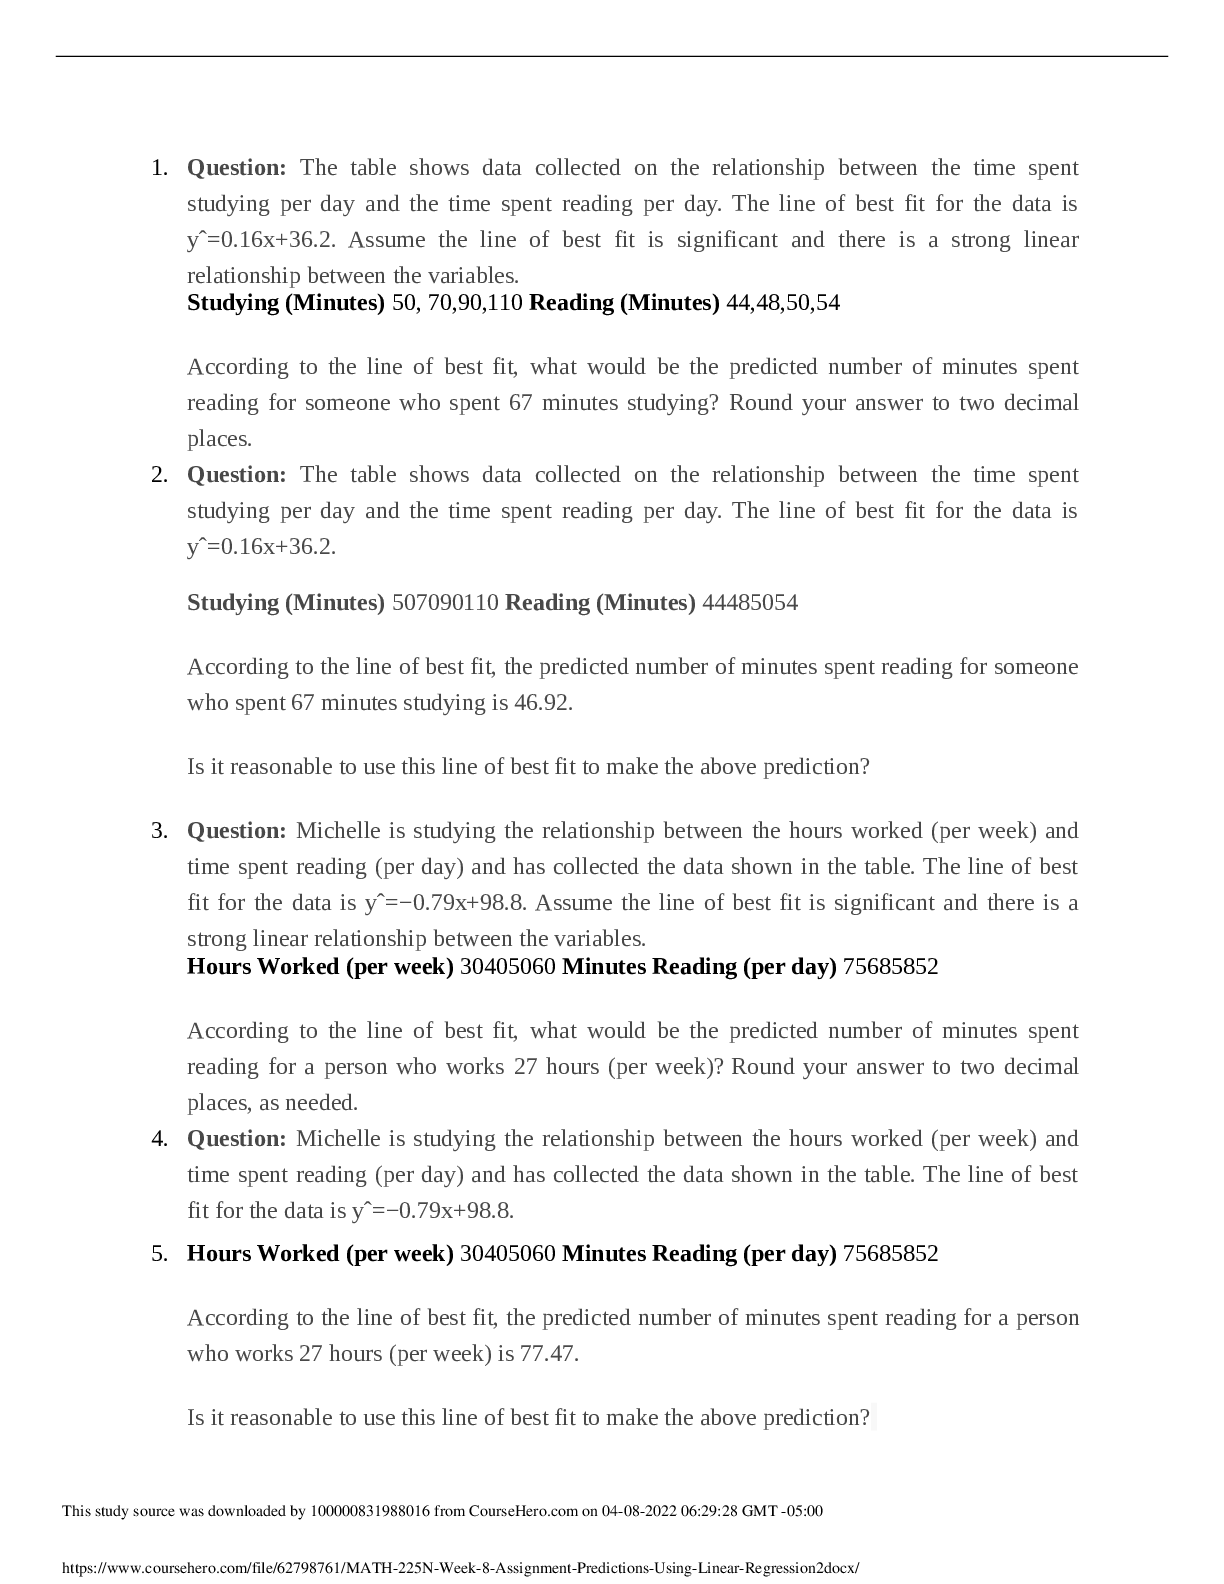
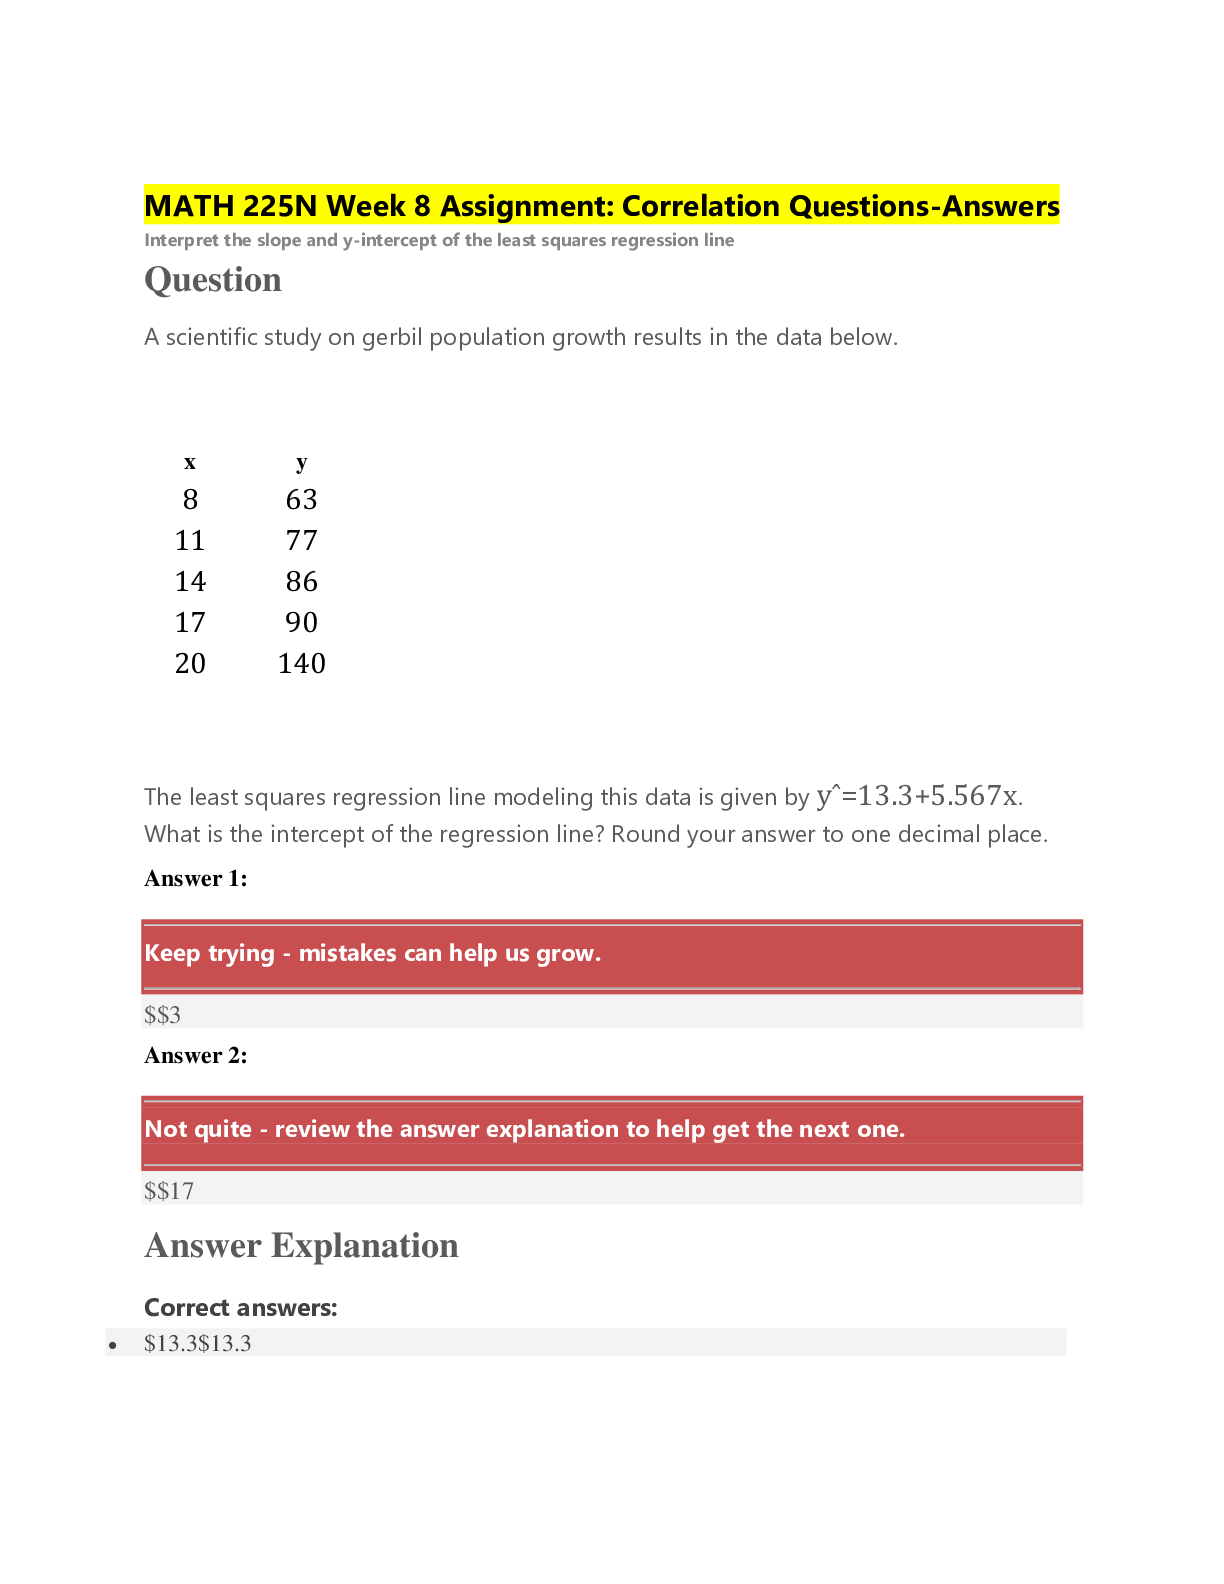
MATH 225N Week 8 Assignment: Correlation Questions-Answers 1. Question: A scientific study on gerbil population growth results in the data below…. The least squares regression line modeling this d... ata is given by yˆ=13.3+5.567x. What is the slope of the regression line? Round your answer to three decimal places. 2. Question: The scatter plot below shows data for the average cost of a high-end computer (y, in dollars) in the year xyears since 2000. The least squares regression line is given by yˆ=−1677+314x….. A plot of time versus the price of a best-selling model of television has horizontal units of years since 2000 and vertical units of dollars. The best fit line of the data are defined by the equation y=−75x+550, where x=year and y=price…… What are the units of the slope? 3. Question: Which of the following data sets or plots could have a regression line with a negative slope? Select all that apply. 4. Question: Which of the following data sets or plots could have a regression line with a negative y-intercept? ________________________________________ 5. Question: Which of the following data sets or plots could have a regression line with a negative y-intercept? 6. Question: Which of the following data sets or plots could have a regression line with a negative slope? Select all that apply. 7. Question: The scatter plot below shows data for the average cost of a high-end computer (y, in dollars) in the year xyears since 2000. The least squares regression line is given by yˆ=−1677+314x….. A plot of time versus the price of a best-selling model of television has horizontal units of years since 2000 and vertical units of dollars. The best fit line of the data are defined by the equation y=−75x+550, where x=year and y=price…… What are the units of the slope? 8. Question: A scientific study on gerbil population growth results in the data below…. The least squares regression line modeling this data is … by yˆ=13.3+5.567x. What is the slope of the regression line? Round your answer to three decimal places. 9. Question: Which of the following data sets or plots could have a regression line with a negative y-intercept? Select all that apply. 10. Question: Which of the following data sets or plots could have a regression line with a negative slope? Select all that apply. 11. Question: The scatter plot below shows data for the cost of a diamond necklace from a department store (y, in dollars) in the year xyears since 2000. The least squares regression line is … by yˆ=1823+314x….. A coordinate system has a horizontal x-axis labeled Year from 4 to 12 in increments of 2 and a vertical y-axis labeled Cost in dollars from 0 to 2000 in increments of 500. A series of 5 plotted points follow the trend of a line segment that rises from l…. Interpret the y-intercept of the least squares regression line. 12. Question: The scatter plot below shows data for the number of sea turtles (y) tagged by scientists in a given year, where xis the year. The least squares regression line is … by yˆ=917,234−444x….. Interpret the y-intercept of the least squares regression line. 13. Question: The scatter plot below shows data for the number of sea turtles (y) observed in the wild in a given year, where xis the year. The least squares regression line is … by yˆ=917,234−444x…… Interpret the slope of the least squares regression line. ________________________________________ 14. Question: Which of the following data sets or plots could have a … line with a negative slope? Select all that apply. 15. Question: The scatter plot below shows the average cost of a designer jacket in a sample of years between 2000and 2015. The least squares … line modeling this data is … by yˆ=−4815+765x….. Interpret the slope of the least squares regression line. 16. Question: The scatter plot below shows data for the average cost of a high-end computer (y, in dollars) in the year xyears since 2000. The least squares … line is … by yˆ=−1677+314x….. Interpret the slope of the least squares regression line. 17. Question: Which of the following data sets or plots could have a regression line with a negative slope? 18. Question: A survey regarding truck engines found a positive correlation between the size of the engine and horsepower the engine produces. Answer the following question based only on this information…… True or false: It can … concluded that trucks with larger engines have greater horsepower. 19. Question: Which of the following data sets or plots could have a regression line with a negative y-intercept? Select all that apply. 20. Question: True or False: The more time it takes to travel a road, the longer the road is. 21. Question: A large observational study asks participants about caffeine consumption and sleep duration. The study finds that people with the largest caffeine intake have the shortest sleep duration…… Identify the relation between caffeine consumption and sleep duration. [Show More]
Last updated: 1 year ago
Preview 1 out of 14 pages
Buy this document to get the full access instantly
Instant Download Access after purchase
Add to cartInstant download
We Accept:

Reviews( 0 )
$18.00
Document information
Connected school, study & course
About the document
Uploaded On
Jun 22, 2020
Number of pages
14
Written in

Additional information
This document has been written for:
Uploaded
Jun 22, 2020
Downloads
0
Views
93
.png)