Statistics > EXAM > STAT 200 FINAL EXAM 2020 | STAT200 FINAL EXAM_Graded A (All)
STAT 200 FINAL EXAM 2020 | STAT200 FINAL EXAM_Graded A
Document Content and Description Below
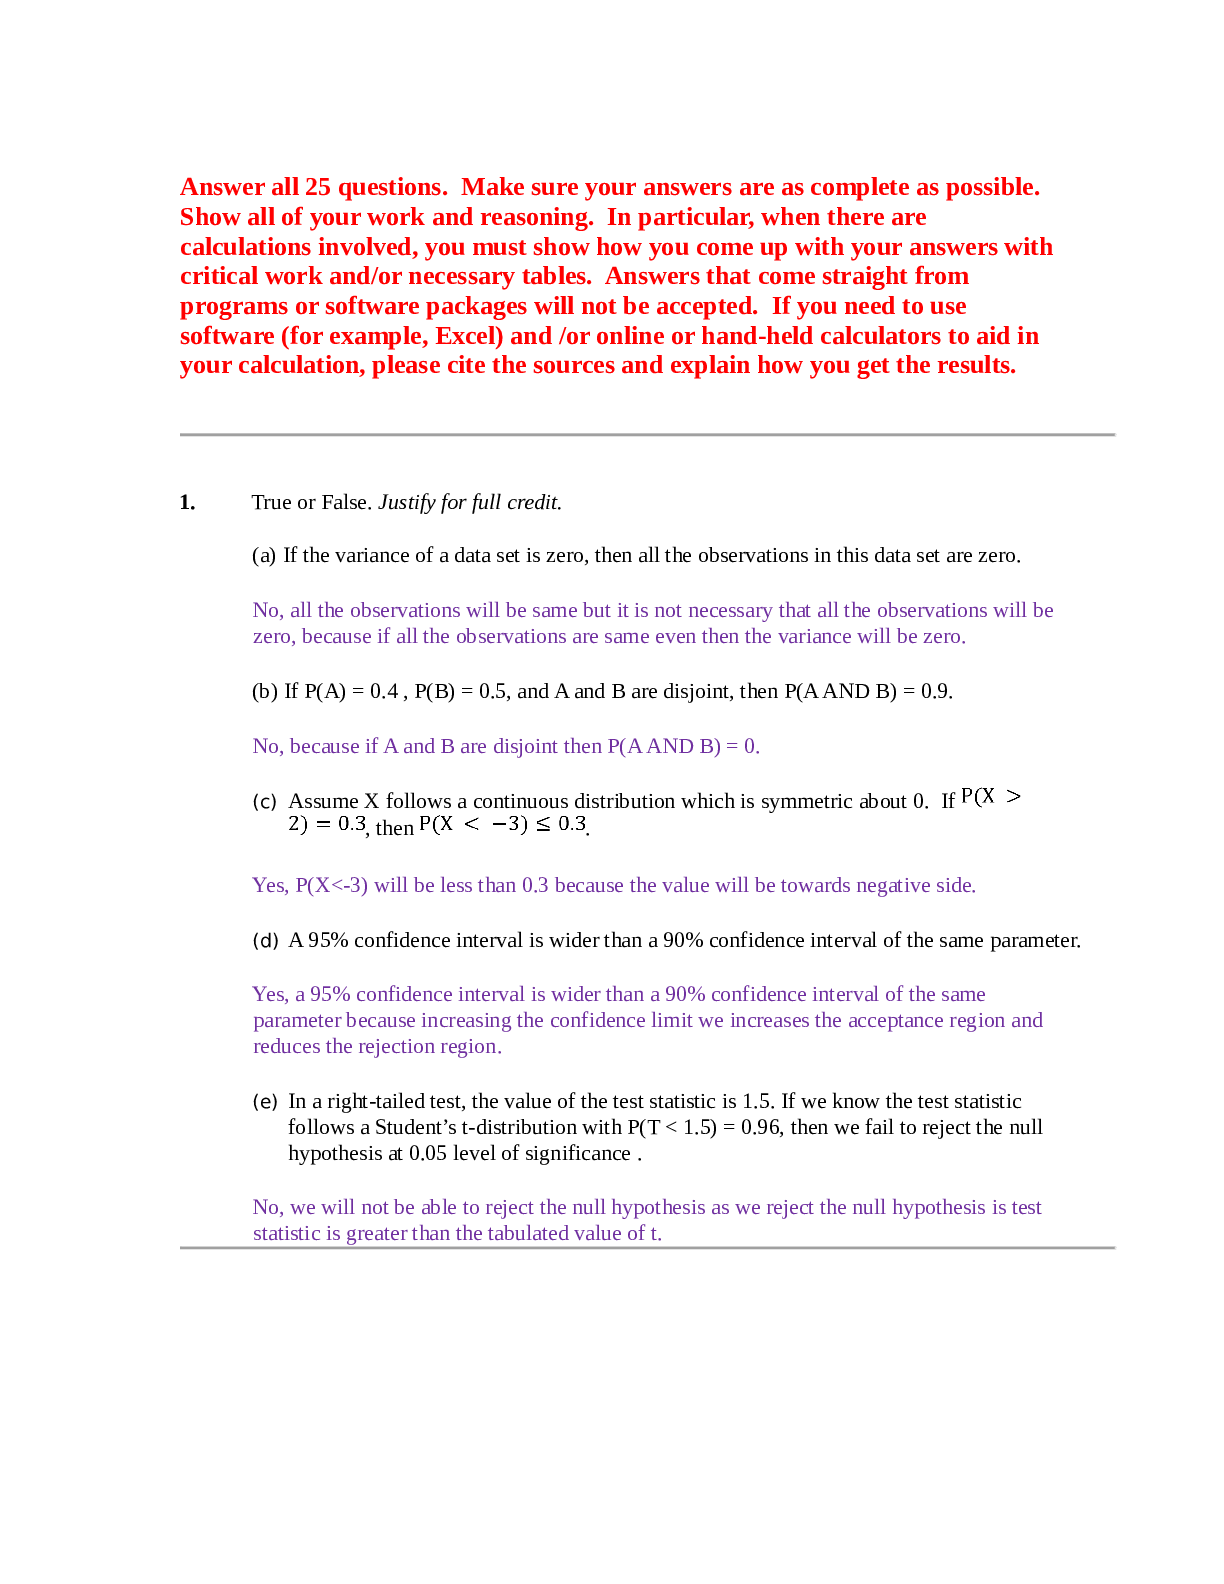
STAT 200 FINAL EXAM 2020 Answer all 25 questions. Make sure your answers are as complete as possible. Show all of your work and reasoning. In particular, when there are calculations involved, you must... show how you come up with your answers with critical work and/or necessary tables. Answers that come straight from programs or software packages will not be accepted. If you need to use software (for example, Excel) and /or online or hand-held calculators to aid in your calculation, please cite the sources and explain how you get the results. 1. True or False. Justify for full credit. (a) If the variance of a data set is zero, then all the observations in this data set are zero. No, all the observations will be same but it is not necessary that all the observations will be zero, because if all the observations are same even then the variance will be zero. (b) If P(A) = 0.4 , P(B) = 0.5, and A and B are disjoint, then P(A AND B) = 0.9. No, because if A and B are disjoint then P(A AND B) = 0. (c) Assume X follows a continuous distribution which is symmetric about 0. If , then . Yes, P(X<-3) will be less than 0.3 because the value will be towards negative side. (d) A 95% confidence interval is wider than a 90% confidence interval of the same parameter. Yes, a 95% confidence interval is wider than a 90% confidence interval of the same parameter because increasing the confidence limit we increases the acceptance region and reduces the rejection region. (e) In a right-tailed test, the value of the test statistic is 1.5. If we know the test statistic follows a Student’s t-distribution with P(T < 1.5) = 0.96, then we fail to reject the null hypothesis at 0.05 level of significance . No, we will not be able to reject the null hypothesis as we reject the null hypothesis is test statistic is greater than the tabulated value of t. Refer to the following frequency distribution for Questions 2, 3, 4, and 5. Show all work. Just the answer, without supporting work, will receive no credit. The frequency distribution below shows the distribution for checkout time (in minutes) in UMUC MiniMart between 3:00 and 4:00 PM on a Friday afternoon. Checkout Time (in minutes) Frequency Relative Frequency 1.0 - 1.9 3 2.0 - 2.9 12 3.0 - 3.9 0.20 4.0 - 4.9 3 5.0 -5.9 Total 25 2. Complete the frequency table with frequency and relative frequency. Express the relative frequency to two decimal places. Checkout Time (in minutes) Frequency Relative Frequency 1.0 - 1.9 3 0.12 2.0 - 2.9 12 0.48 3.0 - 3.9 5 0.20 4.0 - 4.9 3 0.12 5.0 -5.9 2 0.08 Total 25 1 3. What percentage of the checkout times was at least 3 minutes? Percentage of the checkout times was at least 3 minutes = (5 + 3 +2)/25*100 = 40% 4. [Show More]
Last updated: 1 year ago
Preview 1 out of 18 pages
Buy this document to get the full access instantly
Instant Download Access after purchase
Add to cartInstant download
We Accept:

Reviews( 0 )
$8.50
Document information
Connected school, study & course
About the document
Uploaded On
May 02, 2021
Number of pages
18
Written in

Additional information
This document has been written for:
Uploaded
May 02, 2021
Downloads
0
Views
32


.png)

 – Strayer University.png)
 – Strayer University.png)
.png)
