Mathematics > EXAM > MATH 225N Week 7 Assignment 2020 - Conducting a hypothesis test P-Value Approach | MATH225N Week 7 A (All)
MATH 225N Week 7 Assignment 2020 - Conducting a hypothesis test P-Value Approach | MATH225N Week 7 Assignment 2020 - Chamberlain college (A grade )
Document Content and Description Below
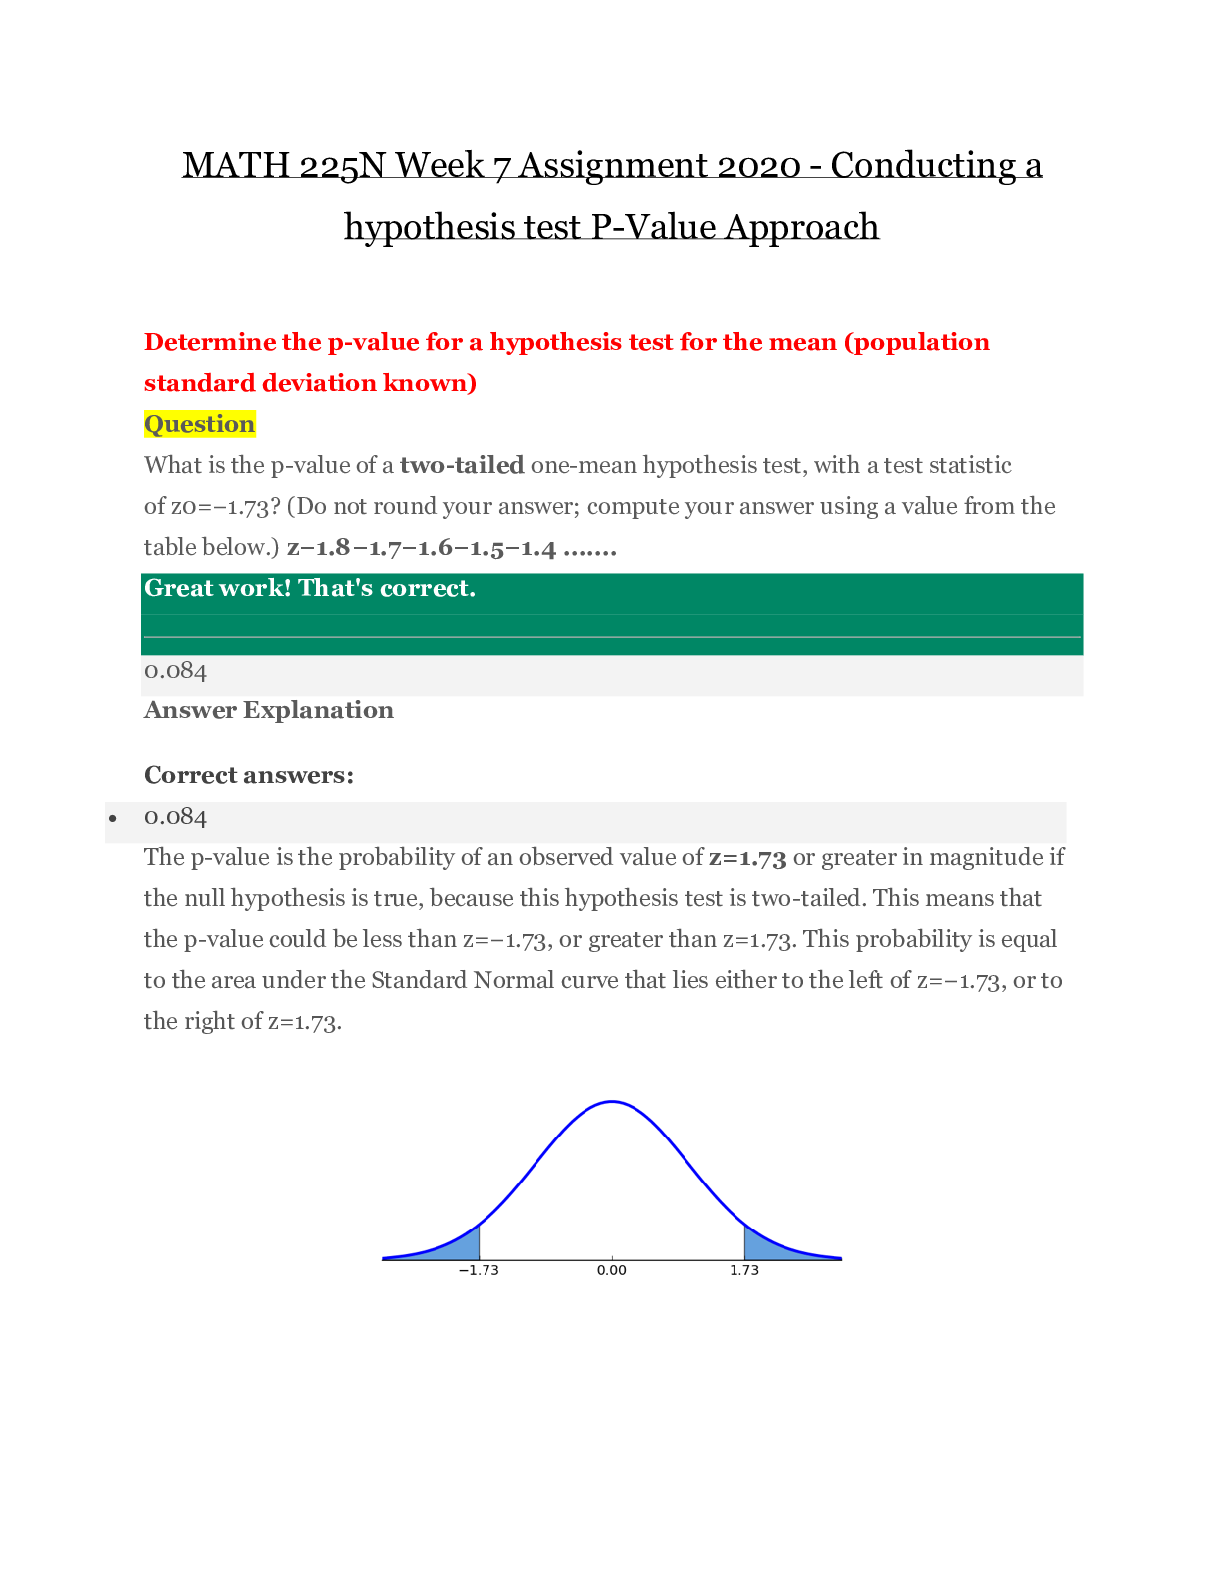
MATH 225N Week 7 Assignment 2020 - Conducting a hypothesis test P-Value Approach Determine the p-value for a hypothesis test for the mean (population standard deviation known) Question What is th... e p-value of a two-tailed one-mean hypothesis test, with a test statistic of z0=−1.73? (Do not round your answer; compute your answer using a value from the table below.) z−1.8−1.7−1.6−1.5−1.4 ....... Great work! That's correct. 0.084 Answer Explanation Correct answers: • 0.084 The p-value is the probability of an observed value of z=1.73 or greater in magnitude if the null hypothesis is true, because this hypothesis test is two-tailed. This means that the p-value could be less than z=−1.73, or greater than z=1.73. This probability is equal to the area under the Standard Normal curve that lies either to the left of z=−1.73, or to the right of z=1.73. A normal curve is over a horizontal axis and is centered on 0. Two points are labeled negative 1.73 and 1.72 The area to the right of 1.73 and to the left of negative 1.73 is shaded. Using the Standard Normal Table given, we can see that the p-value that corresponds with z=−1.73 is 0.042, which is just the area to the left of z=−1.73. Since the Standard Normal curve is symmetric, the area to the right of z=1.73 is 0.042 as well. So, the p-value of this two-tailed one-mean hypothesis test is (2)(0.042)=0.084 Make a conclusion and interpret the results of a one-mean hypothesis test (population standard deviation known) using the P-Value Approach Question Mary, a javelin thrower, claims that her average throw is 61 meters. During a practice session, Mary has a sample throw mean of 55.5 meters based on 12 throws. At the 1% significance level, does the data provide sufficient evidence to conclude that Mary's mean throw is less than 61 meters? Accept or reject the hypothesis given the sample data below. • H0:μ=61 meters; Ha:μ<61 meters • α=0.01 (significance level) • z0=−1.99 • p=0.0233 Great work! That's correct. Reject the null hypothesis because |−1.99|>0.01. Do not reject the null hypothesis because |−1.99|>0.01. Reject the null hypothesis because the p-value 0.0233 is greater than the significance level α=0.01. - - - - - - - - - - - - - - - - - - - that H0 is an incorrect belief and that the alternative hypothesis, Ha, may be correct. If α≤p-value, do not reject H0. The results of the sample data are not significant, so there is not sufficient evidence to conclude that the alternative hypothesis, Ha, may be correct. In this case, α=0.05 is less than or equal to p=0.3015, so the decision is to not reject the null hypothesis. Marie, a bowler, has a sample game score mean of 129.2 from 24 games. Marie still claims that her average game score is 143, and the low average can be attributed to chance. At the 5% significance level, does the data provide sufficient evidence to conclude that Marie's mean game score is less than 143? Given the sample data below, accept or reject the hypothesis. • H0:μ=143; Ha:μ<143 • α=0.05 (significance level) • z0=−1.07 • p=0.1423 • Accept the null hypothesis • No,at 0.05 significance level, the data does not provide sufficient evidence to conclude that Marie's mean game score is less than 143 . • Explanation: • Ho:μ=143Ha:μ<143 • values are given as , • • α=0.05 (significance level) • z-statistic =−1.07 • p-value=0.1423 • • [0.1423 > 0.05] p value is greater than alpha ,so accept the null hypothesis • No,at 0.05 significance level, the data does not provide sufficient evidence to conclude that Marie's mean game score is less than 143 . Perfect. Your hard work is paying off ?. Correct answer: Do not reject the null hypothesis because the p-value 0.1423 is greater than the significance level α=0.05. In making the decision to reject or not reject H0, if α>p-value, reject H0 because the results of the sample data are significant. There is sufficient evidence to conclude that H0 is an incorrect belief and that the alternative hypothesis, Ha, may be correct. If α≤p-value, do not reject H0. The results of the sample data are not significant, so there is not sufficient evidence to conclude that the alternative hypothesis, Ha, may be correct. In this case, α=0.05 is less than or equal to p=0.1423, so the decision is to not reject the null hypothesis. [Show More]
Last updated: 1 year ago
Preview 1 out of 12 pages
Buy this document to get the full access instantly
Instant Download Access after purchase
Add to cartInstant download
We Accept:

Reviews( 0 )
$8.50
Document information
Connected school, study & course
About the document
Uploaded On
Jul 01, 2020
Number of pages
12
Written in

Additional information
This document has been written for:
Uploaded
Jul 01, 2020
Downloads
0
Views
54