Mathematics > EXAM > Chamberlain College of Nursing – MATH 399N Week 1 Homework: ALL ANSWERS REVIEWED (All)
Chamberlain College of Nursing – MATH 399N Week 1 Homework: ALL ANSWERS REVIEWED
Document Content and Description Below
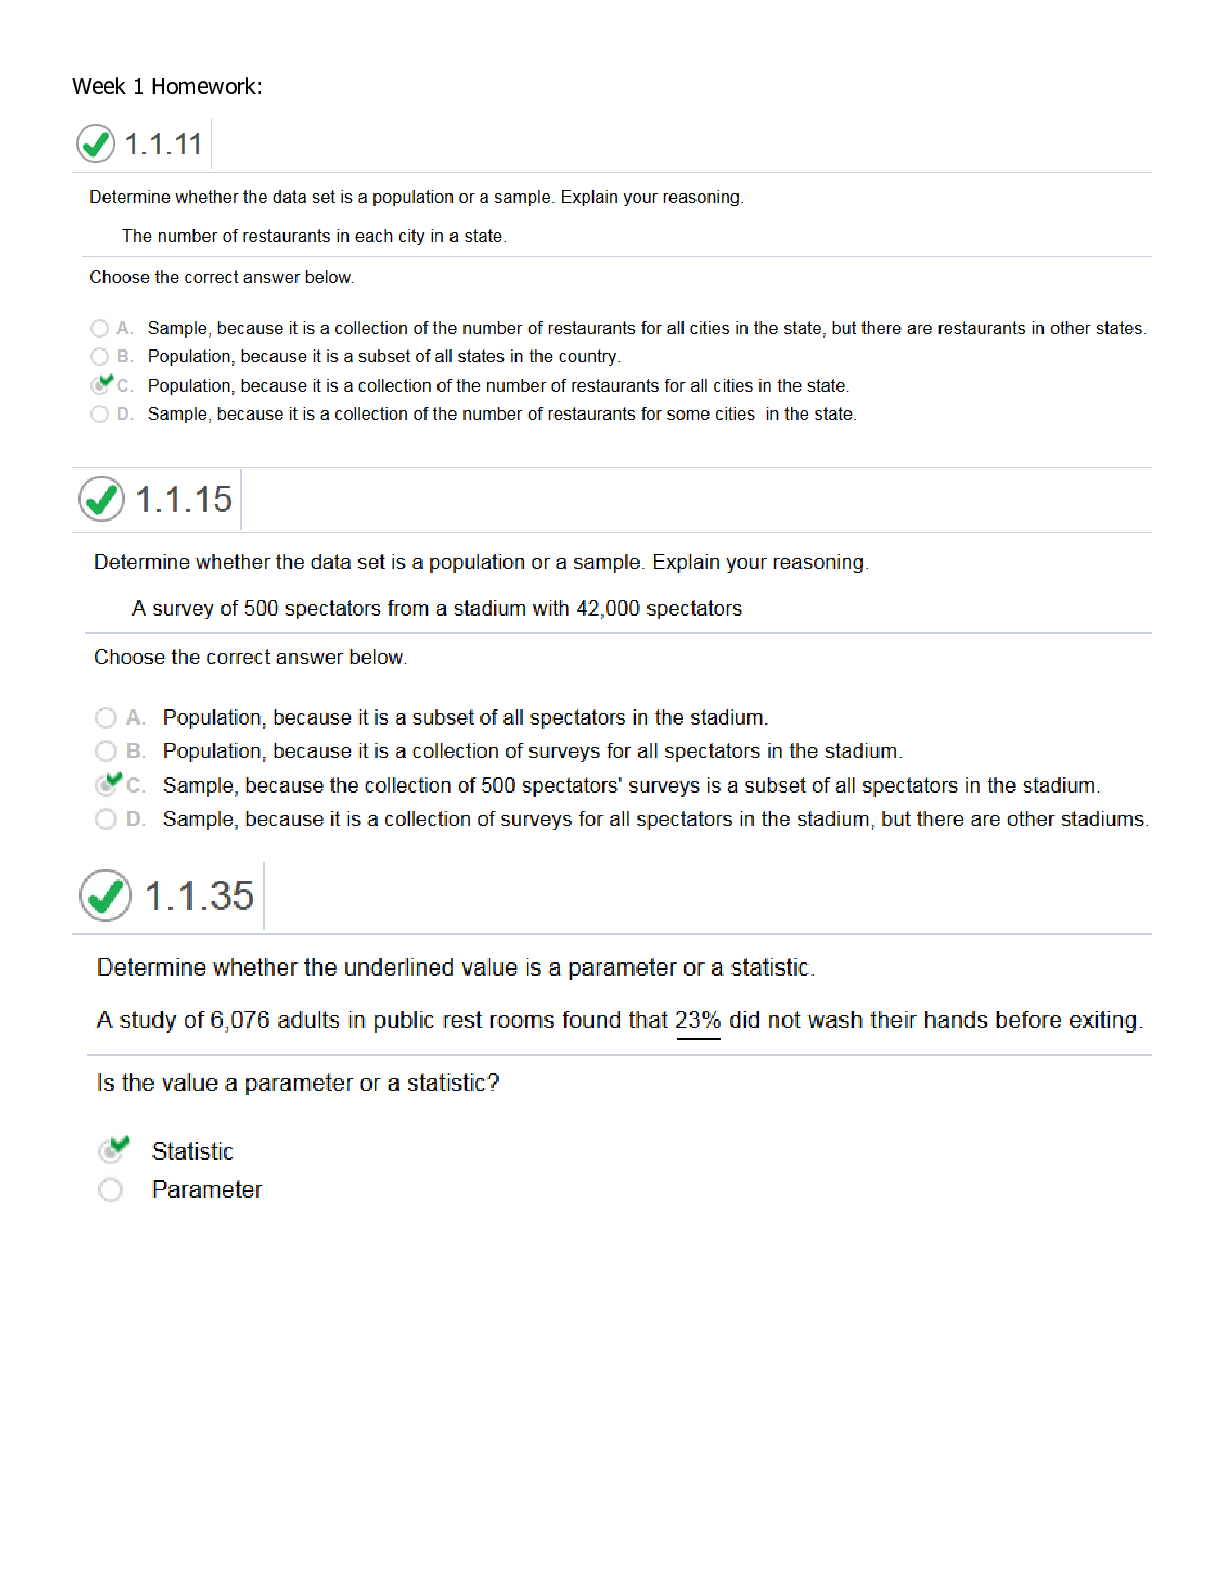
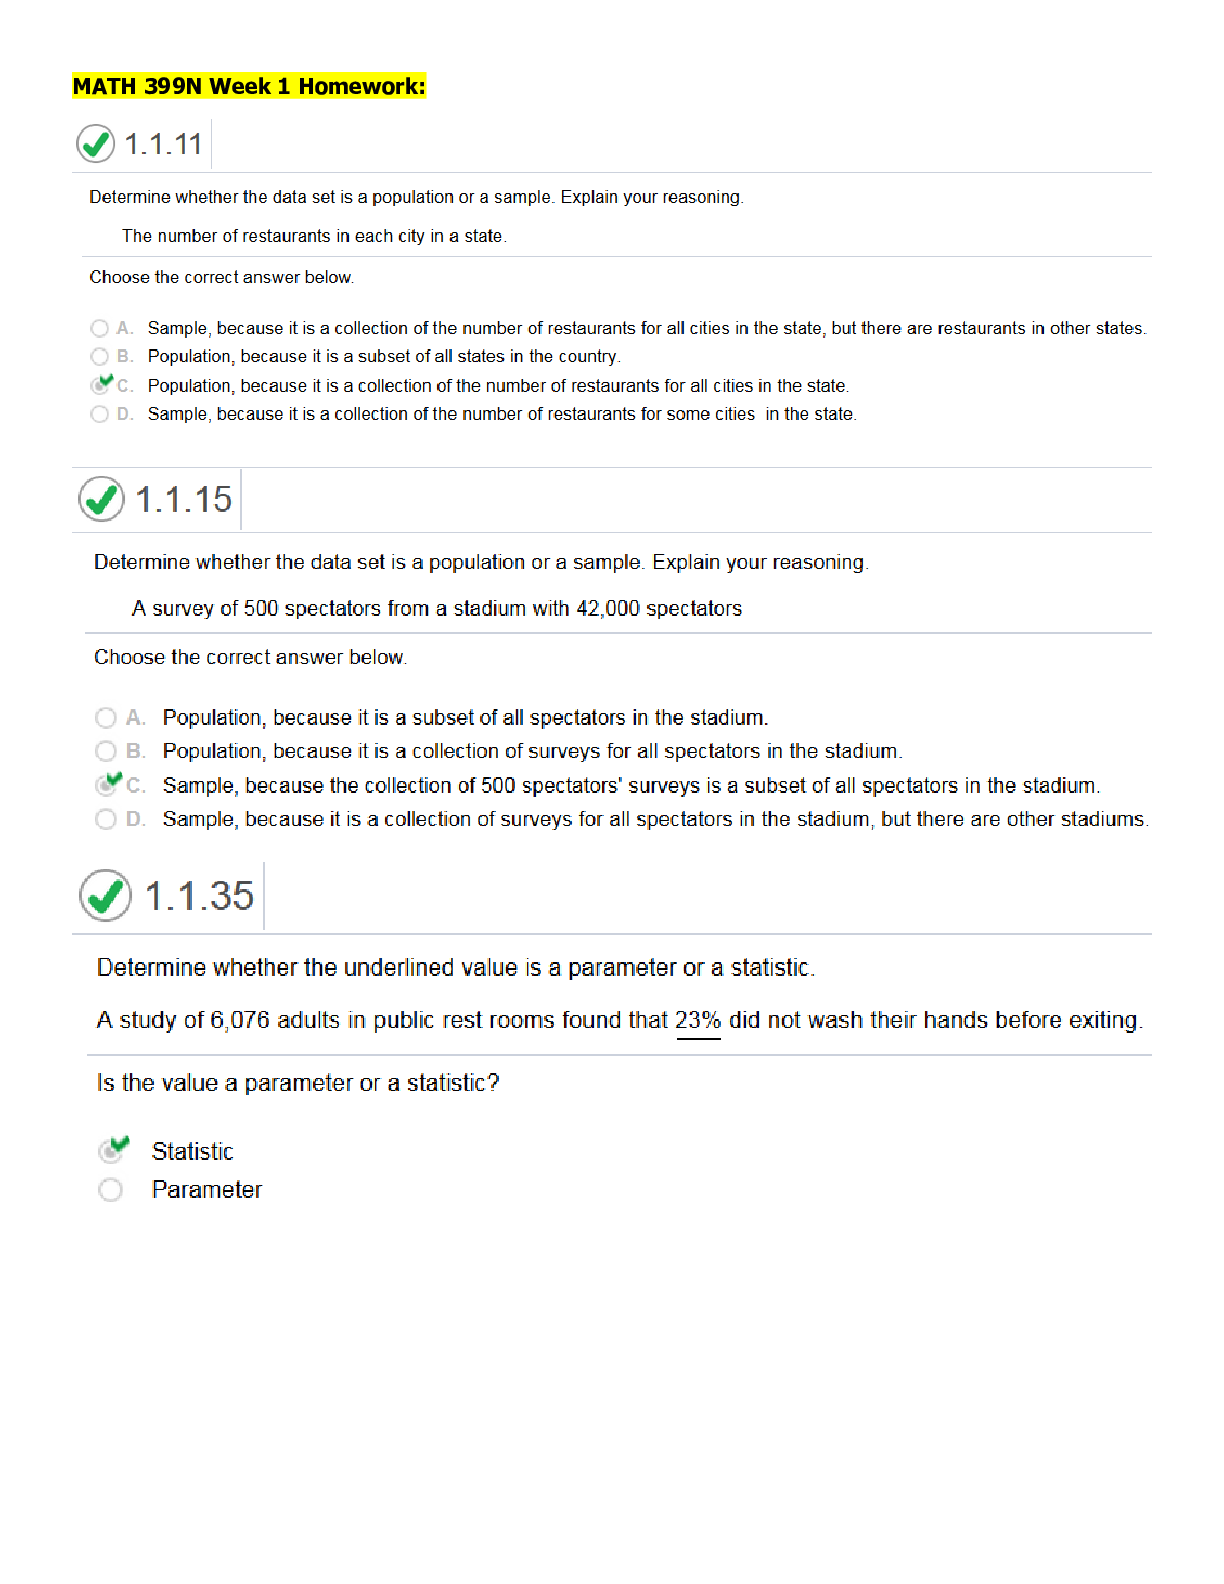
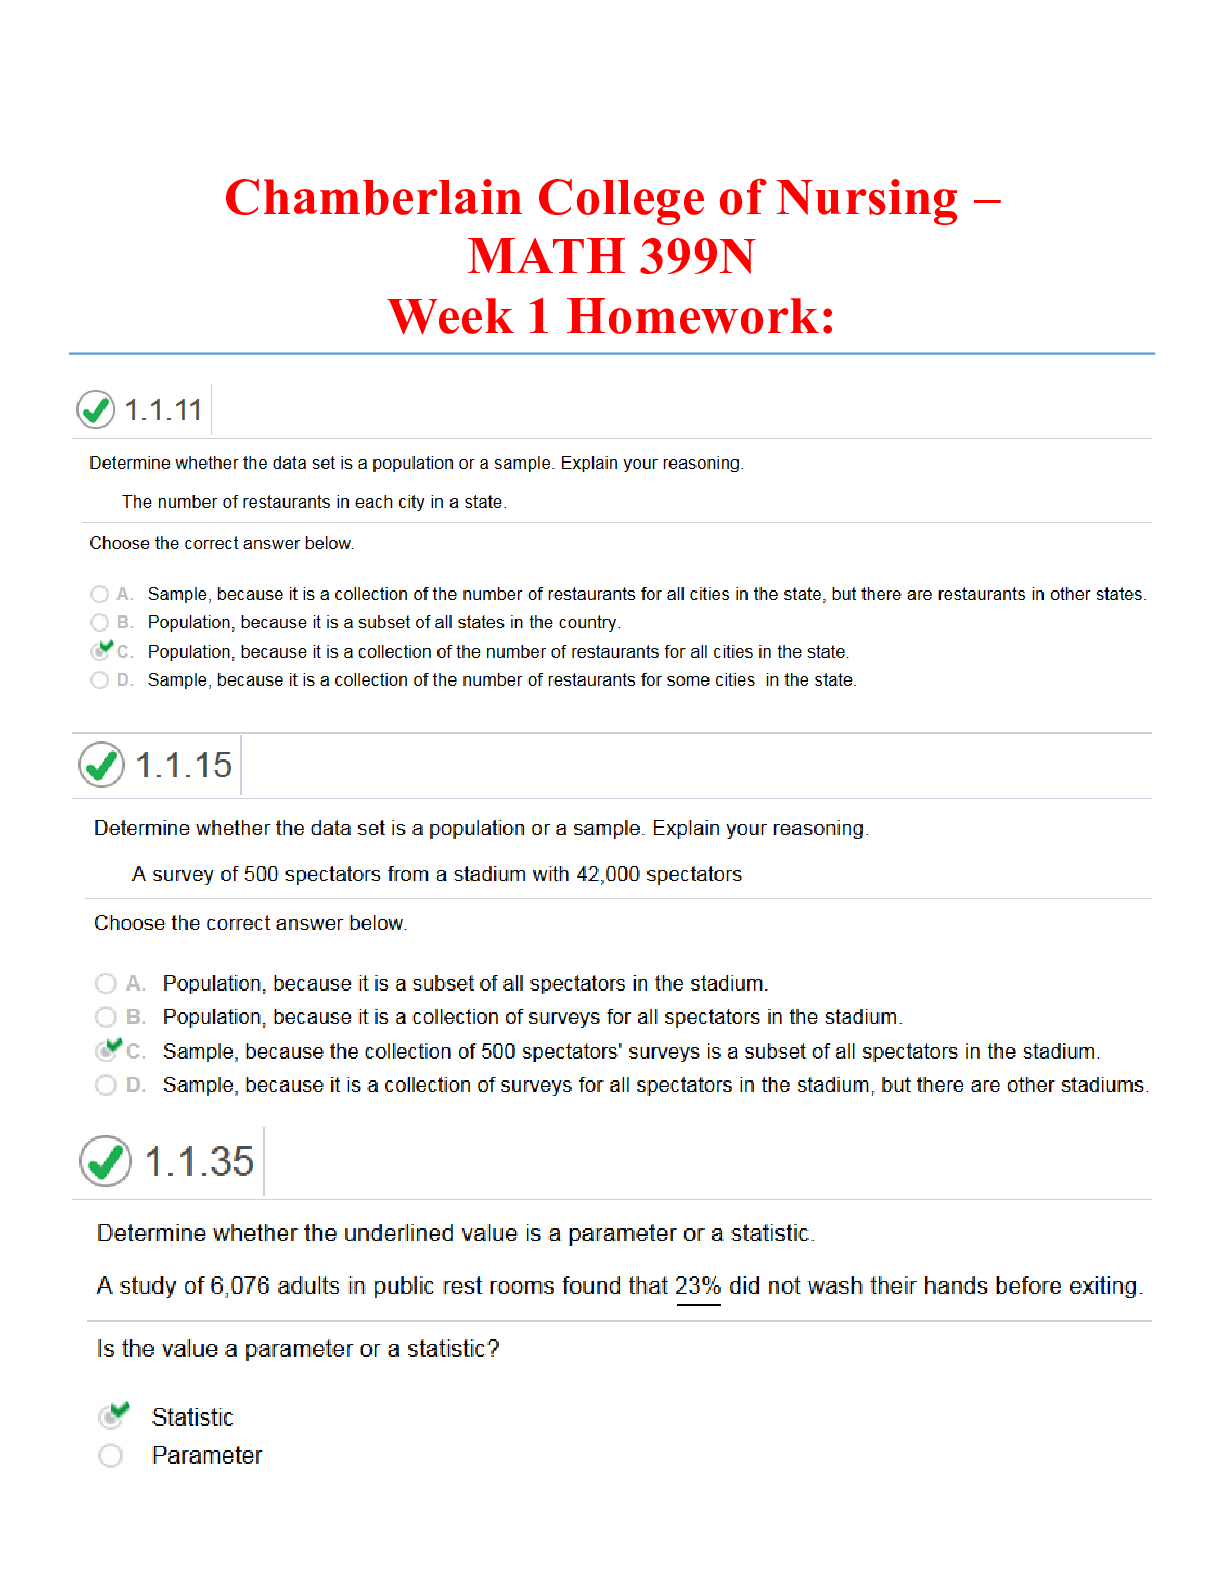
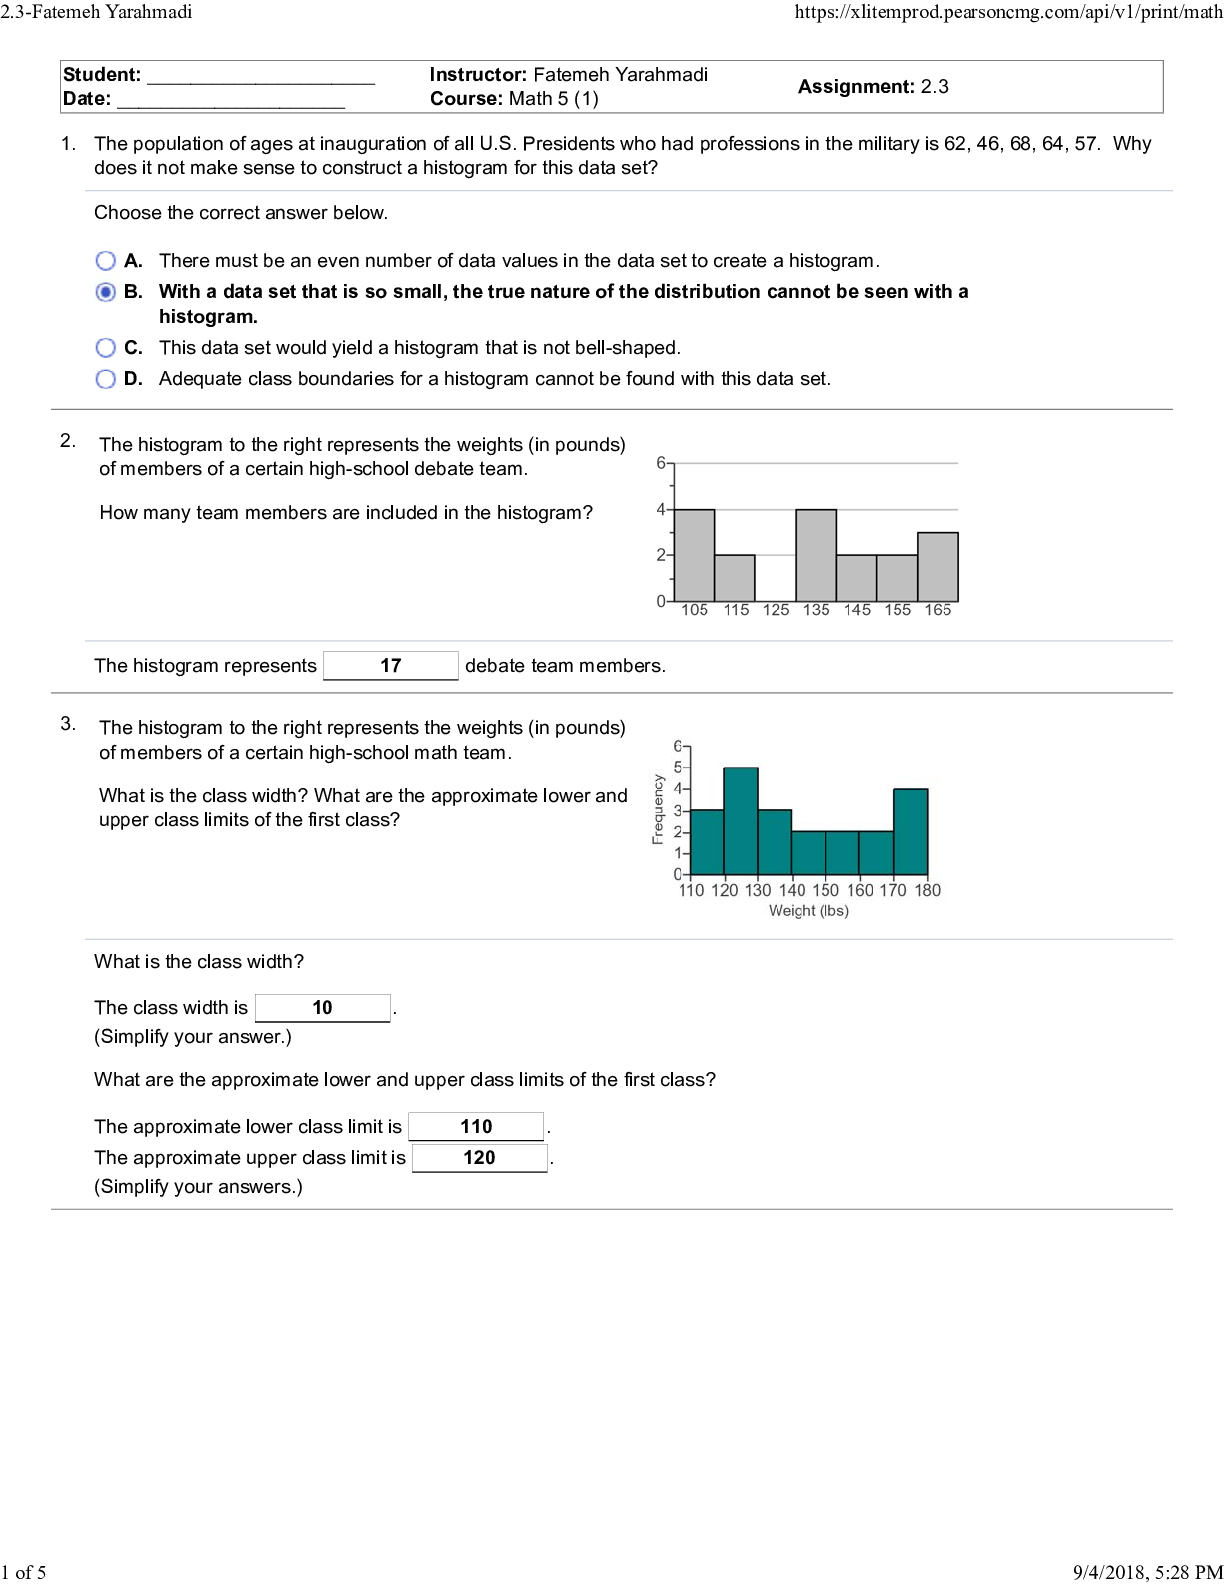
C)1 1 11 Determine whether the data sells a population or a sample Explain your reasoning The number of restaurants in each city in astute Choose the cooed answer below_ CA. Sample, because rl... is a collection of the number of restaurants for all alms in the state, but there are restaurants in other states (:) B. Population, because rt is a subset of all states in the country C. Population, because rt is a collection pith° number of restaurants for all cams in the state D. Sample, because it is a collection of the number of restaurants for some cites in the state C11.1.15 Determine whether the data sells a population or a sample Explain your reasoning A survey 01 500 spectators from a stadium wlh 42,000 spectators Choose the correct answer below A. Population, because rt is a subset of all spectators in the stadium B. Population, because rt is a collection of surveys for all spectators in the stadium aoc. Sample, because the collection 01500 spectators surveys is a subset of all spectators in the stadium D. Sample, because rt is a collector of surveys for all spectators in the stadium, but there are other stadiums CI 1.1.35 Determine whether the undefined value is a parameter or a statistic. A study of 6,076 adults in public rest rooms found that 23% did not wash their hands before exiting. Is the value a parameter or a statistic, Y Statistic Parameter 0 1.1.39 Determine whether the given value is a statistic or a parameter. In a study of all 2678 professors at a college, it is found that 25% own a television. Choose the coned statement below_ Parameter because the value is a numerical measurement describing a characteristic of a sample * Parameter because the value is a numerical measurement describing a characteristic of a population. Statistic because the value is a numerical measurement describing a characteristic of a sample. Statistic because the value is a numerical measurement describing a characteristic of a population. CI 1.1.41 Determine whether the given value is a statistic or a parameter. Ina study of all 2846 professors at a college, it is found that 50% own a computer. Choose the coned statement below. Parameter because the value is a numerical measurement describing a characteristic of a sample. Statistic because the value is a numerical measurement describing a characteristic of a sample O. Parameter because the value is a numerical measurement describing a characteristic of a population. Statistic because the value is a numerical measurement describing a characteristic of a population. 10 1.2.5 Determine whether the statement is true or false If it is false, rewrite rt as a true statement More types of calculations can be performed with data at the nominal level than with data at the interval level Choose the correct answer below. . 7, A. False The same types of calculations can be performed with data at the nominal level and with data at the interval level d.B. False More types of calculations can be performed with data at the interval level than with data at the nominal level C. True C11.2.6 Determine whether the following statement is true or false If it is false, rewnle rl as a true statement Data at the ratio level cannot be put in order Choose the coned answer below QA. The statement is false A true statement is "Data at the ratio level can be ordered, although it is impossible to determine if one data value is a mulhple of another GB. The statement is true C. The statement is false A true statement is "Data at the ratio level can be ordered, although it is impossible to subtract data values " (e. D. The statement is false A true statement is "Data at the ratio level can be placed in a meaningful order" ® 1.2.27 The region of a country with the highest level of food production for the past sin years is shown below. Southeast Northern Northwest Eastern Western Northwest Determine whether the data are qualitative or quantitative and identify the data set's level of measurement Are the data qualitative or quantitative? Quantrtabve * Qualdahve What is the data sets level of measurement, A. Interval B. Ordinal C. Ratio ADD. Nominal 0 1.3.13 Determine whether the given descriptor corresponds to an observational study or an experiment. Ina study of 372 girls with a particular disease, the subjects were given certain drugs to determine if the drugs have an effect on the disease Does the given description correspond to an observational study or an expenment, A. The given descnphon corresponds to an observational study *B. The given descnphon corresponds to an expenment C. The given descnphon does not provide enough information to answer this question C 1.3.15 Question Help A pharmaceutical company wants to test the effectiveness of a new allergy drug The company identities 250 females 3035 years old who suffer from severe allergies. The subjects are randomly assigned into two groups. One group is awn the new allergy drug and the other is given a placebo that looks exactly like the new allergy drug. After six months, the subjects' symptoms are studied and compared. Answer parts (a) through (c) below (a) !den* the experimental units and treatments used in this experiment. Choose the correct answer below. A. The experimental unit is the new allergy drug. The treatments are the severe allergies the patients suffer from a0B. The experimental units are the 30- to 35-year-old females being given the treahnent. The treahnent is the new allergy drug. C. The experimental units are the 30- to 35-year-old females being given the treahnent. The treahnent is six months. D. The experimental units are the symptoms from the drug. The treatment is the new allergy drug (b) Hen* a potential problem with the experiment design being used and suggest a way to improve R Choose the correct answer below. A. Them may be a bias on part of the experiment since only females are being tested. B. Them may be a bias on the part of the patients since they do not know if they were given the placebo or the real drug. C. Them are no biases present. 'D. Them may be a bias on the part of the researcher if the researcher knows which patients were given the real drug (c) How could this experiment be designed to be a double-blind? Choose the correct answer below. A. The study would be a double-blind study if the patient knew if they received the mat drug or the placebo but the researcher did not. B. The study would be a double-blind study if both the researcher and the patient knew if they received the real drug or the placebo. C. The study would be a double-blind study if all patients received the placebo and no patient received the real drug 'D. The study would be a double-blind study if both the researcher and the patient did not know which patient received the mat drug or the placebo. 1.3.23 Identify the sampling techniques used, and discuss potential sources of bias (rf any) Explain_ In 1965, researchers used random digil dialing to call 900 people and ask what obstacles kept them from voting. What type of sampling was used, A. Simple random sampling was used, since each number had an equal chance of being dialed, so all samples of 900 phone numbers had an equal chance of being selected 0 B Convenience sampling was used, since the 900 phone numbers that were easiest to reach were selected 0 C Systematic sampling was used, since phone numbers were selected from a list using a fixed interval between phone numbers 0 D Cluster sampling was used, since the phone numbers were divided into groups, several groups were selected, and each number in those groups was called What potential sources of bias were present, if any, Select all that apply q A. The sample only consisted of members of the population that were easy to get. These members may have not been representative of the population. VB. Individuals may have refused to participate in the sample. This may have made the sample less representative of the population. VC. Telephone sampling only includes people who had telephones. People who owned telephones may have been older or wealthier on average, and may not have been representative of the entire population. VD. Individuals may have not been available when the researchers were calling. Those individuals that were available may have not been representative of the population q E. Them were no potential sources of bias ® 1.3.25 Identify the sampling techniques used and discuss potential sources of bias (rf any) Explain_ Assume the population of interest is the student body at a university Questioning students as they leave an academic building, a researcher asks 388 students about their dahng habits. What type of sampling is used, A. Systematic sampling is used, because students are selected from a list, with a toed interval between students on the list O.B. Convenience sampling is used because students are chosen due to convenience of location C. Stratified sampling is used, because students are divided into groups, and students are chosen at random from these groups. D. Cluster sampling is used, because students are divided into groups, groups are chosen at random, and every student in one of those groups is sampled. E. Simple random sampling is used, because students are chosen at random. What potential sources of bias are present, if any? Select all that apply AO, A. The sample only consists of members of the population that are easy to get. These members may not be representative of the population. q B. University students may not be representative of all people in then age group [Lk, C. Because of the personal nature of the question, students may not answer honestly q D. Them am no potential sources of bias 1.3.31 Determine whether you would take a census or use a sampling to collect data for the study described below. The most popular grocery store among the 40,000 employees of a company. Would you take a census or use a sampling, Census Sampling C12.2.5 Match the plot with a possible descnption of the sample Choose the correct answer below A. Highest yearly temperature (F) for a sample of deserts B.-nme On hours) spent watching TV in a day for a sample of teenagers C. Waiting time (in minutes) for a sample of doctors' offices D. Top speeds (in miles per hour) of a sample of sporLs cars C12.2.17 Use a stem-and-leaf plot to display the data. The data represent the heights of eruptions by a geyser. What can you conclude about the data? 105 90 110 150 140 120 100 130 110 114 147 103 99 138 129 120 143 130 98 155 Choose the correct stem-and-leaf plot (Key: 1515 = 155) eB. 0 C. 9 89 089 10 08 W 35 10 034589 11 0039 c 04 11 0037 12 004589 13 0037 12 13 09 08 12 13 005 00 14 05 M 37 14 15 M 5 15 0 Wha can you conclude about the data? eA II appears that most eruptions have a height less than 148 B It appears that most eruptions have a height greater than 120 C It appears that most eruptions have a height between 11 and 13 D It appears that most eruptions have a height of around 12 E It appears that most eruptions have a height of around 120 ® 2.3.17 The number of credits being taken by a sample 0113 lull-time college students are listed below Find the mean, median, and mode of the data, if possible If any measure cannot be found or does not represent the center of the data, 5 5 8 8 5 6 4 4 4 4 4 4 7 (Type an integer or decimal rounded to one decimal place as needed) B. The data set does not have a median Does the median represent the center of the data? deA. The median represents the center B. The median does not represent the center because it is the smallest data value C. The median does not represent the center because it is the largest data value D. The median does not represent the center because it is not a data value E. The data set does not have a median Find the mode Select the correct choice below and, if necessary fill in the answer box to complete your choice co. A. The mode(s) is/are 4 (Type an integer or decimal rounded to one decimal place as needed U. a comma to separate answers as needed) B. The data set does not have a mode Does (Do) the mode(s) represent the center of the data? A. The mode(s) represent(s) the center B. The data set does not have a mode aX C. The mode(s) does (do) not represent the center because 4 (they) is (are) not a data value C12.4.11 The ages of 10 brides at their first marriage are given below. Complete parts (a) and (b) below 286 241 334 249 457 247 269 30.1 268 295 (a) Find the range of the data set. Range = 21 6 (Round to the nearest tenth as needed.) (b) Change 45 7 to 52 7 and find the range of the new data set. Range = 286 (Round to the nearest tenth as needed.) * 2.4.15 The ages (in years) of a random sample of shoppers at a gaming store are shown. Determine the range, mean, variance, and standard deviation of the sample data set 12, 18, 23, 15, 16, 16, 20, 17, 13, 18 The range is 11 (Simplify your answer.) The mean is 168. (Simplify your answer. Round to the nearest tenth as needed ) The variance is 11140 (Simplify your answer. Round to the nearest hundredth as needed ) The standard deviation is 3 2 (Simplify your answer. Round to the nearest tenth as needed.) [Show More]
Last updated: 1 year ago
Preview 1 out of 7 pages
Instant download
Buy this document to get the full access instantly
Instant Download Access after purchase
Add to cartInstant download
Reviews( 0 )
Document information
Connected school, study & course
About the document
Uploaded On
Jul 08, 2020
Number of pages
7
Written in

Additional information
This document has been written for:
Uploaded
Jul 08, 2020
Downloads
0
Views
69


.png)
.png)
.png)