Statistics > EXAM > Strayer University - MAT 300 Unit 4 Milestone 4 Exam. Questions And Answers. (All)
Strayer University - MAT 300 Unit 4 Milestone 4 Exam. Questions And Answers.
Document Content and Description Below
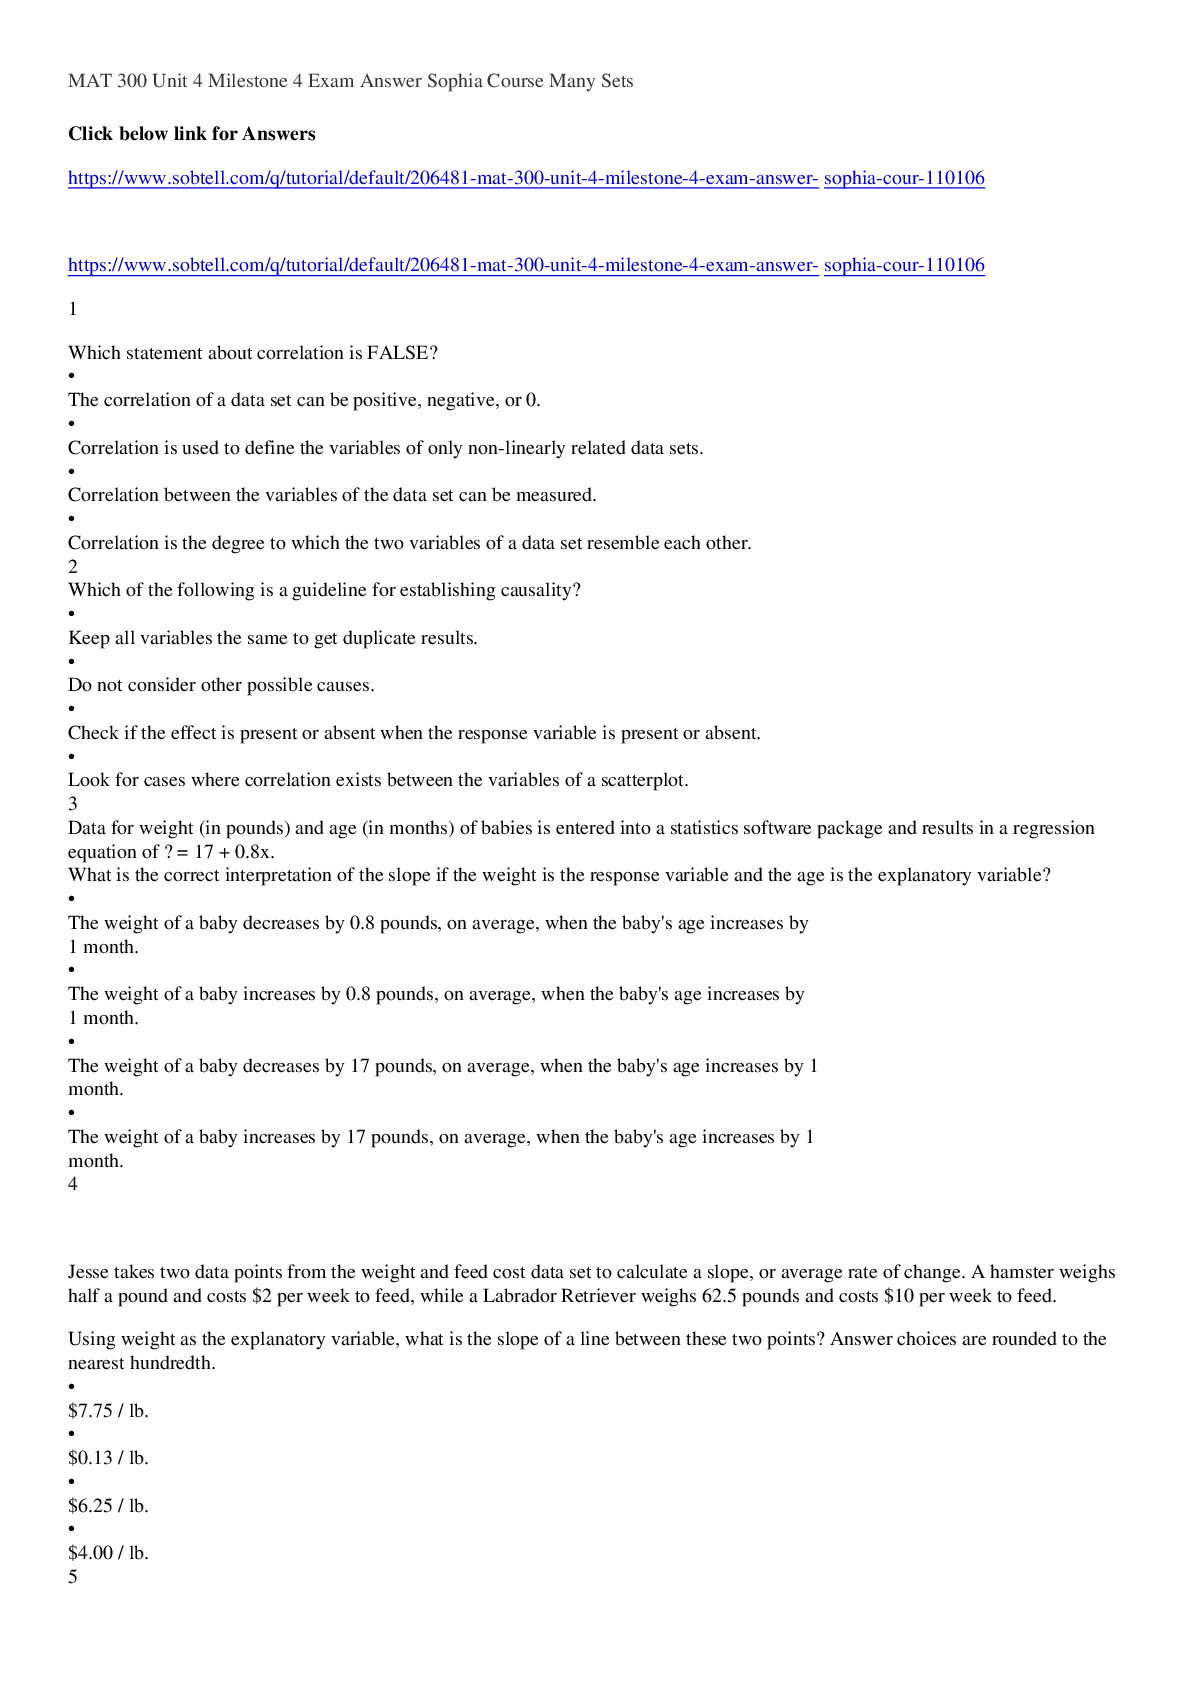
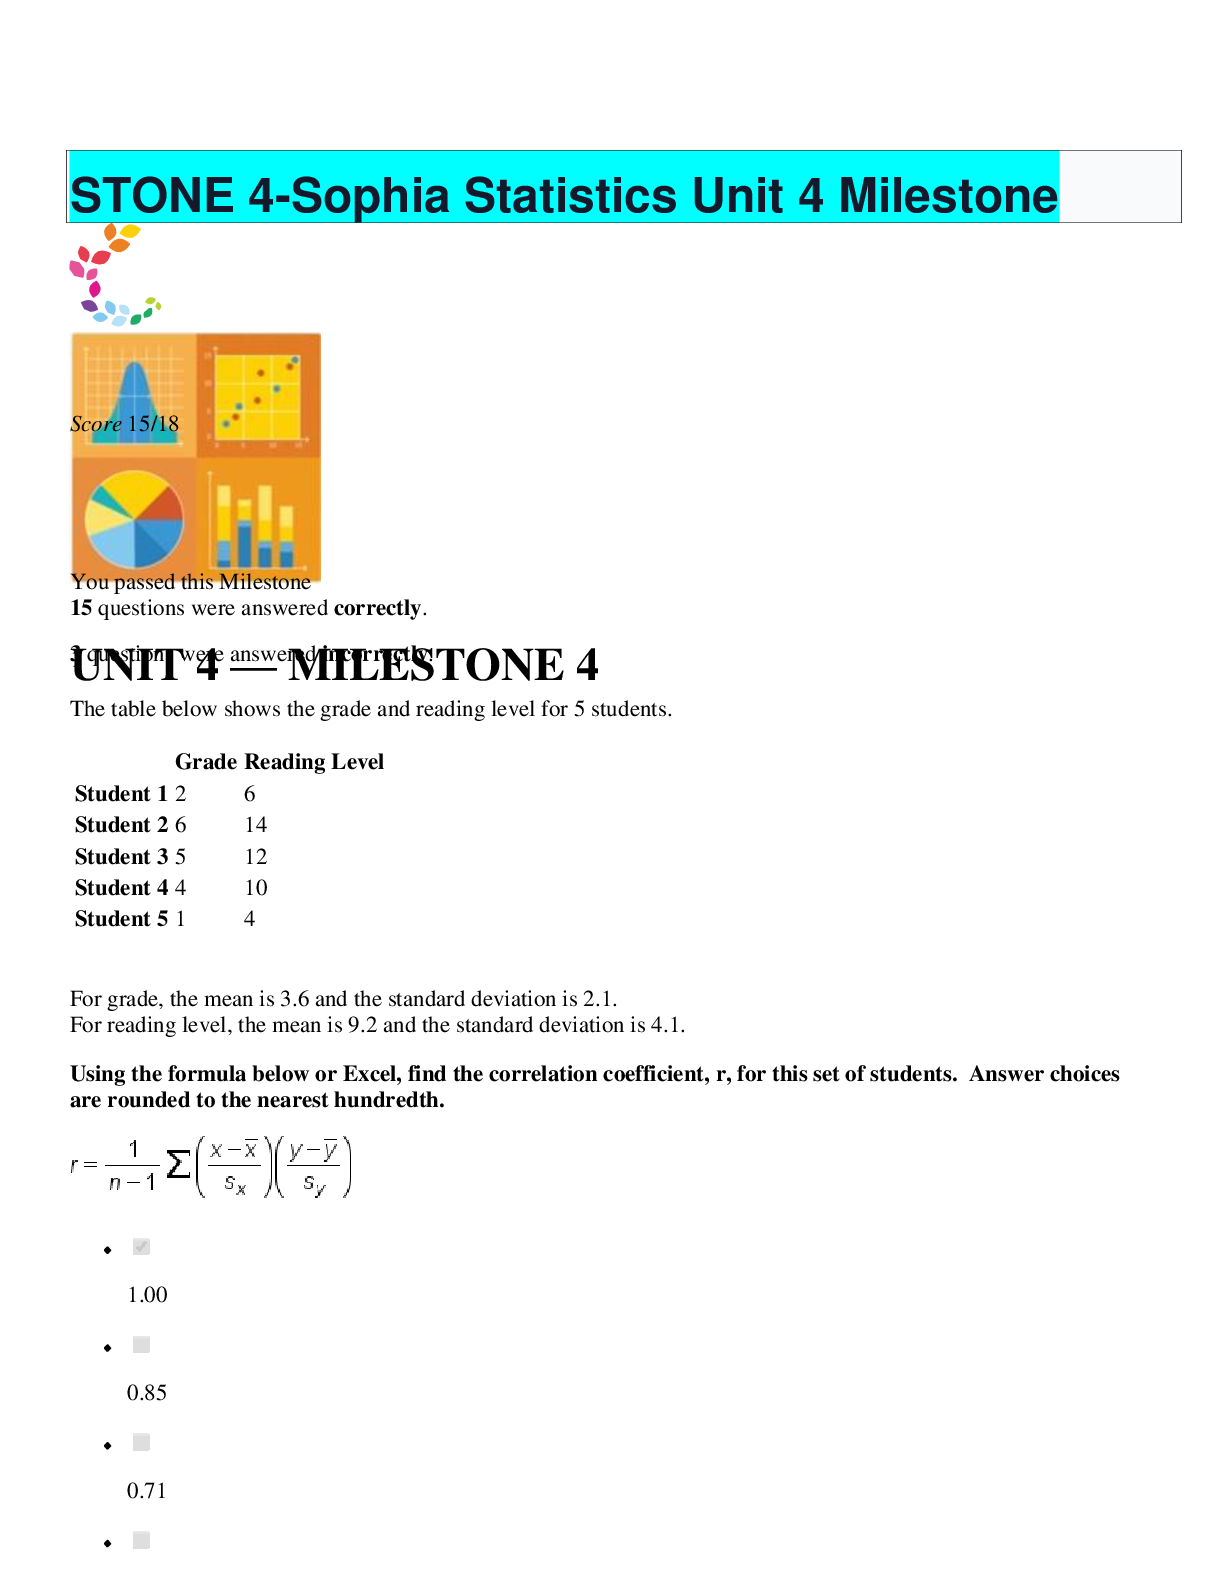
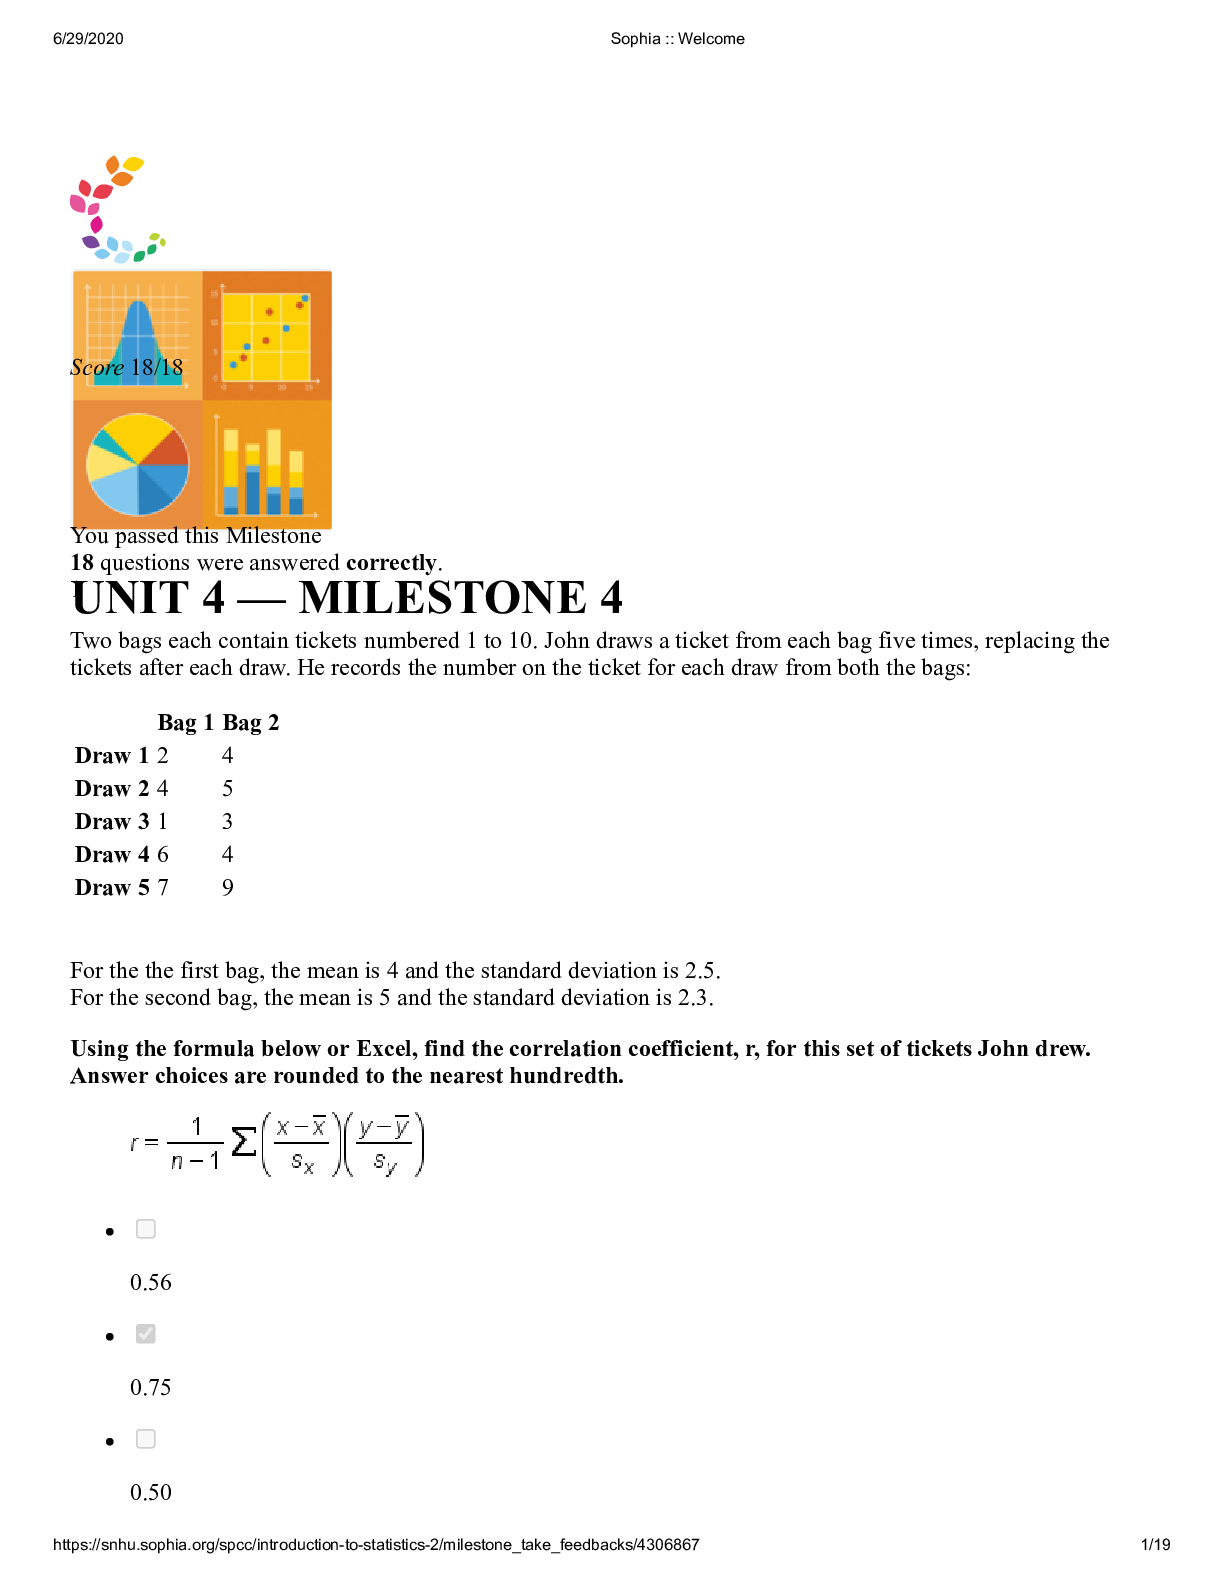
Strayer University - MAT 300 Unit 4 Milestone 4 Exam. Questions And Answers.Two bags each contain tickets numbered 1 to 10. John draws a ticket from each bag five times, replacing the tickets after e... ach draw. He records the number on the ticket for each draw from both the bags: Bag 1 Bag 2 Draw 1 2 4 Draw 2 4 5 Draw 3 1 3 Draw 4 6 4 Draw 5 7 9 For the the first bag, the mean is 4 and the standard deviation is 2.5. For the second bag, the mean is 5 and the standard deviation is 2.3. Using the formula below or Excel, find the correlation coefficient, r, for this set of tickets John drew. Answer choices are rounded to the nearest hundredth. 0.56 0.75 0.50 6/29/2020 Sophia :: Welcome https://snhu.sophia.org/spcc/introduction-to-statistics-2/milestone_take_feedbacks/4306867 2/19 0.70 RATIONALE In order to get the correlation, we can use the formula: Correlation can be quickly calculated by using Excel. Enter the values and use the function "=CORREL(". CONCEPT Correlation 2 For the data plotted in the scatterplot, the r 2 value was calculated to be 0.9846. 6/29/2020 Sophia :: Welcome https://snhu.sophia.org/spcc/introduction-to-statistics-2/milestone_take_feedbacks/4306867 3/19 Which of the following sets of statements is true? 98.5% of the variation in yearly income is explained by a linear relationship with age. The correlation coefficient, r, is 0.992 98.5% of the variation in age is explained by a nonlinear relationship with yearly income. The correlation coefficient, r, is 0.969. 98.5% of the variation in yearly income is explained by a nonlinear relationship with age. The correlation coefficient, r, is 0.992. 98.5% of the variation in age is explained by a linear relationship with yearly income. The correlation coefficient, r, is 0.969. RATIONALE 6/29/2020 Sophia :: Welcome https://snhu.sophia.org/spcc/introduction-to-statistics-2/milestone_take_feedbacks/4306867 4/19 The coefficient of determination measures the percent of variation in the outcome, y, explained by the regression. So a value of 0.9846 tells us the regression with age, x, can explain about 98.5% of the variation in income, y. We can also note that r = . CONCEPT Coefficient of Determination/r^2 3 Which of the following is a guideline for establishing causality? Do not consider other possible causes. Look for cases where correlation does not exist between the variables. The experiment performed should be controlled and randomized. Check if the effect is present or absent when the response variable is present or absent. RATIONALE Finding an association inside an experimental design controls for many other outside influences and helps to ensure that an explanatory variable always precedes the response. This helps to support, with strong confidence, that the association is causal. CONCEPT Establishing Causality 4 Which statement accurately describes the data's form, direction, and strength from the scatterplot below? 6/29/2020 Sophia :: Welcome https://snhu.sophia.org/spcc/introduction-to-statistics-2/milestone_take_feedbacks/4306867 5/19 Form: Linear Direction: Negative Strength: Weak Form: Linear Direction: Positive Strength: Moderate Form: Linear Direction: Positive Strength: Weak Form: Linear Direction: Negative Strength: Moderate RATIONALE If we look at the data, it looks as if a straight line captures the relationship, so the form is linear. The slope of the line is positive, so it is increasing. Finally, even though the direction is clear, the data points are less clustered in a line or curve, so the strength is moderate. 6/29/2020 Sophia :: Welcome https://snhu.sophia.org/spcc/introduction-to-statistics-2/milestone_take_feedbacks/4306867 6/19 CONCEPT Describing Scatterplots 5 Which statement about correlation is FALSE? Correlation between the variables of the data set can be measured. Correlation is the degree to which the two variables of a data set resemble each other. Correlation is used to define the variables of only non-linearly related data sets. The correlation of a data set can be positive, negative, or 0. RATIONALE Recall that correlation is used for linear association between 2 quantitative variables, NOT for non-linearly related variables. CONCEPT Correlation 6 Which of the following scatterplots shows a correlation affected by inappropriate grouping? 6/29/2020 Sophia :: Welcome https://snhu.sophia.org/spcc/introduction-to-statistics-2/milestone_take_feedbacks/4306867 7/19 RATIONALE Since this data has 4 distinct groups, by examining overall correlation by all the data, it will not capture how the data in each group is associated. So overall the correlation might not be very strong, but if we look at correlation inside each group, there would be a much stronger relationship. CONCEPT 6/29/2020 Sophia :: Welcome https://snhu.sophia.org/spcc/introduction-to-statistics-2/milestone_take_feedbacks/4306867 8/19 Cautions about Correlation 7 Data for price and thickness of soap is entered into a statistics software package and results in a regression equation of ŷ = 0.4 + 0.2x. What is the correct interpretation of the slope if the price is the response variable and the thickness is an explanatory variable? The price of the soap increases by $0.40, on average, when the thickness increases by 1 cm. The price of the soap decreases by $0.20, on average, when the thickness increases by 1 cm. The price of the soap decreases by $0.40, on average, when the thickness increases by 1 cm. The price of the soap increases by $0.20, on average, when the thickness increases by 1 cm. RATIONALE When interpreting the linear slope, we generally substitute in a value of 1. So we can note that, in general, as x increases by 1 unit the slope tells us how the outcome changes. So for this equation we can note as x (thickness) increases by 1 cm, the outcome (price) will increase by $0.20 on average. CONCEPT Interpreting Intercept and Slope 8 Jesse takes two data points from the weight and feed cost data set to calculate a slope, or average rate of change. A hamster weighs half a pound and costs $2 per week to feed, while a Labrador Retriever weighs 62.5 pounds and costs $10 per week to feed. Using weight as the explanatory variable, what is the slope of a line between these two points? Answer choices are rounded to the nearest hundredth [Show More]
Last updated: 1 year ago
Preview 1 out of 57 pages

Reviews( 0 )
Document information
Connected school, study & course
About the document
Uploaded On
Jun 17, 2021
Number of pages
57
Written in

Additional information
This document has been written for:
Uploaded
Jun 17, 2021
Downloads
0
Views
52
.png)

.png)