Social Sciences > QUESTIONS & ANSWERS > Palm Beach Community CollegeSYG 2010Lesson Assignments ( all answers are 100% CORRECT ) VERIFIED (All)
Palm Beach Community CollegeSYG 2010Lesson Assignments ( all answers are 100% CORRECT ) VERIFIED
Document Content and Description Below
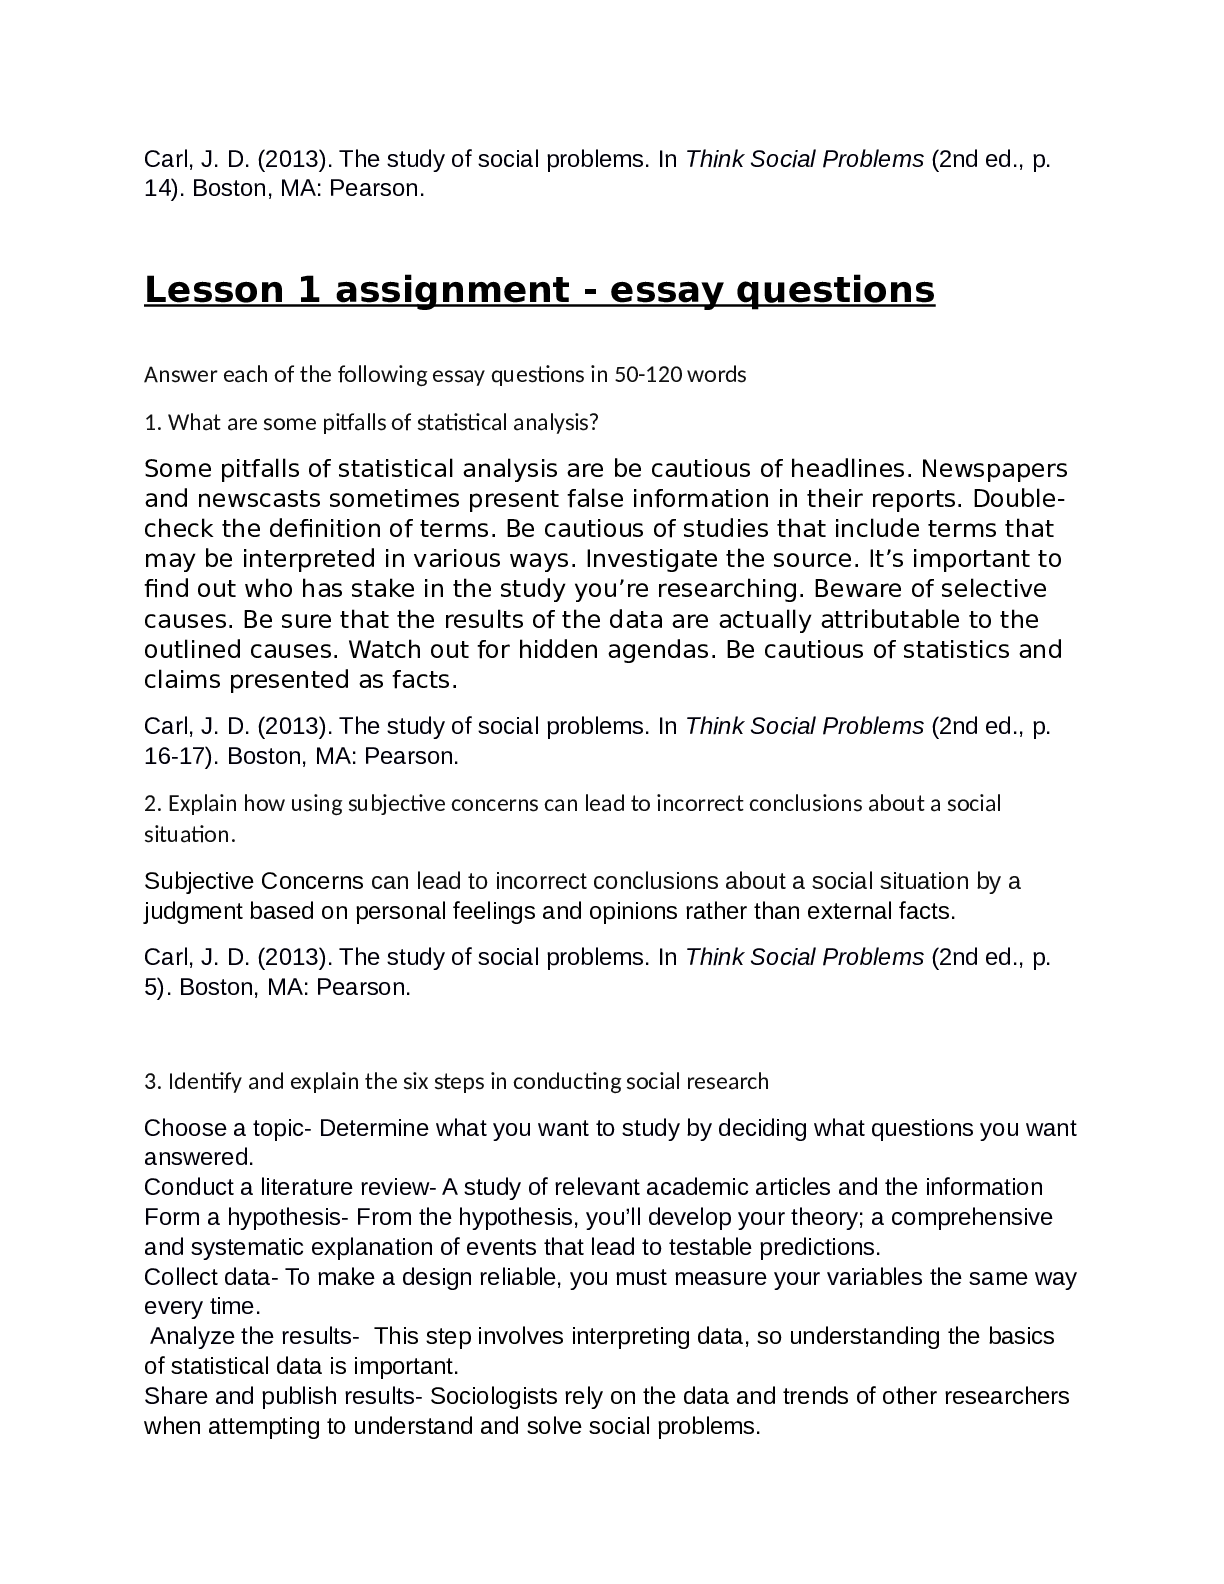
Carl, J. D. (2013). The study of social problems. In Think Social Problems (2nd ed., p. 14). Boston, MA: Pearson. Lesson 1 assignment - essay questions Answer each of the following essay questions ... in 50-120 words 1. What are some pitfalls of statistical analysis? Some pitfalls of statistical analysis are be cautious of headlines. Newspapers and newscasts sometimes present false information in their reports. Doublecheck the definition of terms. Be cautious of studies that include terms that may be interpreted in various ways. Investigate the source. It’s important to find out who has stake in the study you’re researching. Beware of selective causes. Be sure that the results of the data are actually attributable to the outlined causes. Watch out for hidden agendas. Be cautious of statistics and claims presented as facts. Carl, J. D. (2013). The study of social problems. In Think Social Problems (2nd ed., p. 16-17). Boston, MA: Pearson. 2. Explain how using subjective concerns can lead to incorrect conclusions about a social situation. Subjective Concerns can lead to incorrect conclusions about a social situation by a judgment based on personal feelings and opinions rather than external facts. Carl, J. D. (2013). The study of social problems. In Think Social Problems (2nd ed., p. 5). Boston, MA: Pearson. 3. Identify and explain the six steps in conducting social research Choose a topic- Determine what you want to study by deciding what questions you want answered. Conduct a literature review- A study of relevant academic articles and the information Form a hypothesis- From the hypothesis, you’ll develop your theory; a comprehensive and systematic explanation of events that lead to testable predictions. Collect data- To make a design reliable, you must measure your variables the same way every time. Analyze the results- This step involves interpreting data, so understanding the basics of statistical data is important. Share and publish results- Sociologists rely on the data and trends of other researchers when attempting to understand and solve social problems.Carl, J. D. (2013). The study of social problems. In Think Social Problems (2nd ed., p. 12-13). Boston, MA: Pearson. 4. What is the difference between qualitative and quantitative research methods? Give examples of each. Quantitative research method refers to data based on numbers and used for macro analysis (Carl 15). Some examples of quantitative research method are surveys and lab experiments. Qualitative data refer to information that may include words, pictures, photos, or any other type of information that comes to the researcher in a non-numerical form. Data tends to be used for microanalysis (Carl 15). Some examples of qualitative research method are ethnography and case study research. Carl, J. D. (2013). The study of social problems. In Think Social Problems (2nd ed., p. 15). Boston, MA: Pearson. 5. What factors influence how social problems are defined? History changes the definition of social problems. The issues that society considered major in the past are often not that important in the present. Cultural values are a part of society’s nonmaterial culture that represent standards by which we determine what is good, bad, right, or wrong. A cultural universal is any aspect of one’s social life that is common to all societies. All societies experience births, deaths, crime, war, and a host of other issues. In response to these issues, they create social customs to deal with them. Awareness is the ability of a person or group to bring a problem into public recognition. This often happens only after years of conflict. Carl, J. D. (2013). The study of social problems. In Think Social Problems (2nd ed., p. 5- 7). Boston, MA: Pearson. Lesson 1 - Assignment on social research Instructions: After watching this video on correlation and causation, answer ONE of the following two questions. Responses will be graded according to the rubric on short essays included here: Grading rubric for essay questions.pdf1. Define what is causation and correlation. Provide at least two examples of your own which illustrate the difference between both terms. Causation is the relationship between cause and effect (Carl 14). Correlation is an indication that one factor might be the cause for another factor (Carl 14). Homeless people and crime rate are correlated, in that both tend to be high or low in the same locations. It is equally valid to say that homeless population is correlated with crime rate, or crime rate is correlated with homeless people. To say that crime causes homelessness, or homeless people cause crime are different statements. And correlation does not imply that either is true. For instance, the underlying cause could be a third variable such as drug abuse, or unemployment. Another example is gun owners and murder rates are correlated in areas that have high rates of gun owners tend to have higher than average rates of homicide. To say that gun owners causes higher homicide rates is not true. Without more specific information, the cause and effect can be interpreted in different ways. You might look at the data and think 'Guns kill people therefore, guns cause murder.' You could also look at this and think 'Maybe people in dangerous places buy more guns for self-protection therefore, areas with high murder rates cause people to buy more guns.' Carl, J. D. (2013). The study of social problems. In Think Social Problems (2nd ed., p. 14). Boston, MA: Pearson. Boston University School of Public Health Research Study http://www.bu.edu/news/2013/09/13/new-research-shows-link-between-rates-of-gunownership-and-homicides/ 2. Statistics are often used in news headlines and when discussing social problems. However, the use of statistical information can sometimes be misleading. Please provide four recommendations to follow in assessing information which uses statistical analysis to support a given point of view. Refer to page 17 in your textbook for more information.Lesson 2 Assignment on race/ethnicity and employment opportunities [Show More]
Last updated: 1 year ago
Preview 1 out of 17 pages
Instant download
Instant download
Reviews( 0 )
Document information
Connected school, study & course
About the document
Uploaded On
Jun 28, 2021
Number of pages
17
Written in

Additional information
This document has been written for:
Uploaded
Jun 28, 2021
Downloads
0
Views
21
.png)
.png)
.png)
.png)
.png)

.png)

1.png)


.png)
.png)