Mathematics > QUESTIONS & ANSWERS > MATH 225N Week 3 Central Tendancy Questions and answers_2021_Already Graded A. (All)
MATH 225N Week 3 Central Tendancy Questions and answers_2021_Already Graded A.
Document Content and Description Below
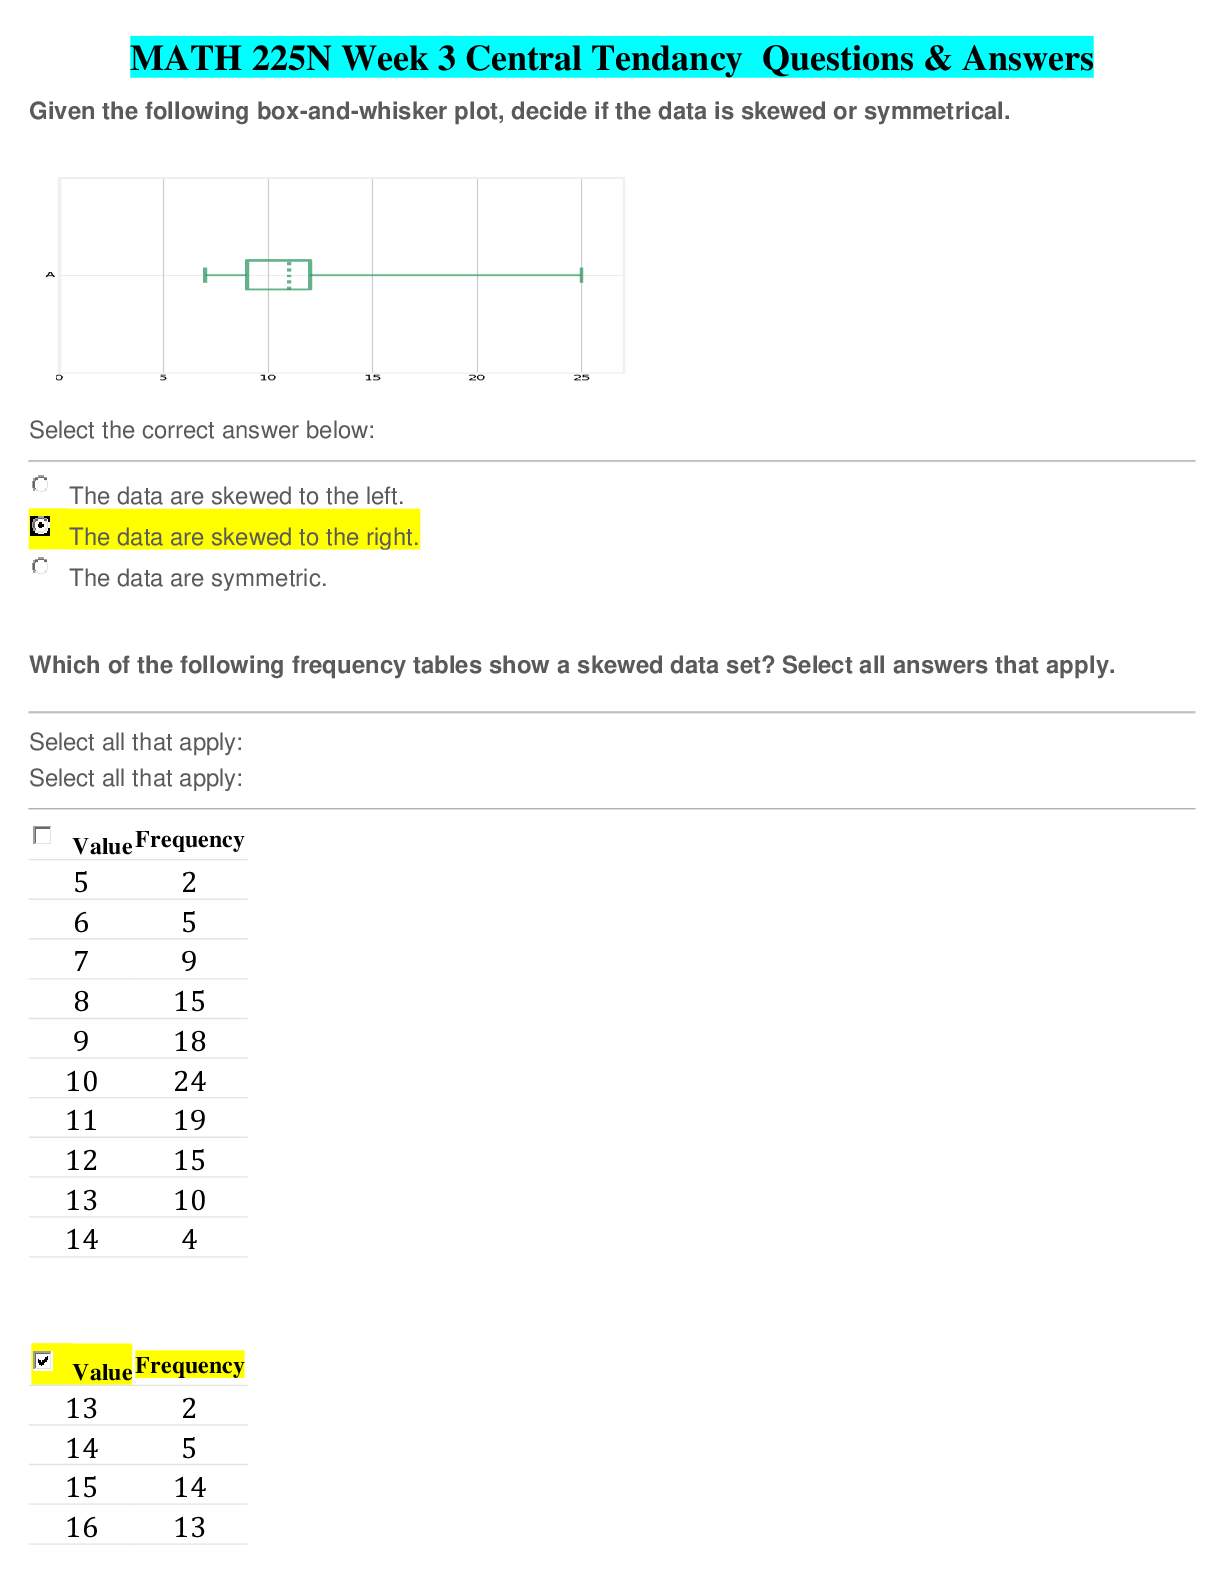
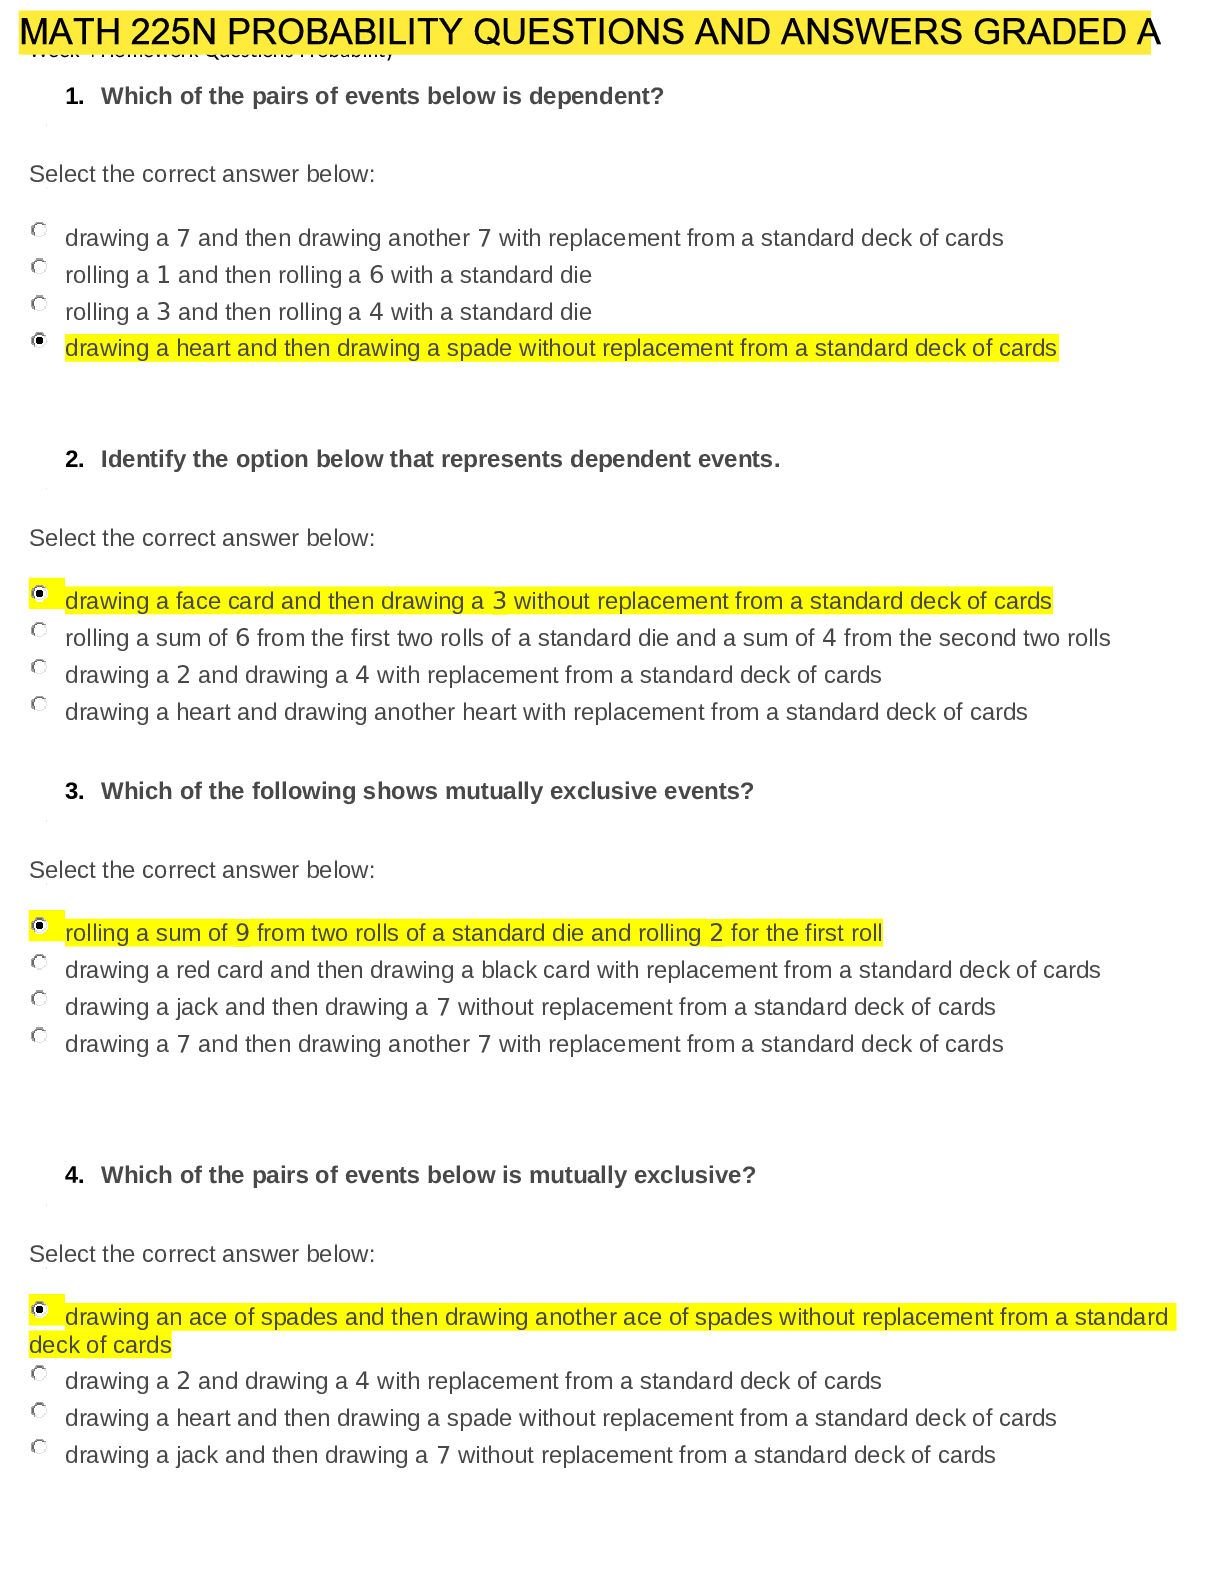
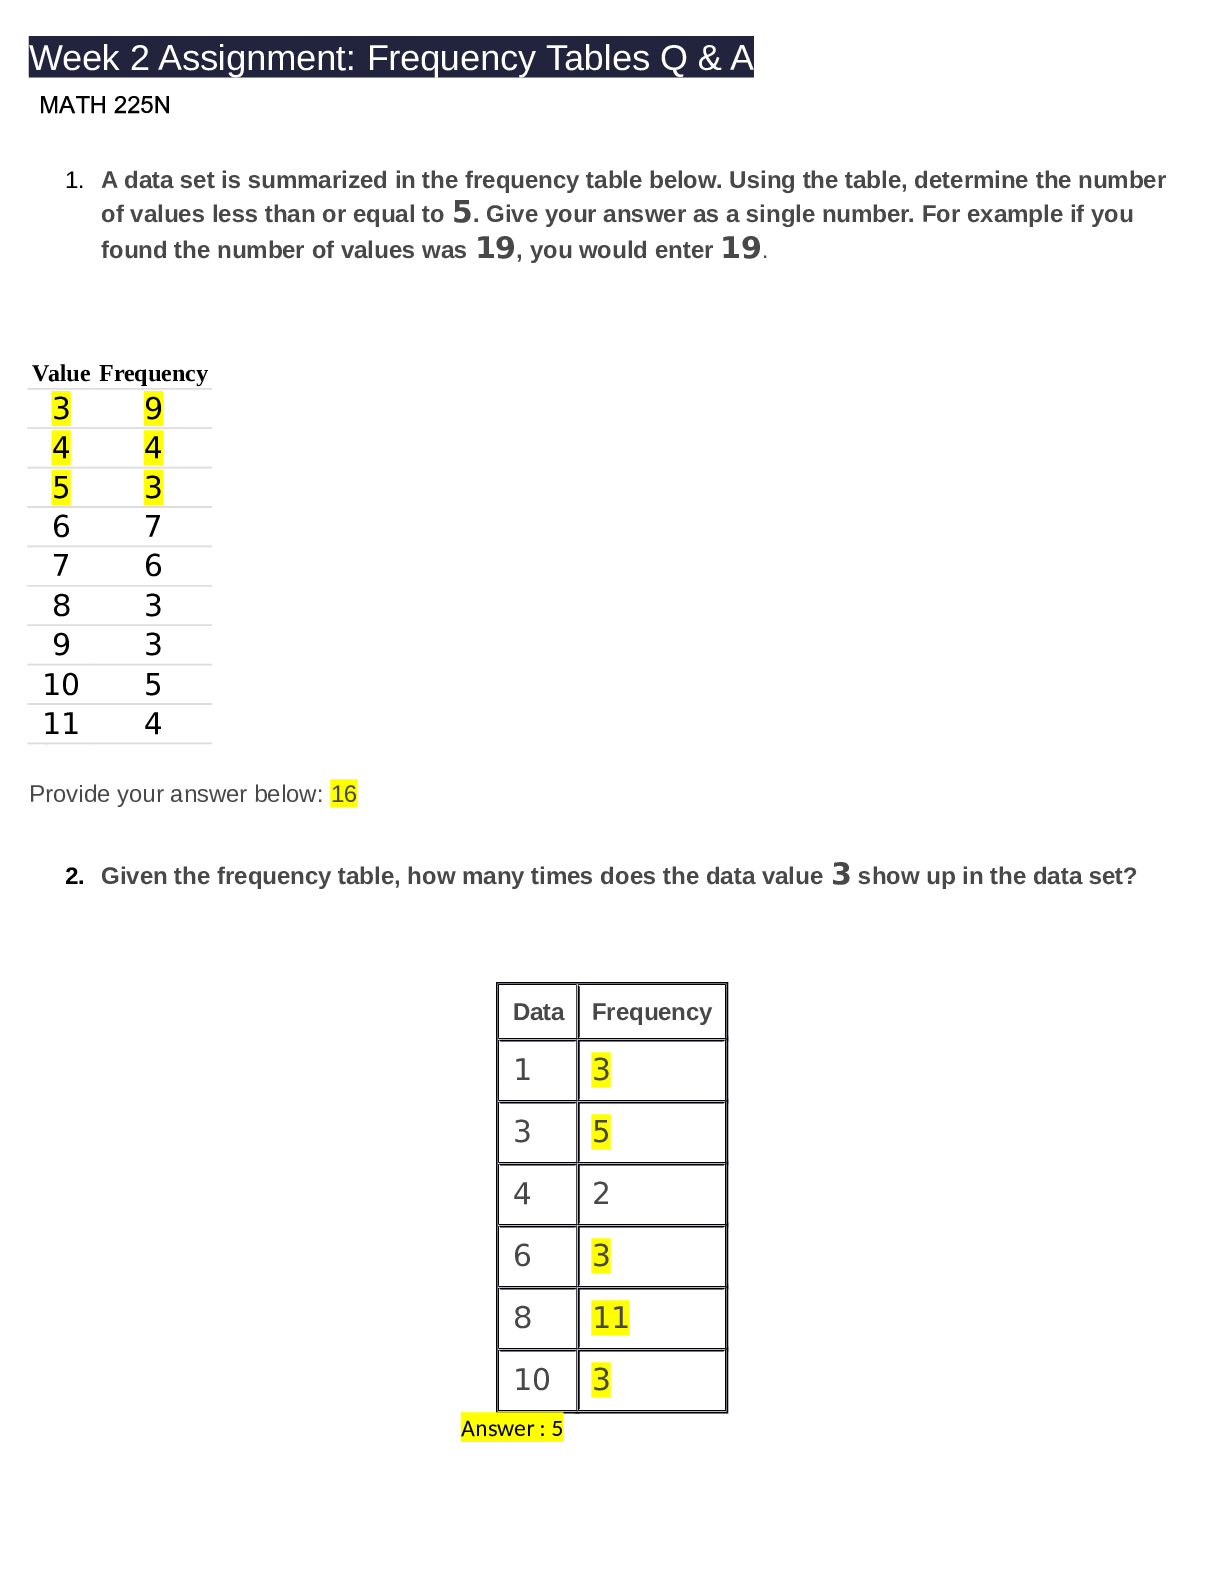
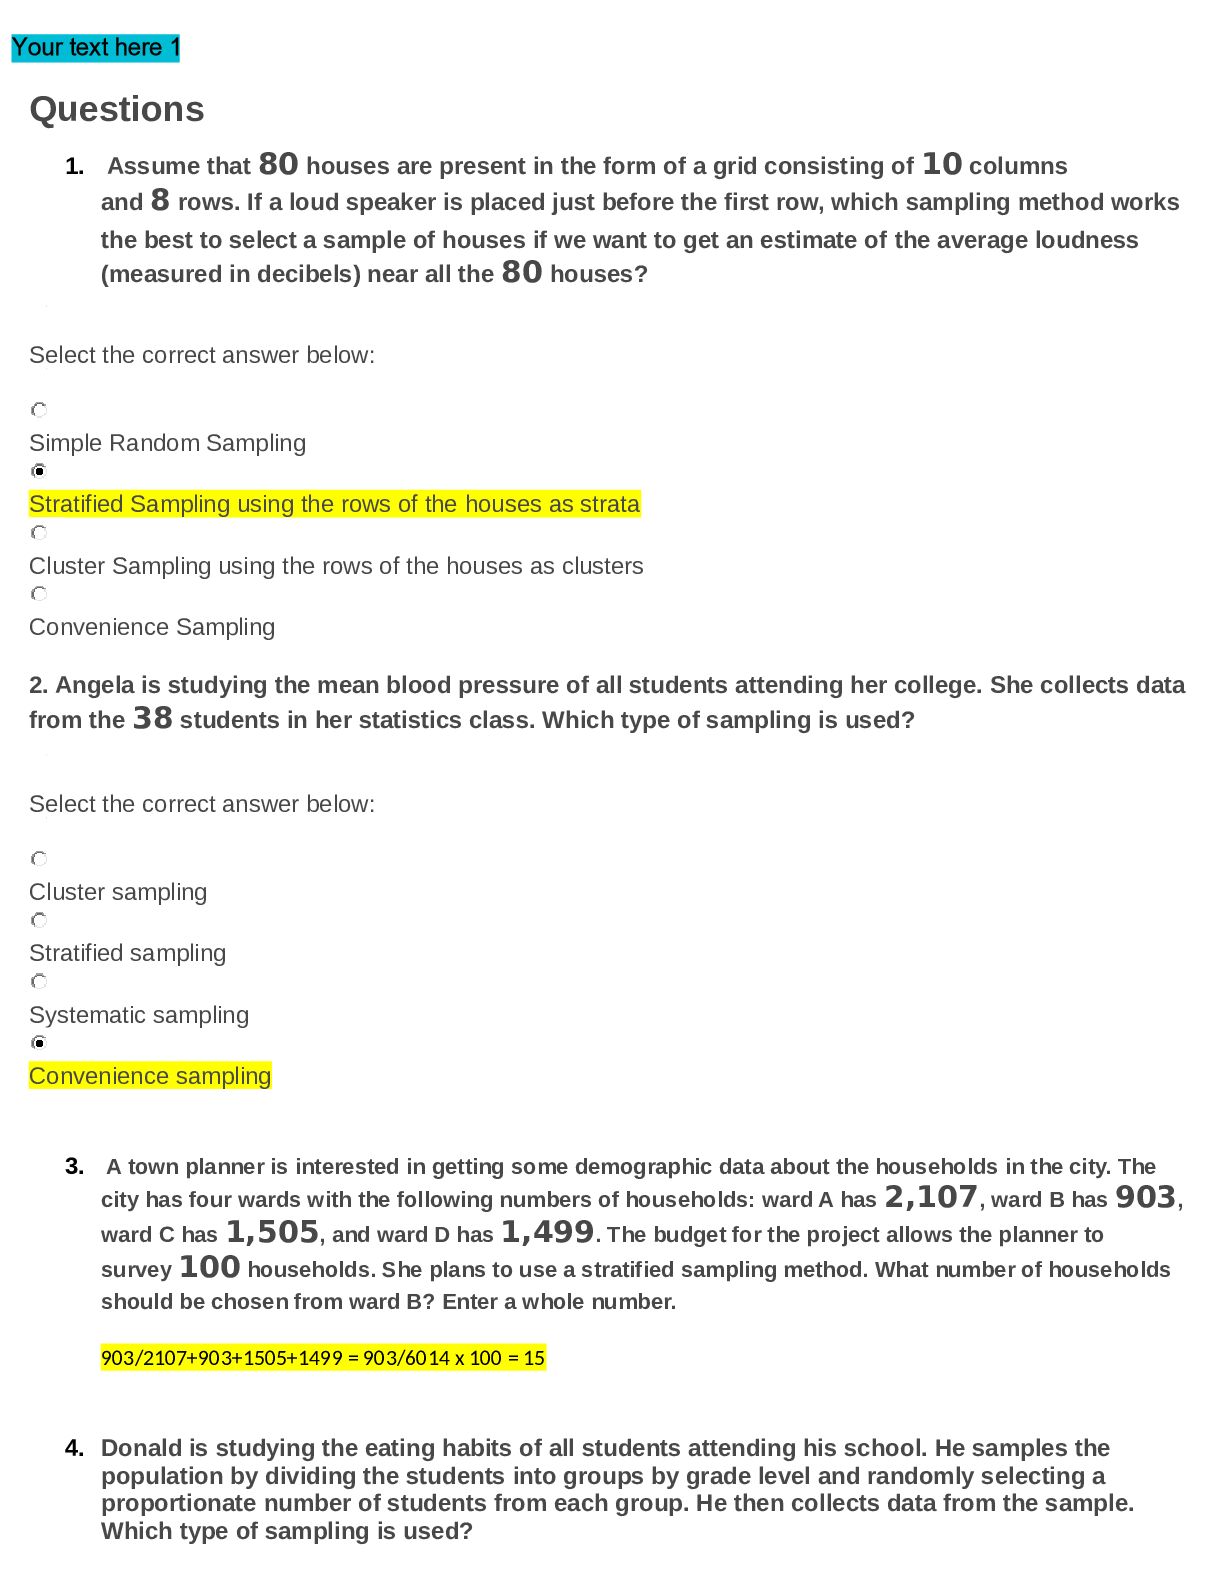
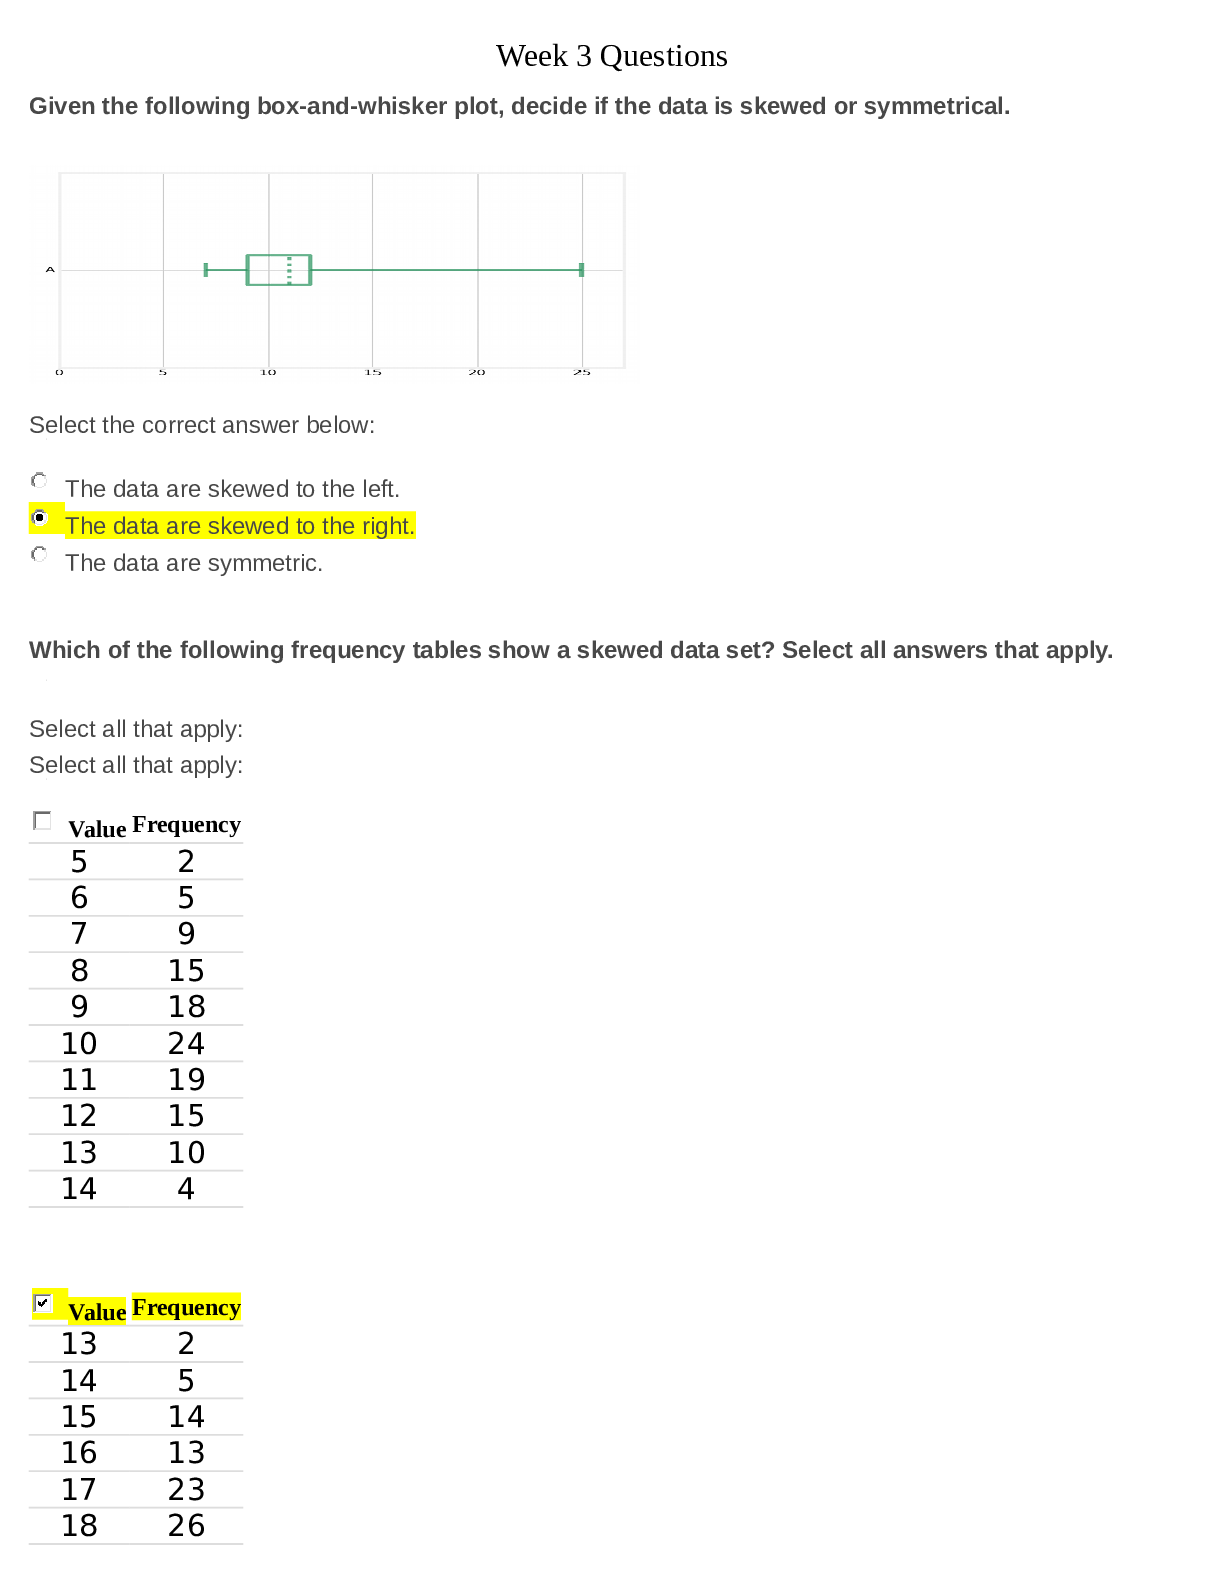
Week 3 Questions Given the following box-and-whisker plot, decide if the data is skewed or symmetrical. Select the correct answer below: The data are skewed to the left. The data are skewed to the... right. The data are symmetric. Which of the following frequency tables show a skewed data set? Select all answers that apply. Select all that apply: Select all that apply: Value Frequency 5 2 6 5 7 9 8 15 9 18 10 24 11 19 12 15 13 10 14 4 Value Frequency 13 2 14 5 15 14 16 13 17 23 18 2619 15 20 2 Value Frequency 5 1 6 1 7 9 8 20 9 24 10 20 11 9 12 4 13 1 14 1 15 1 Value Frequency 0 4 1 12 2 23 3 28 4 17 5 7 6 6 7 3 Which of the following frequency tables show a skewed data set? Select all answers that apply. Select all that apply: Value Frequency 0 2 1 11 2 30 3 22 4 155 12 6 6 7 1 8 1 Value Frequency 4 1 5 2 6 3 7 7 8 19 9 17 10 17 11 15 12 12 13 4 14 1 15 2 Value Frequency 13 1 14 6 15 9 16 15 17 27 18 28 19 10 20 4 Value Frequency 3 1 4 0 5 1 6 5 7 9 8 12 9 12 10 18 11 12 12 17 13 11 14 015 1 16 0 17 1 Which of the following frequency tables shows a skewed data set? Select all answers that apply. Select all that apply: Value Frequency 7 4 8 8 9 12 10 16 11 15 12 13 13 10 14 5 Value Frequency 5 3 6 3 7 8 8 12 9 15 10 19 11 19 12 10 13 4 14 3 15 3 16 1 Value Frequency 12 1 13 2 14 3 15 13 16 1017 26 18 25 19 15 20 5 Value Frequency 0 9 1 21 2 23 3 18 4 15 5 9 6 3 7 2 For the following dataset, you are interested to determine the "spread" of the data. Would you employ calculations for the sample standard deviation, or population standard deviation for this dataset: Ages of all students in a Statistics course with an enrollment of 30 students. Select the correct answer below: Use calculations for sample standard deviation Use calculations for population standard deviation Which of the following lists of data has the smallest standard deviation? Select the correct answer below: 11, 17, 9, 4, 4, 6, 6, 9, 8, 18 29, 21, 21, 28, 28, 26, 24, 24, 17, 23 6, 8, 10, 6, 8, 8, 10, 7, 10, 10 23, 19, 12, 19, 17, 18, 16, 10, 12, 21 17, 12, 6, 6, 15, 16, 20, 20, 5, 17 Remember that standard deviation is a measure of how spread out the values are. The list 6, 8, 10, 6, 8, 8, 10, 7, 10, 10 has the smallest standard deviation because its values are all relatively close together.Which of the data sets represented by the following histograms has the smallest standard deviation? A company is interested to know the variation in yearly sales amount for all 5 salespeople in the company. The dataset shown below is the sales amount sold by the 5 salespeople in the company (expressed in thousands of dollars): 40,60,65,70,80 Find the variance for this dataset. Provide your answer below: Variance = 176 (population “all’ Variance) The data below are the monthly average high temperatures for November, December, January, and February in New York City from the Country Studies/Area Handbook Series sponsored by the U.S. Department of the Army between 1986 and 1998. What is the sample standard deviation? 54,42,40,40 Round the final answer to one decimal place.Provide your answer below: 6.733 The following data values represent the daily amount spent by a family during a 7 day summer vacation. Find the sample standard deviation of this dataset: $96, $125, $80, $110, $75, $100, $121 Round the final answer to one decimal place. Answer 19.1 Which of the following lists of data has the smallest standard deviation? Select the correct answer below: 30, 21, 19, 17, 16, 32, 26, 25, 19, 16 5, 11, 15, 7, 5, 9, 8, 16, 14, 11 25, 24, 28, 18, 32, 34, 34, 22, 28, 19 17, 19, 17, 18, 17, 16, 16, 16, 17, 20 9, 16, 14, 22, 20, 9, 19, 16, 21, 8 Which of the following lists of data has the smallest standard deviation? Select the correct answer below: 13, 12, 12, 13, 11, 12, 12, 14, 13, 11 25, 26, 23, 17, 21, 28, 28, 23, 25, 16 5, 21, 13, 12, 19, 10, 16, 19, 8, 7 17, 16, 9, 10, 14, 6, 8, 16, 16, 2 33, 33, 30, 32, 31, 24, 28, 23, 24, 23 Find the median of the following set of miles per gallon for randomly selected sports cars. 36,22,24,30,44,13,21,34,18 Provide your answer below: 24 (arrange smallest to largest and find middle)Find the mode of the following number of times each machine in a car factory needed to be fixed within the last year. 2,5,6,12,14,12,6,2,5,3,14,5 Provide your answer below: 5 (# that occurs most often in the set) Laura runs at the park after school and wants to know the mean number of miles she runs. The numbers for the miles run each day so far are listed below. 8,9,7,13,3,9,14 Find the mean number of miles she runs daily. Provide your answer below: 9 (average of all numbers) An art collector bought 20 paintings at an art fair, and wants to know the average price of her new paintings. She adds the prices of all the paintings and divides this number by 20 to find an average price of $350 . Is this price a sample [Show More]
Last updated: 1 year ago
Preview 1 out of 26 pages
Instant download
Buy this document to get the full access instantly
Instant Download Access after purchase
Add to cartInstant download
Also available in bundle (1)
MATH 225N Week 1, week 2, week 3, week 4, week 5, week 6, week 8 Assignments & Quizes| Latest Edition 2021
MATH 225N Week 1, week 2, week 3, week 4, week 5, week 6, week 8 Assignments & Quizes| Latest Edition 2021
By d.occ 2 years ago
$45
18
Reviews( 0 )
Document information
Connected school, study & course
About the document
Uploaded On
Jul 29, 2021
Number of pages
26
Written in

Additional information
This document has been written for:
Uploaded
Jul 29, 2021
Downloads
0
Views
47
.png)

.png)