Economics > EXAM > Sonoma State University - ECON 205ECON205 - Homework02. Questions, Answers and Explanation. 100%. (All)
Sonoma State University - ECON 205ECON205 - Homework02. Questions, Answers and Explanation. 100%.
Document Content and Description Below
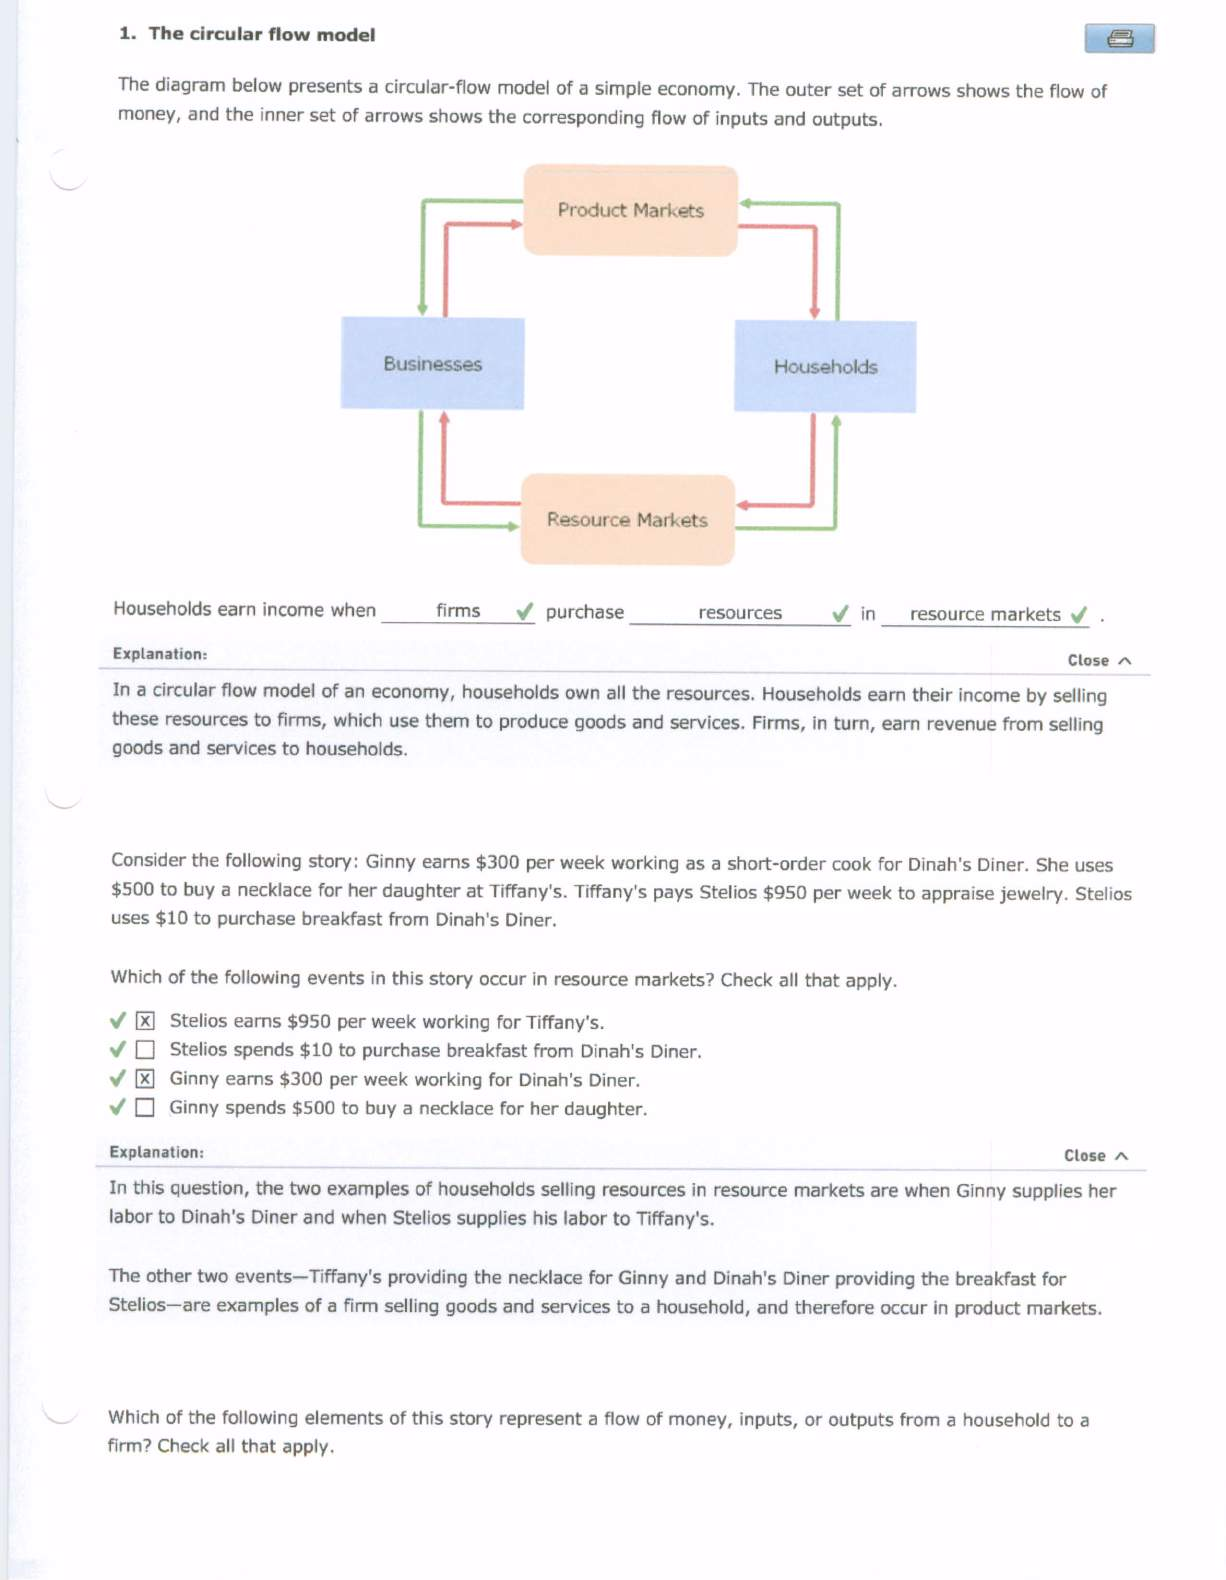
1. The circular flow model The diagram below presents a circular-flow model of a simple economy. The outer set of arrows shows the flow of money, and the inner set of arrows shows the corresponding ... flow of inputs and outputs. Produc M rI p s Households earn income when fi_lr_m_s __ ./_ purchase re_s_o_u_r_ce_s./_ in Explanation: resource markets ./ . Close A In a circular flow model of an economy, households own all the resources. Households earn their income by selling these resources to firms, which use them to produce goods and services. Firms, in turn, earn revenue from selling goods and services to households. Consider the following story: Ginny earns $300 per week working as a short-order cook for Dinah's Diner. She uses $500 to buy a necklace for her daughter at Tiffany's. Tiffany's pays Stelios $950 per week to appraise jewelry. Stelios uses $10 to purchase breakfast from Dinah's Diner. Which of the following events in this story occur in resource markets? Check all that apply . Explanation: Close A In this question, the two examples of households selling resources in resource markets are when Ginny supplies her labor to Dinah's Diner and when Stelios supplies his labor to Tiffany's. The other two events- Tiffany's providing the necklace for Ginny and Dinah's Diner providing the breakfast for Stelios-are examples of a firm selling goods and services to a household, and therefore occur in product markets. Which of the following elements of this story represent a flow of money, inputs, or outputs from a household to a firm? Check all that apply. o The necklace Ginny receives [R] Ginny's labor "0 The $950 per week Stelios earns working for Tiffany's [RJ The $10 Stelios spends to purchase breakfast from Dinah's Diner Explanation: Close A Ginny (a household) supplies her labor to Dinah's Diner (a firm). Therefore, Ginny's labor is an input that flows from a household to a firm. The necklace (a good) is prepared by Tiffany's (a firm) for Ginny (a household). So the necklace is an output that flows from a firm to a household. Tiffany's (a firm) pays Stelios (a household) $950 for his labor. Therefore, the $950 is a payment that flows from a firm to a household. Stelios (a household) pays Dinah's Diner (a firm) $10 for breakfast. Therefore, the $10 is a payment that flows from a household to a firm. Scores: 9 11 •• Average: 10 /11 2. Demand - Basic concepts The law of demand is: ~I o The amount of a good that a buyer with average income is willing and able to purchase o A graph showing the relationship between the price of a good and the amount that buyers are willing and able to purchase over a range of prices o The amount of a good that buyers are willing and able to purchase at a given price o A table showing the relationship between the price of a good and the amount that buyers are willing and able to purchase over a range of prices @ The claim that, other things being equal, the quantity demanded of a good falls when the price of that good rises Explanation: Close A The law of demand is the claim that, other things being equal, the quantity demanded of a good falls when the price of that good rises. The customary negative slope of a demand curve is the graphical representation of the law of demand. l Scores: 1 - - .:. Average: 1 / 1 3. Shifts in supplV or demand The following graph shows the market for hot dogs in Houston, where there are over 1,000 hot-dog stands at any given moment. Suppose the price of soda increases. (Assume that people regard hot dogs and soda as complements.) Show the effect of this change by shifting one or both of the curves on the graph below. Tool tip: Click and drag one or both of the curves. Curves will snap into position, so if you try to move the curve and it snaps back to its original position, just try again and drag it a little farther. Answer PRICE (Dollars per hot dog] ------ .. I II IIII Explanation: Supply D2 QUANTITY (Hot dogs per day] PRICE (Dollars per hot dog! ------ .. IIIIII Supply 02 QUANTITY (Hot dogs per day] Close /\. Hot dogs and soda are complementary goods because people like to consume them together. When the price of soda increases, it becomes more costly to consume soda and hot dogs together. Therefore! people decrease their consumption of hot dogs at any given price. Consequently, the demand for hot dogs decreases, and the demand curve shifts to the left. Notice that it is the price of soda, rather than the quantity demanded of soda, that changes the demand for hot dogs. Scores: .:. Average: 1 / 1 4. Understanding the determinants of demand The following calculator shows the demand for sedans (for example, Toyota Camrys or Honda Accords) in New York City. For simplicity, we'll assume that all sedans are identical and sell for the same price. Initially, the calculator shows market demand under the following circumstances: average household income is 550,000 per year, the price of a gallon of regular unleaded gas is 53 per gallon, and the price of a subway ride is 51.50. At any time in this problem, you may click the Reset to Initial Values button to return the demand curve to its original position. You will not be graded on any changes to the calculator; it's just here to help you answer the questions below. Tool tip: Use your mouse to drag the green line on the graph. The values in the boxes on the right side of the calculator will change accordingly. You can also directly change the values in the boxes with the white background by clicking in the box and typing. When you click the Calculate button, the graph and any related values will change accordingly. PRICE (Thousands of dollars per sedan) 50 40 Price of a Sedan : hocsancs of dolldr5] Quantity Demanded :Sedans per r'10~th) 20 400 Current Values 30 20 10 o ,IIIIII 100 200 300 400 500 600 700 800 900 QUANTITY (Sedans per month) Average Income :-tll11;~jdrH"~ of doll,tr',] Price of Gas :Oollars per saLLo~) Price of a Subway Ride :Oolla"s) 50 3 1.5 Initial Values 50 3 1.5 I Reset to Initial Values, I Calculate Suppose that the price of a sedan decreased from $25,000 to $20,000. This would cause a the demand curve. Explanation: movement along Close A The demand curve shows the relationship between the price of a good and the quantity demanded, all other determinants of demand held constant. In this case, the demand curve shows the number of sedans that people in New York City are willing and able to purchase over a range of prices, holding average income, the price of gasoline, and the price of subway rides constant. Becausethese other factors haven't changed, the demand curve does not shift. In general, when the price changes but all other determinants of the quantity demanded remain constant, the result is a movement along the demand curve. A decrease in average income causes a leftward shift of '" the demand curve; therefore, you may conclude that sedans are a normal'" good. (Hint: Try substituting different values for Average Income in the calculator and observe what happens.) Explanation: Close A The demand curve shows the relationship between the price of a good and the quantity demanded, all other factors held constant. One of those other factors is household income. If a household's income increases or decreases, the result is a shift of the entire demand curve, not a movement along the demand curve. In this case, when the average household income decreases, people can afford fewer cars at every price; therefore, a lower quantity of cars is demanded at every price. For example, suppose that the price of a sedan is $20,000. From the calculator, you can see that when the average income is $50,000, the quantity demanded is 400 sedans per month; if average income decreases to $45,000, the quantity demanded decreases to 300 sedans per month. A good is considered to be a normal good if consumers demand more of it when their income increases. Conversely, a good is classified as an inferior good if an increase in income results in a decrease in demand. From the calculator, you can see that if average household income increases, the demand curve shifts to the right, and if average income decreases, the demand curve shifts to the left. Thus, you may conclude that sedans are a normal good. Suppose that the price of a subway ride falls from $1.50 to $1. Because driving a car and taking the subway are substitutes left , a decrease in the price of a subway ride shifts the demand curve for sedans to the Explanation: Close A Two goods are considered to be substitutes if an increase in the price of one increases demand for the other, and vice versa. For example, because driving a car and taking the subway are two options for getting from one place to another, when the price of a subway ride falls, people will demand fewer cars at any price. In the calculator, this is shown as a leftward shift of the demand curve for sedans when you enter 1 into the Price of a Subway Ride box. Scores: 5 :. Average: 5/5 5. A demand puzzle The following calculator shows the demand for galumph, a useful commodity produced on the planet Hermes. The Hermetian currency is the yen. The calculator also shows how demand for galumph is affected by changes in the average income of Hermetians, as well as the prices of beam and frab, two other related goods available on the planet. At any time in this problem, you may click the Reset to Initial Values button to return the demand curve to its original position. You will not be graded on any changes to the calculator; it's just here to help you answer the questions below. Tool tip: Use your mouse to drag the green line on the graph. The values in the boxes on the right side of the calculator will change accordingly. You can also directly change the values in the boxes with the white background by clicking in the box and typing. When you click the Calculate button, the graph and any related values will change accordingly. 50 20 100 Initial Values I Reset to Initial Values, Calculate I 20 50 50 100 100 Current Values Price of Frab IY"" p,' 'l',\ IH'I Price of Beam 'Yen per busheL) Average Income :Y"n P" IrlOnth: Quantity Demanded lGran'5 ~1E!rmont 1) Price of Galumph :Yen per gram] 20 40 60 80 100 120 140 160 180 200 QUANTITY [Grams of galumph per monthl o 10 40 30 20 PRICE [Yen per gram] 100 90 80 70 60 50 Close A Suppose that the price of a gram of galumph decreased from 50 yen to 40 yen. This would cause a movement along'" the demand curve, and therefore an increase in the quantity of galumph demanded The demand curve shows the relationship between the price of a good and the quantity demanded, with other determinants of demand held constant. Because of this, when the price of a good changes, the result is a movement along the demand curve, not a shift of the entire demand curve. In other words, when the price changes, the quantity demanded of galumph changes, but the demand for galumph-that is, the overall relationship between the price of galumph and the quantity of galumph demanded-remains the same. Explanation: Plugany value lower than the current number into the Average Income box. A decrease In average Income causes a rightward an inferior shift of good. the demand curve; therefore, you may conclude that galumph is Explanation: Close A The demand curve shows the relationship between the price of a good and the quantity demanded, with other determinants of demand held constant. One of those other determinants is household income. If a household's income increases, the result is a shift of the entire demand curve, not a movement along the demand curve. That is, regardless of the price of galumph, a change in a household's income alters the quantity of galumph that the household will purchase at that price. A good is considered to be a normal good if consumers demand more of it when their income increases. Conversely, a good is classified as an inferior good if an increase in income results in decrease in demand. From the calculator, you can see that if average household income decreases from 100 yen to 80 yen per month, the demand curve shifts to the right. Thus, you may conclude that galumph is an inferior good. When the prices of beam or frab change, there is a shift of the demand curve for galumph. The directions of these changes imply that frab and galumph are complements , and that beam and galumph are substitutes wasn't any . For example, a Hermetian might say, "I went to eat my galumph this morning, but there frab in my fridge. So instead of having galumph for breakfast, I ate some beam Explanation: Close A The demand curve shows the relationship between the price of a good and the quantity demanded, holding other determinants of demand constant. One of those other determinants is the price of related goods. If the price of a related good changes, the result is a shift of the entire demand curve, not a movement along the demand curve. Two goods are considered to be complements if an increase in the price of one causes a decrease in demand for the other. For instance, if the price of peanut butter rises, people will make fewer peanut butter and jelly sandwiches. Therefore, the increase in the price of peanut butter will result in a leftward shift of the demand curve for jelly. Conversely, two goods are considered to be substitutes if an increase in the price of one causes an increase in demand (i.e., a rightward shift in the demand curve) for the other. Becauseyou can see from the calculator that an increase in the price of frab shifts the galumph demand curve to the left, you know that galumph and frab are complements. Similarly, because you can see from the calculator that an increase in the price of beam shifts the galumph demand curve to the right, you know that these two goods are substitutes. Scores: 8 - - .:. Average: 8/8 6. Supply - Basic concepts The law of supply is: '" @ The claim that, other things being equal, the quantity supplied of a good increases when the price of that good rises o A table showing the relationship between the price of a good and the amount of it that sellers are willing and able to sell over a range of prices o The claim that, other things being equal, the quantity supplied of a good decreases when the price of that good rises o A graph showing the relationship between the price of a good and the amount of it that sellers are willing and able to sell over a range of prices o The amount of a good that sellers are willing and able to sell at a given price Explanation: Close A The law of supply is the claim that, other things being equal, the quantity supplied of a good increases when the price of that good rises. The customary positive slope of a supply curve is the graphical representation of the law of supply. [ Scores: 1 - - .: Average: 1 / 1 7. Shifts in supply or demand The following graph shows the market for croissants in Los Angeles. Suppose the price of flour, a major ingredient in croissants, suddenly increases. Show the effect of this change by shifting one or both of the curves on the graph below. Tool tip: Click and drag one or both of the curves. Curves will snap into position, so if you try to move the curve and it snaps back to its original position, just try again and drag it a little farther. Answer PRICE [Dollars per croissantl S2 ------ .. Demand PRICE [Dollars per croissant) ------ .. IIIIIIIIIIIII S2 Demand QUANTITY [Croissants per weekI Explanation: QUANTITY [Croissants per weeki Close A The increase in the price of flour increases each seller's cost of producing croissants. Therefore, for any given price of a croissant, sellers are willing and able to sell fewer croissants. For instance, if a seller was willing to sell 250 croissants per day at a given price when the cost of flour was $4 per sack, the seller would be willing to sell fewer than 250 croissants per day at the same price if the cost of flour increased to $5 per sack. Visually, this is seen as a leftward shift of the supply curve. Scores: o .:. Average: 0.67/1 8. Understanding the determinants of supply The following calculator shows the supply of sedans (for example, Toyota Camrys or Honda Accords) in an imaginary market. For simplicity, we'll assume that all sedans are identical and sell for the same price. Two factors that affect the supply of sedans are the level of technical knowledge-in this case, the speed with which auto-manufacturing robots can fasten bolts, or "robot speed"-and the wage rate that auto manufacturers must pay their employees. Initially, the graph shows the supply curve when robots can fasten 2,500 bolts per hour and auto workers earn $25 per hour. At any time in this problem, you can click the Reset to Initial Values button to return the supply curve to its original position. You will not be graded on any changes to the calCulator; it's just here to help you answer the following questions. Tool tip: Use your mouse to drag the horizontal green line on the graph. The values in the boxes on the right side of the calculator will change accordingly. You also can directly change the values in the boxes with the white background by clicking in the box and typing. The graph and any related values will change accordingly. PRICE [Thousands of dollars I 50 40 Price of a Sedan [Ti'o.JsancJs [jf no. lars, Quantity Supplied ISedap~ per mon,nJ 20 200 30 20 10 . o ,IIIIII I 100 200 300 400 500 600 700 BOO 900 QUANTITY [Sedans per monthl Robot Speed [Bo.t~ per hOll,.) Auto Worker Wage [Dollars pRr hOUI"l Curren VaLues 2500 25 Initial VaLues 2500 25 Reset to Initial Values Calculate J Suppose the price of a sedan decreases from $23,000 to $18,000. This would cause the sedans to decrease because of a movement along" the supply curve. Explanation: quantity supplied of Close A The supply curve shows the relationship between the price of a good and the quantity supplied, other factors held constant. Becauseof this, when the price of the good changes, the result is a movement along the supply curve, not a shift of the entire supply curve. Since the supply curve is upward sloping, a decrease in the price of sedans causes a decrease in the quantity of sedans supplied. Suppose the UAW (United Auto Workers uniOn) negotiates a pay raise. This causes a leftward shift of more expensive to build" " the supply curve. This is because the pay raise makes cars Explanation: Close A The supply curve shows the relationship between the price of a good and the quantity supplied, other factors held constant. One of those other factors is the cost of resources, such as the wage paid to auto workers. If the wage rate increases, then each car is more expensive to produce. Therefore, for a given price of a sedan, fewer sedans will be produced if wages are higher. Scores: 4 .:. Average: 4/4 9. Movements along vs. shifts of demand and supply curves Consider the demand for cereal. Which of the following would cause a movement along tl1e demand curve for cereal? Check all that apply. o A change in the number of consumers (g] A change in the price of cereal "0 A change in the price of oatmeal (a substitute for cereal) Which of the following would cause a shift of the demand curve for cereal? Check all that apply. (g] A change in consumers' tastes that makes them desire more cereal (g] A change in consumers' income "00 A change in the number of consumers Close A Explanation: The demand curve for cereal shows the relationship between the price of cereal and the quantity of cereal demanded by consumers, assuming that all the determinants of demand-that is, all of the factors that affect the quantity of cereal consumers want to buy at a given price-are held constant. Therefore, if the price of cereal changes, the result is a movement along the demand curve. If any of the factors that determine demand change-such as consumers' tastes, consumers' income, or the price of oatmeal (a substitute for cereal)-the result is a shift of the demand curve. Another factor that can shift the demand curve is the number of consumers in the market. Because the market demand curve is arrived at by summing up the individual demand curves of all consumers, if the number of consumers in the market increases, the market demand curve shifts to the right. Scores: 6 _ - .:. Average: 6/6 10. Disequilibrium Suppose the market for cantaloupes is unregulated. That is, cantaloupe prices are free to adjust based on the forces of supply and demand. If a shortage (excess demand) exists in the cantaloupe market, then the current price must be __ Io_w_e_r __ than the equilibrium price, and you would expect buyers to offer higher prices Explanation: Close A Prices below the equilibrium price generate excess demand because buyers are willing and able to purchase more cantaloupes than sellers are willing and able to sell-the quantity supplied is less than the quantity demanded at that price. Some buyers who wish to purchase cantaloupes at the current price will be unable to do so. In order to obtain them, some buyers will offer higher prices. As buyers bid prices upward, some sellers will be willing to sell additional cantaloupes. Therefore, the market will move toward the equilibrium price, where the quantity of cantaloupes demanded by buyers exactly equals the quantity supplied by sellers. Scores: 2 - - ••• Average: 2/2 11. Market equilibrium The following table shows the supply and demand schedules in the market for Star Wars action figures. Price Quantity Demanded (Dollars per figure) (Figures per year) $10 500 20 400 30 350 40 150 50 100 Quantity Supplied (Figures per year) 50 150 200 300 450 On the graph below, plot the demand for Star Wars action figures using the blue points (circle symbol). Next, plot the supply of Star Wars action figures using the orange points (square symbol). Finally, use the black drop lines (X symbol) to indicate the equilibrium price and quantity in the market for Star Wars action figures. Answer PRICE [DoLLars per figure] 60 Demand PRICE [Dollars per figure] 60 50 40 30 20 10 o o ---------x o o o o o o o o Supply Equilibrium 50 40 30 20 10 o o ---------X o o o o o o o o o Explanation: 100 200 300 400 500 600 QUANTITY [Figures per year! l Clear ALLJ L Help J o 100 200 300 400 500 600 QUANTITY (Figures per year) Close A Each point on the market demand curve for Star Wars action figures corresponds to an entry in the market demand schedule. For example, at a price of $20 per figure, the quantity of figures demanded is 400 per year. Therefore, the point (400 figures per year, $20 per figure) lies on the market demand curve for action figures. Similarly, each point on the market supply curve corresponds to an entry from the market supply schedule. Therefore, the point (300 figures per year, $40 per figure) lies on the market supply curve. To generate market demand and supply curves, plot a point for each entry in the demand schedule and each entry in the supply schedule. The market equilibrium occurs at the price at which quantity demanded equals quantity supplied. The two curves you should have plotted intersect at a price of $35 per figure and a quantity of 250 figures per year. In the market for Star Wars action figures, the equilibrium price is most likely equilibrium quantity is most likely 250 " figures per year. Explanation: $35 " per figure, and the Close A The market equilibrium occurs at the price at which quantity demanded equals quantity supplied. At a price of $35 per figure, the quantity of Star Wars action figures supplied exactly equals the quantity demanded-250 figures per year. At prices above $35 per figure, the quantity supplied exceeds the quantity demanded, and the resulting surplus (excess supply) puts downward pressure on prices. At prices below $35 per figure, the quantity demanded exceeds the quantity supplied, and the resulting shortage (excess demand) puts upward pressure on prices. Scores: 4 5 - .:. Average: 4.5/5 12. Market equilibrium and disequilibrium The following diagram shows the supply of (orange curve) and demand for (blue curve) keyboards. You can enter a price (in dollars) into the Price of a Keyboard box to see the quantity demanded and quantity supplied at that price. Tool tip: Use your mouse to drag the green line on the graph. The values in the boxes on the right side of the calculator will change accordingly. You can also directly change the values in the boxes with the white background by clicking in the box and typing. The graph and any related values will change accordingly. The calculator is just here to help you answer the questions that follow; you will not be graded on anything you do with it. PRICE [Dollars per keyboardl 40 35 30 25 20 Price of a Keyboard IDoll~rsi Quantity Demanded [Keyboards per month. 10 750 Quantity Supplied [Keyboards per montl-J 450 15 10 5 ,III ,III o 150 300 450 600 750 900 1050 1200 QUANTITY (Keyboards per month I Reset to Initial Values Calculate 1 The equilibrium price of a keyboard in this market is __ 5_2_o__ per keyboard, and the equilibrium quantity is 600 keyboards bought and sold per month. Explanation: Close A The equilibrium price in this market is the price at which quantity demanded equals quantity supplied. By moving the green price line up and down in the calculator, you can see that quantity supplied and quantity demanded are both 600 keyboards per month when the price is $20; hence, that price-quantity combination constitutes equilibrium in this market. Supposethe price of a keyboard were $10. In this case, there would be a shortage (excess demand) 300 keyboards per month, which would exert upward'" pressure on prices. of Now suppose the price of a keyboard were $25. In this case, there would be a surplus (excess supply) of 150 keyboards per month, which would exert downward pressure on prices. ExpLanation: CLose /\. At a price of $10, consumers demand 750 keyboards per month and producers supply 450 keyboards per month. Demand exceeds supply by 300 keyboards per month. Because consumers want to buy more keyboards than producers are willing to sell at that price, a shortage (excess demand) will ensue. Sellers will realize that they can raise their prices and still sell out their entire inventory. Therefore, the shortage (excess demand) will cause the price of a keyboard to rise. At a price of $25, consumers demand 525 keyboards per month and producers supply 675 keyboards per month. Supply exceeds demand by 150 keyboards per month. Because producers want to sell more keyboards than consumers are willing to buy at that price, a surplus (excess supply) exists. Sellers will start dropping prices to sell off their residual inventory. Therefore, the surplus (excess supply) will cause the price of a keyboard to fall. Scores: 8 - - .:. Average: 8/8 13. A supplV and demand puzzle The graph below shows the market for roses in 2003. Between 2003 and 2004, the equilibrium quantity of roses remained constant, but the equilibrium price of roses increased. From this, we can conclude that between 2003 and 2004, the supply of roses decreased and the demand for roses increased Adjust the graph to illustrate your answer by showing the positions of the supply and demand curves in 2004. Tool tip: Click and drag one or both of the curves. Curves will snap into position, so if you try to move the curve and it snaps back to its original position, just try again and drag it a little farther. Answer PRICE [Dollars per rose] 5 (2004) --------- .• IIIIIIIIIIIIIIIII 0(2004) PRICE (Dollars per rose] 5 (2004) --------- .• II 0[20041 QUANTITY [Roses per dayl Explanation: QUANTITY [Roses per dayl To solve this puzzle, we need to start by thinking about the individual effects of shifts in supply and demand on the equilibrium price and quantity of roses. If the demand for roses remained constant, a shift in the supply curve would have resulted in a movement along the demand curve. If the supply of roses remained constant, a shift in the demand curve would have resulted in a movement along the supply curve. Either way, this would have caused a change in both the equilibrium price and the equilibrium quantity. Becausethe quantity of roses remained constant, however, we know that both the supply curve and the demand curve must have shifted, and the effects of those shifts on the equilibrium quantity must have offset one another. Therefore, the curves must have shifted in opposite directions. Specifically, because the price of roses increased, we know that the supply of roses decreased and the demand for roses increased. Scores: 3 .:. Average: 3/3 14. Another supply and demand puzzle l~ The market price of hamburgers in a college town increased recently, and the students in an economics class are debating the cause of the price increase. Some students suggest that the price increased because several burger joints in the area have recently gone out of business. Other students attribute the increase in the price of hamburgers to a recent increase in the price of pizza at local pizza parlors. Everyone agrees that the increase in the price of pizza was caused by a recent increase in the price of pizza dough, which is not generally used in making hamburgers. Everyone also agrees that burger joints and pizza parlors are entirely separate entities-that is, there aren't places that serve both hamburgers and pizza. The first group of students thinks the increase in the price of hamburgers is due to the fact that several burger joints in the area have recently gone out of business. Adjust the supply and demand graph below to illustrate their explanation for the increase in the price of hamburgers. Tool tip: Click and drag one or both of the curves. Curves will snap into position, so if you try to move the curve and it snaps back to its original position, just try again and drag it a little further. When you are satisfied with your answer, click the Submit Answer button. Answer PRICE (Dollars per hamburger) ------ .. Explanation: S2 Demand QUANTITY [Hamburgers per month) PRICE (Dollars per hamburger! ------ .. IIIIIIIIIIII I S2 Demand QUANTITY (Hamburgers per month I Close A When burger joints leave the market, the supply curve shifts to the left because fewer hamburgers are supplied at every given price. Note that according to this model, the price increases, and as a result, the quantity demanded decreases, This is caused by a movement along the demand curve rather than a shift in demand itself. The second group of students attributes the increase in the price of hamburgers to the increase in the price of pizza. Adjust the supply and demand graph below to illustrate their claim. PRICE [Dollars per hamburger) Supply ------------- .. 02 QUANTITY (Hamburgers per month) Explanation: Answer PRICE (Dollars per hamburgerl Supply ------------- .. 02 QUANTITY [Hamburgers per month) Close A It is safe to assume that hamburgers and pizza are substitutes, as both can be used relatively interchangeably as food for lunch or dinner. When the price of pizza increases, some people substitute hamburgers for pizza, causing the demand for hamburgers, and subsequently the equilibrium price of hamburgers, to increase. This leads to a movement along the supply curve, causing the quantity of hamburgers supplied to increase. Based on your analysis of the explanations offered by the two groups of students, how would you figure out which of the possible causes they identified was more responsible for the increase in the price of hamburgers? o If the equilibrium quantity of hamburgers increased, then the supply shift in the market for hamburgers must have been larger than the demand shift. o If the price increase was small, then the supply shift in the market for hamburgers must have been larger than the demand shift. '" @ If the equilibrium quantity of hamburgers increased, then the demand shift in the market for hamburgers must have been larger than the supply shift. o Whichever change occurred first must have been the primary cause of the change in the price of hamburgers. o If the price increase was large, then the supply shift in the market for hamburgers must have been larger than the demand shift. Explanation: Close /\, Both student groups' explanations could account for the increase in the price of hamburgers. The decrease in the supply of hamburgers-caused by the fact that several burger joints in the area have recently gone out of business-causes the equilibrium price of hamburgers to increase and the equilibrium quantity to decrease. By contrast, the increase in demand for hamburgers-caused by the increase in the price of pizza-causes both the equilibrium price and the equilibrium quantity of hamburgers to increase. This means that if both events are contributing, you can't tell which shift is bigger or more important simply by looking at the price change. Recallthat when both curves shift, either the price or the quantity change will be ambiguous without more information about which shift dominates. When demand and supply shift in opposite directions, the change in price is clear, but the quantity shift is determined by which curve moves more. Therefore, if you know that the equilibrium quantity has decreased, then the dominant cause of the price change must have been the decrease in the supply of hamburgers, as shown by the left-hand diagram below. If you know that the equilibrium quantity has increased, then the increase in demand for hamburgers must have been the dominant cause of the price change, as shown by the right-hand diagram below. 15. Understanding changes in equilibrium price and quantity l~ Suppose you are an analyst in the oil refinery industry and are responsible for estimating the equilibrium price and quantity of home heating oil. To do so, you must consider factors that can affect the supply of and demand for heating oil. Determinants of the demand for heating oil include household income, the price of an oil furnace (a complement to heating oil), and the price of natural gas (a substitute for heating oil). Determinants of the supply of heating oil include the cost of crude oil and the cost of refining crude of! into home heating oil. By changing the numbers in the boxes in the equilibrium calculator below, you can see the effects of these factors on the daily supply and demand curves. At any time in this problem, you may click the Reset to Initial Values button to return the demand curve to its original position. You will not be graded on any changes to the calculator; it's just here to help you answer the following questions. Tool tip: Use your mouse to drag the green line on the graph. The values in the boxes on the right side of the calculator will change accordingly. You can also directly change the values in the boxes with the white background by clicking in the box and typing. When you click the Calculate button, the graph and any related values will change accordingly. PRICE [Dollars per barrell 80 Price of Heating Oil 30 70 !Dollars per barre.) Quantity Demanded 100 Quantity Supplied 60 60 :- Hl[ '"Hit '; of barrds/-hy) ITho,,',and', of n,•..,,'h!r., yl 50 Shortage 40 Surplus 0 :7~ousallds of bar-r-els/day) (Tro.,sands of aa-rels!ciiY] 40 30 , , Price of Natural Gas 10 Cost of Crude Oil 25 I I .DoUars pe'l,UOO cubic It.] (Prr borre. 01 heal ng oi•. 20 I I I I Price of an Oil Furnace 2000 Cost of Refining Oil 8 10 I I -Dollars p~r fur-'1ace P:)~- barrel of 1eatil'g oill I I I I Average Annual Income 40 \ \ -TI'ou',ilnd', of d"IL" ,,: 0 20 40 60 80 100 120 140 160 Calculate] QUANTITY (Thousands of barrels per dayl [ Reset to Initial Values Suppose that all of the determinants of supply and demand for heating oil are equal to their initial values. (If you've changed any of them, click the Reset to Initial Values button.) The equilibrium quantity in this market is 80,000 barrels of heating oil per day, and the equilibrium price is $40 per barrel. Explanation: Close A The market for heating oil is in equilibrium when the price of heating oil is such that the quantity of heating oil demanded equals the quantity of heating oil supplied. In this case, when the price of heating oil is $40 per barrel, the quantity demanded and quantity supplied both equal 80,000 barrels of heating oil per day. Supposethat the cost of crude oil increases from $25 to $55 for each barrel of heating oil produced. Assuming that the rest of the determinants of supply and demand for heating oil remain equal to their initial values, the market will eventually reach a new equilibrium price of $55 " per barrel. While the cost of producing each barrel of heating oil increases by $30, the price of heating oil increases by $15 per barrel. Explanation: Close A The increase in the cost of crude oil increases the cost of producing heating oil. As the cost of producing heating oil increases, firms are willing and able to produce less heating oil at any given market price. This is represented by a leftward shift of the supply curve. If you enter 55 into the Cost of Crude Oil box, you can see this shift. If you move the green price line until it corresponds to the intersection of the demand and new supply curves, you can see that the new equilibrium price will be $55 per barrel, a change of $15 per barrel-less than the $30 change in the cost of producing each barrel. Why does the selling price of heating oil go up by only $15 if the cost of producing heating oil goes up by $30? Note that the initial equilibrium quantity of heating oil in the market was 80,000 barrels per day. To be willing to supply that many barrels of heating oil, producers need to receive $40 per barrel. This means that when the cost of producing heating oil increases by $30 per barrel, the price of heating oil must also increase by $30 (to $70 per barrel) in order for producers to still be willing to produce the same amount of heating oil (80,000 barrels per day) as they did at the initial equilibrium. But because the demand curve is downward sloping, the quantity demanded at $70 is less than 80,000 barrels per day. Indeed, if you place the price line at $70 per barrel, you'll see that consumers demand only 20,000 barrels per day at that price, so there would be a surplus (excess surplus) of 60,000 barrels per day. Therefore, $70 per barrel cannot be the new equilibrium price. What actually happens is that at the initial equilibrium price of $40, consumers still demand 80,000 barrels of heating oil per day, while producers are willing to supply only 20,000 barrels per day. This results in a shortage (excess demand) of 60,000 barrels per day, exerting upward pressure on prices. As the price rises, the quantity supplied increases, but the quantity demanded decreases. The new equilibrium is achieved at a price of $55 per barrel and a quantity of 50,000 barrels per day. Reset the calculator to its initial values. Suppose that instead of an increase in the cost of producing heating oil, there was an increase in the price of natural gas from $10 to $20 per 1,000 cubic feet. If the price of heating oil were to remain at the initial equilibrium price you found in the first question, there would be a shortage (excess demand) of 20,000 barrels of heating oil per day, which would exert upward pressure on prices. Explanation: Close A An increase in the price of natural gas, a substitute for heating oil, increases the demand for heating oil. On the graph, the demand curve shifts to the right. You can enter 20 into the Price of Natural Gas box and then click the Calculate button to see exactly how demand changes. If you leave (or place) the price line at its initial equilibrium value of $40 per barrel, you can see that at this price, consumers will demand 100,000 barrels of heating oil per day. Becauseheating oil producers still supply 80,000 barrels of heating oil per day at this price (because the supply curve has not shifted), a shortage (excess demand) of 20,000 barrels of heating oil per day will result. However, heating oil producers know that they are turning away customers at a price of $40 per barrel, so they will have an incentive to raise prices. Scores: 7 - - .:. Average: 7 /7 [Show More]
Last updated: 1 year ago
Preview 1 out of 24 pages
Reviews( 0 )
Document information
Connected school, study & course
About the document
Uploaded On
Aug 19, 2020
Number of pages
24
Written in

Additional information
This document has been written for:
Uploaded
Aug 19, 2020
Downloads
0
Views
54