Mathematics > Solutions Guide > University of California, Los Angeles LIFESCIENC 30A. Homework 8 Solutions. All Excercises (All)
University of California, Los Angeles LIFESCIENC 30A. Homework 8 Solutions. All Excercises
Document Content and Description Below
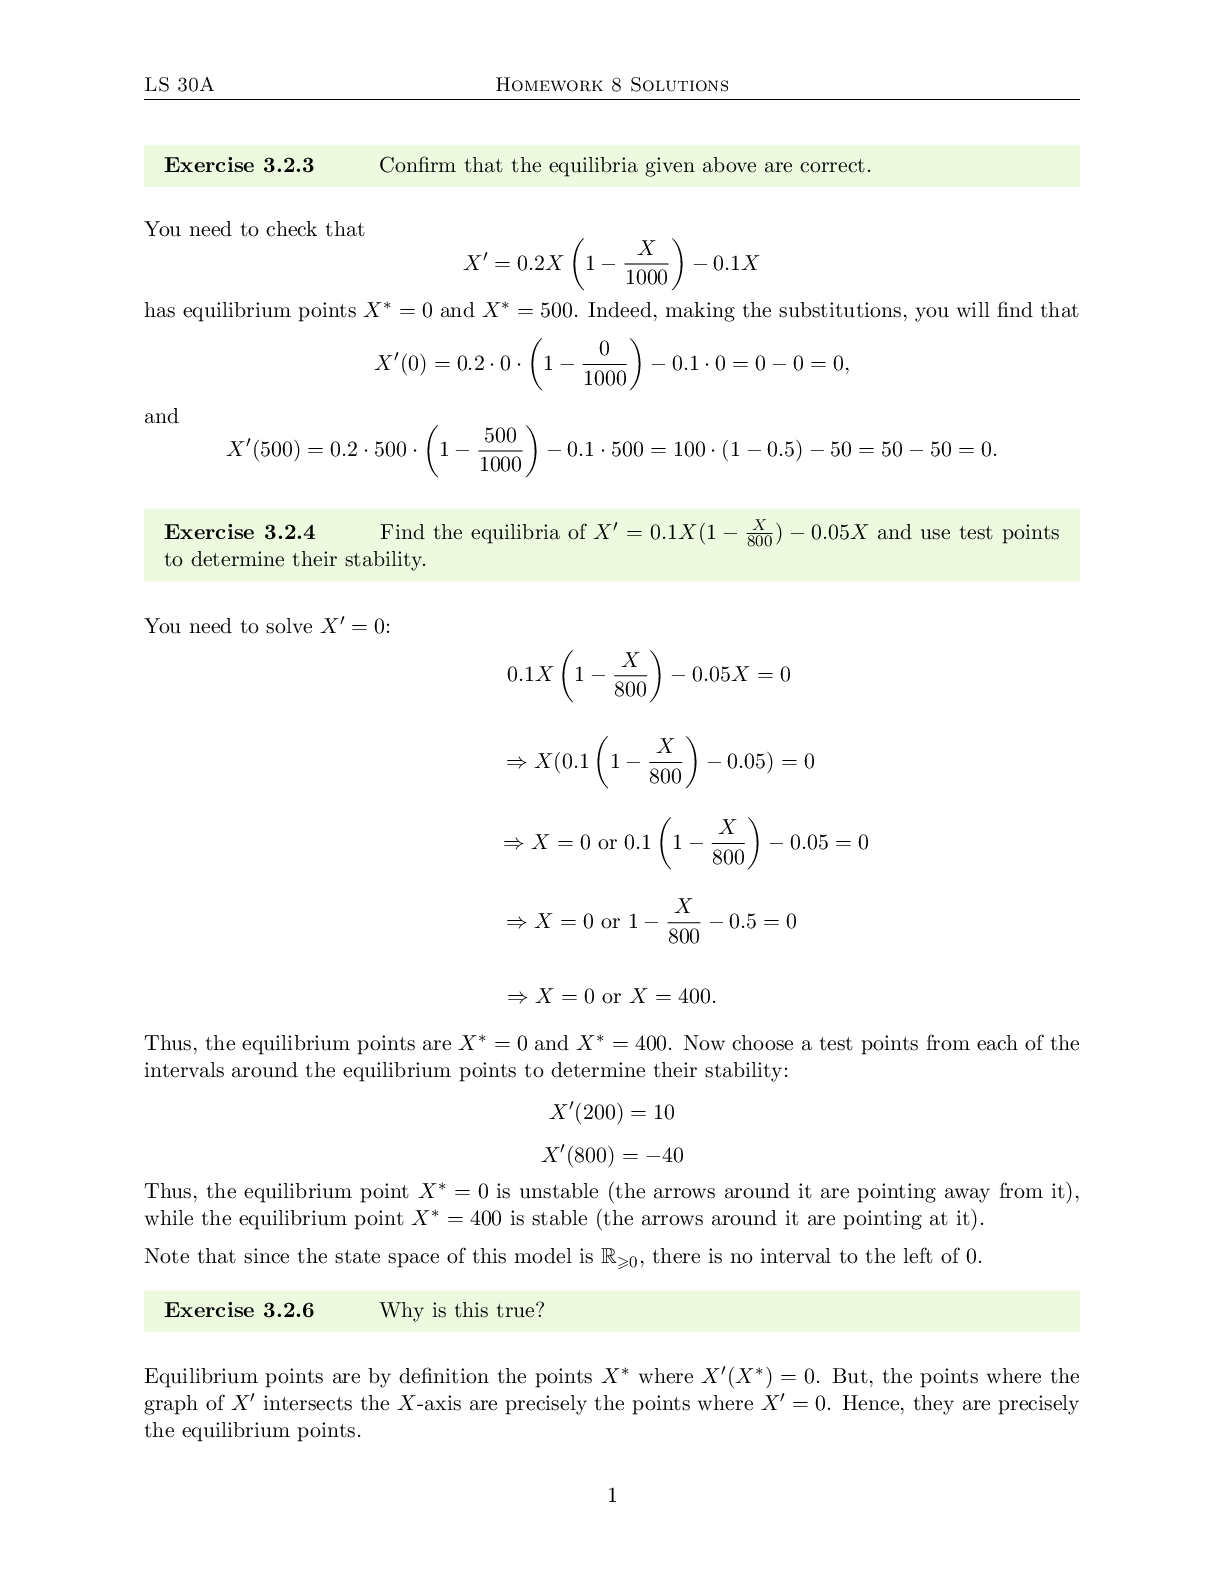
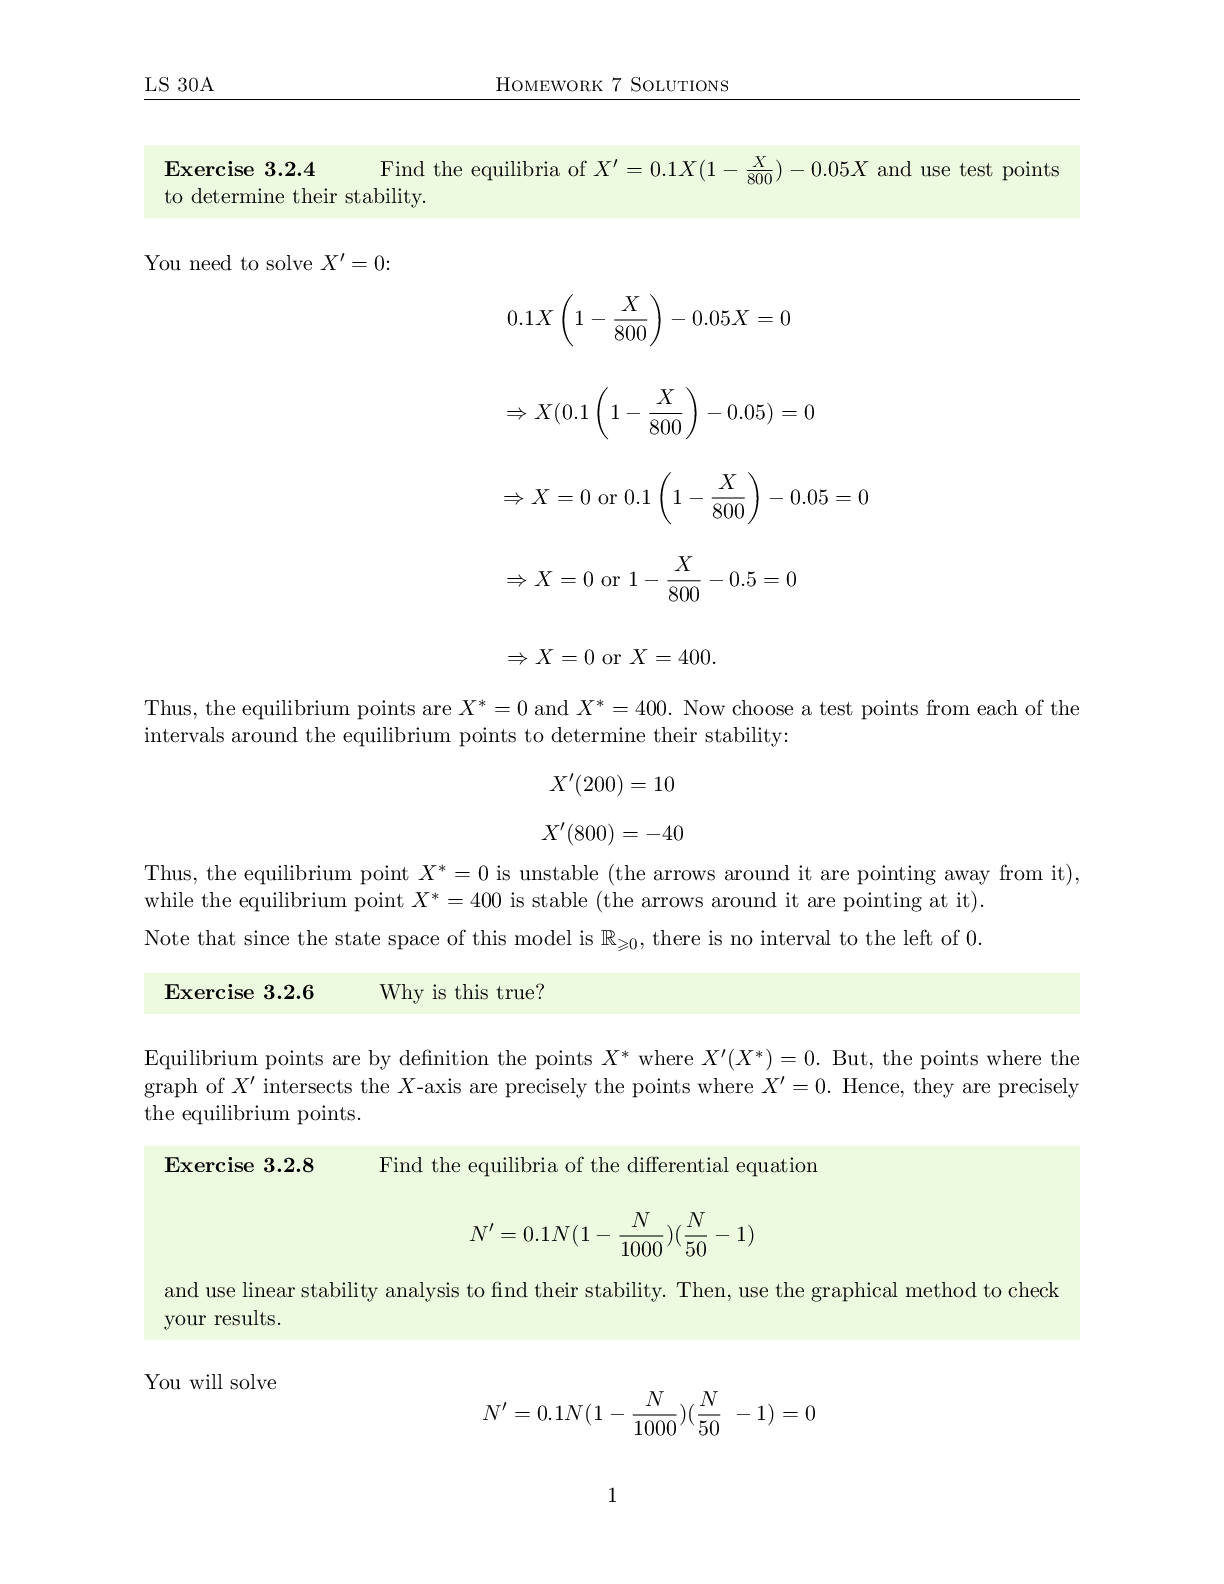
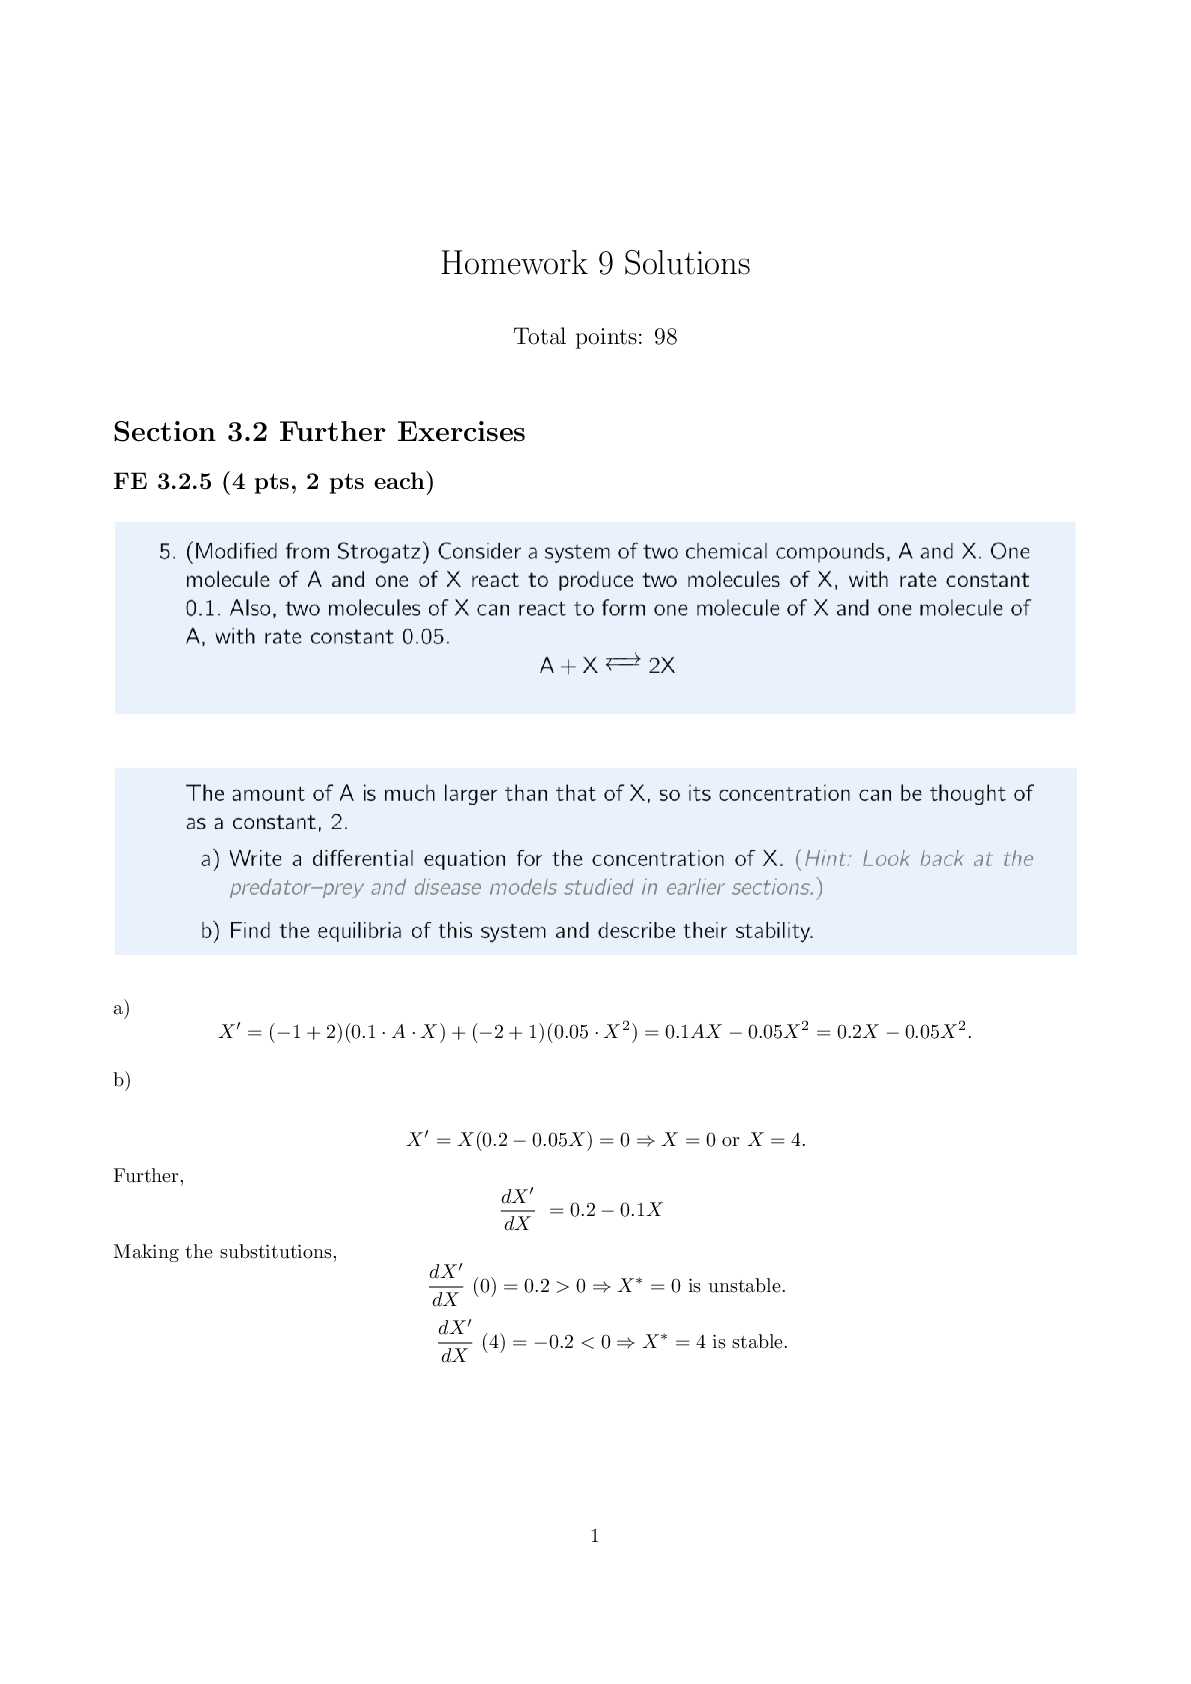
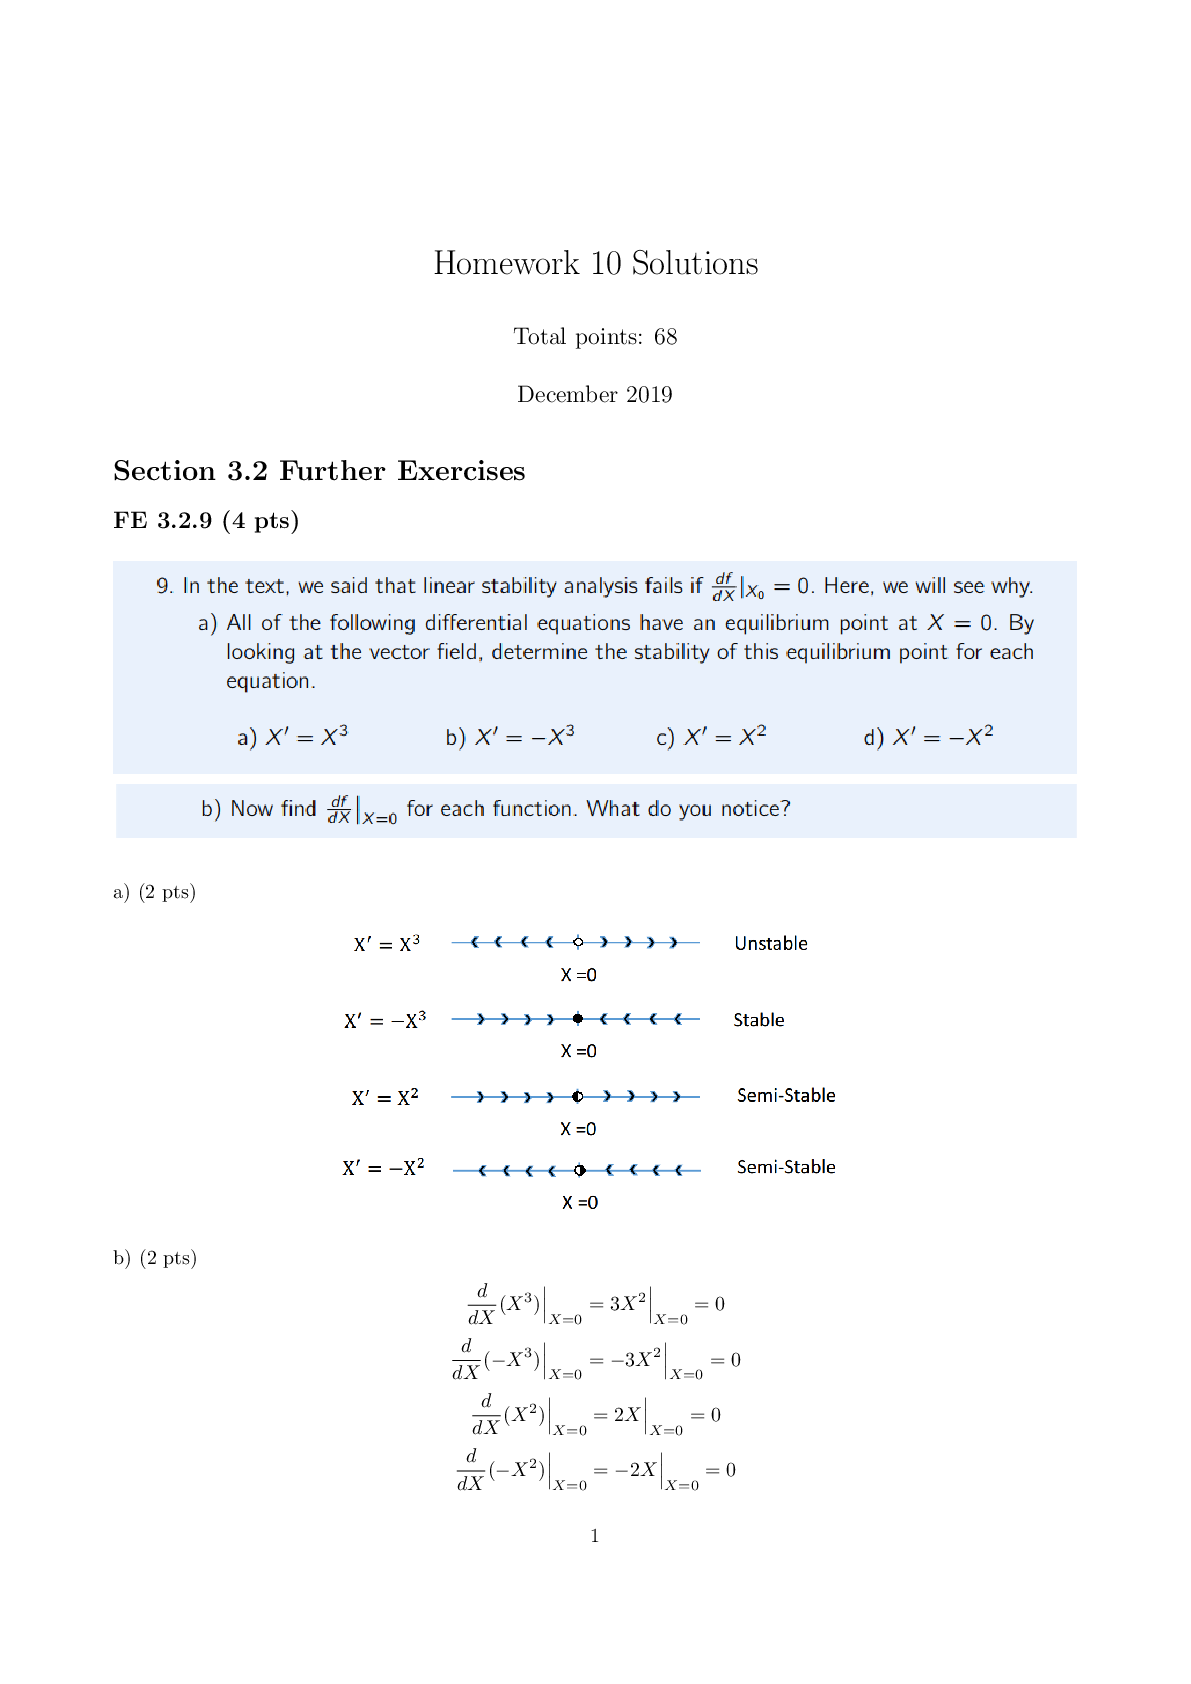
LS 30A Homework 8 Solutions Exercise 3.2.3 Confirm that the equilibria given above are correct. You need to check that Exercise 3.2.4 Find the equilibria of X0 = 0:1X(1 - 800 X ) - 0:05X and use ... test points to determine their stability. Thus, the equilibrium points are X∗ = 0 and X∗ = 400. Now choose a test points from each of the intervals around the equilibrium points to determine their stability: X0(200) = 10 X0(800) = -40 Thus, the equilibrium point X∗ = 0 is unstable (the arrows around it are pointing away from it), while the equilibrium point X∗ = 400 is stable (the arrows around it are pointing at it). Note that since the state space of this model is R>0, there is no interval to the left of 0. Exercise 3.2.6 Why is this true? Equilibrium points are by definition the points X∗ where X0(X∗) = 0. But, the points where the graph of X0 intersects the X-axis are precisely the points where X0 = 0. Hence, they are precisely the equilibrium points. 1 LS 30A Homework 8 Solutions Exercise 3.2.8 Find the equilibria of the differential equation graphical methods" would mean plugging the given expression for N0 into CoCalc (say) and seeing what the graph looks like. For example, you would see that, to the left of N = 50, N0 < 0, and to the right of N = 50, N0 > 0. So, you would conclude that N = 50 is an unstable equilibrium point. Exercise 3.2.9 Do the same thing for the model Y 0 = (1 - 32Y )Y (1 - Y ). Exercise 3.2.10 of the vector field Suppose we try to evaluate the stability of the X = 0 equilibrium point X0 = 2X2 - X 1. Perform a linear stability analysis at the point X = 0. What is the character of this equilibrium point according to this analysis? 2. Suppose we did a test point analysis for confirmation and chose two test points, X = -1 and X = +1. When we calculate the change vectors X0 at these two points, we see that the change vector at X = -1 is positive, analysis. Exercise 3.2.11 Judging by the phase portrait, what is the biological meaning of a? The point X = a represents the critical population density under which the population is not sustainable. For values below a, the population will decline towards 0, while for values above a, the population will increase towards the carrying capacity k. Exercise 3.2 FE 1 A kayaker is paddling directly into the wind but the kayak keeps veering either left or right. 1. Use your physical intuition to explain why the kayaker is having difficulty going straight. 2. The nose of the kayak pointing directly into the wind represents an unstable equilibrium point. If the nose is pointing directly into the wind, the wind is pushing on both sides of the kayak equally and the direction is not changed. However, whenever the kayak gets just a little out of alignment, the direction of the kayak begins to diverge away from the equilibrium point. Exercise 3.2 FE 2 The spread of a genetic mutation in a population of mice can be modeled by the differential equation P0 = 2P · (1 - P) · (1 - 3P) where P is the fraction of the mice that have the new gene. (This means that 0 ≤ P ≤ 1.) 1. Find the equilibruim points of this model and determine the stability of each one. 2. If 10% of the mice have the new gene (so P = 0:1) initially, what fraction of the population will have the new gene in the long run? 3. What if the initial fraction is 90% of the mice? 1. The equilibrium points are P∗ = 0, P∗ = 1 3 . Thus, in the long run, approximately 1 3 of the population will have the new gene. 3. The initial condition P = 90% = 0:9 is also in the basin of attraction of the stable equilibrium point P∗ = 1 LS 30A Homework 8 Solutions Exercise 3.2 FE 5 Consider a system of two chemical compounds, A and X. One molecule of A and one of X react to produce two molecules of X, with rate constant 0.1. Also two molecules of X can react to form one molecule of X and one molecule of A, with rate constant 0.05. A + X 2X The amount of A is much larger than that of X, so its concentration can be thought of as a constant, 2. a) Write a differential equation for the concentration of X. (Hint: Look back at the predator-prey and disease models studied in earlier sections.) b) Find the equilibria of this system and describe their stability. a) time series for the system X0 = X; Y 0 = -Y with four different initial conditions: (X0; Y0) = (-0:1; 0:1); (0:1; 0:1); (-0:1; -0:1); (0:1; -0:1) in reading order. 5 LS 30A Homework 8 Solutions The plots below show time series for the system X0 = -X; Y 0 = Y with four different initial conditions: (X0; Y0) = (-0:1; 0:1); (0:1; 0:1); (-0:1; -0:1); (0:1; -0:1) in reading order. Exercise 3.3 FE 1 Consider the following Romeo and Juliet model, in which (as usual) R e) Choose some initial conditions and use SageMath to simulate this system and plot (at least) (1; 1) spirals in towards (0; 0), we can infer that the equilibrium point at (0; 0) is a stable spiral. Exercise 3.3 FE 2 Repeat the same analysis as in the previous problem, but with the following differential equations: R0 = J J0 = -R + 0:1J a) Verify that this system has one equilibrium point and it is at the origin. d) Plot the vector field in SageMath. Can you determine the type of equilibrium point at the origin now? [Show More]
Last updated: 1 year ago
Preview 1 out of 9 pages
Reviews( 0 )
Document information
Connected school, study & course
About the document
Uploaded On
Apr 12, 2022
Number of pages
9
Written in

Additional information
This document has been written for:
Uploaded
Apr 12, 2022
Downloads
0
Views
60
.png)


.png)