Economics > EXAM > Pennsylvania State University - ECON 102 EXAM 1. All Answers Indicated. 100% Correct. (All)
Pennsylvania State University - ECON 102 EXAM 1. All Answers Indicated. 100% Correct.
Document Content and Description Below
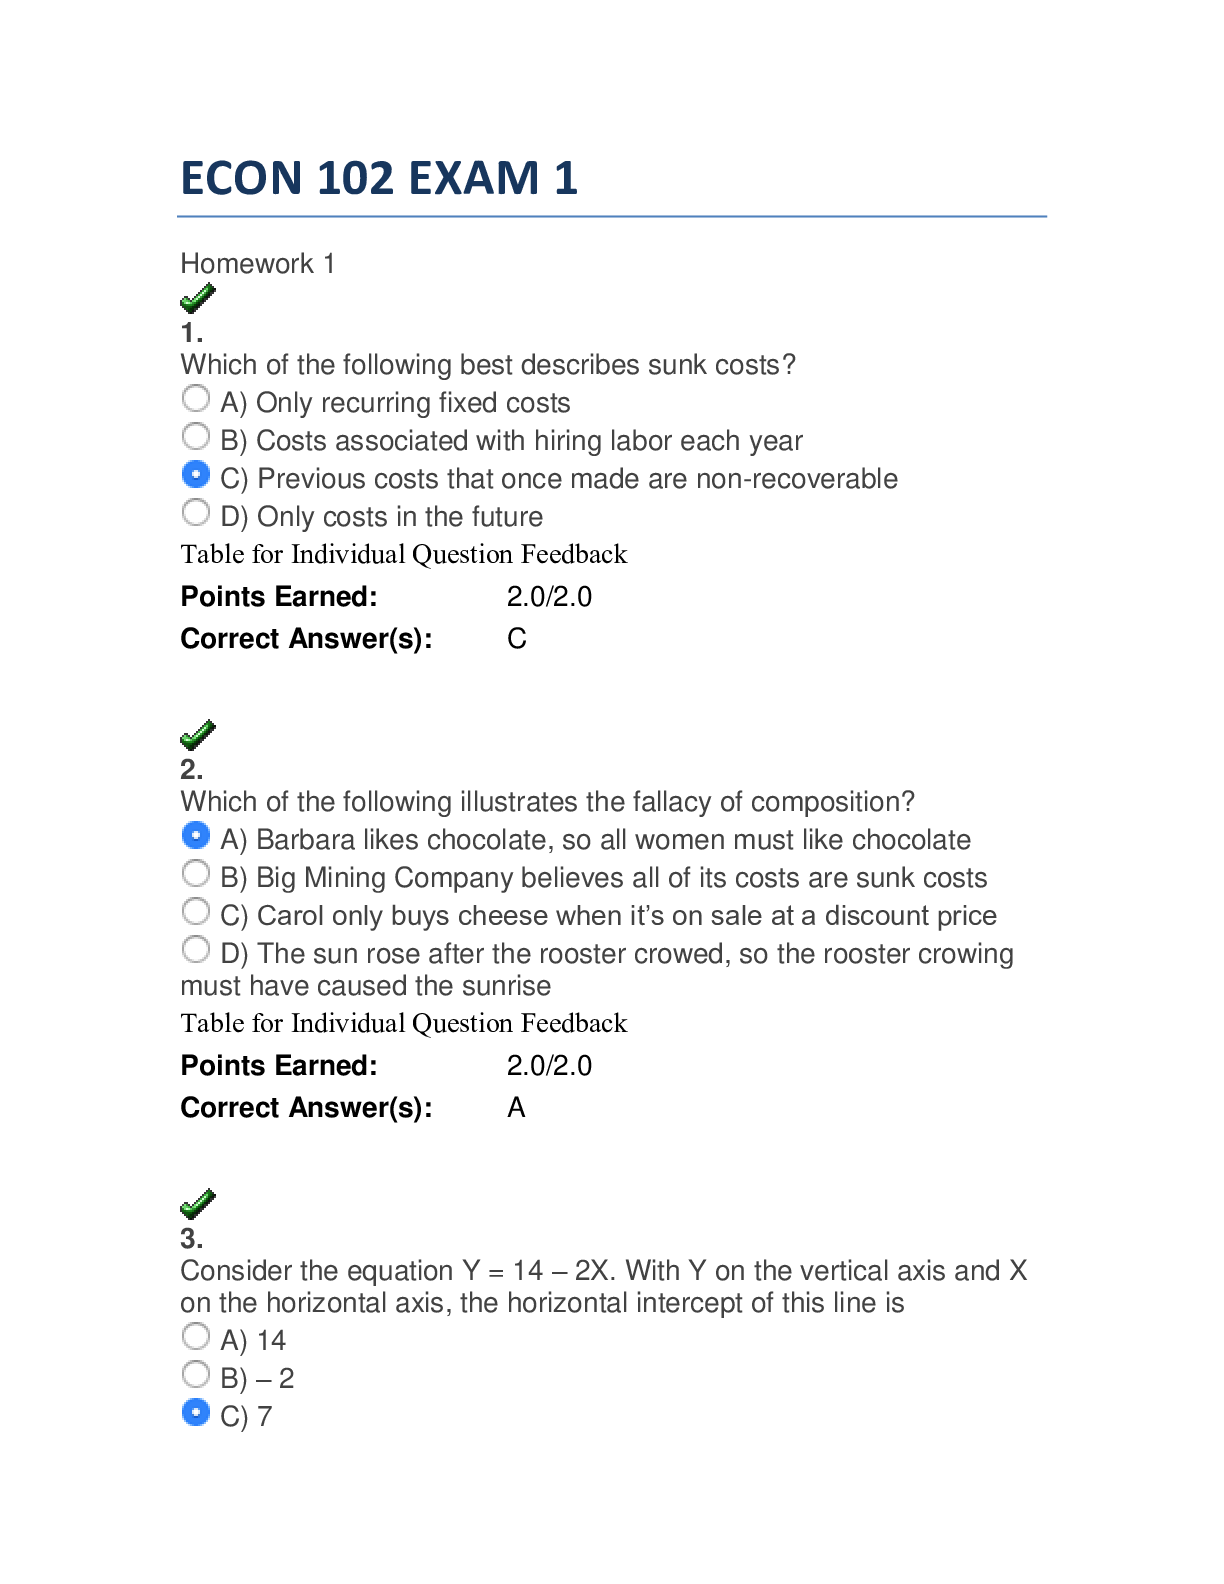
ECON 102 EXAM 1 Homework 1 1. Which of the following best describes sunk costs? A) Only recurring fixed costs B) Costs associated with hiring labor each year C) Previous costs that once... made are non-recoverable D) Only costs in the future Table for Individual Question Feedback C 2. Which of the following illustrates the fallacy of composition? A) Barbara likes chocolate, so all women must like chocolate B) Big Mining Company believes all of its costs are sunk costs C) Carol only buys cheese when it’s on sale at a discount price D) The sun rose after the rooster crowed, so the rooster crowing must have caused the sunrise Table for Individual Question Feedback A 3. Consider the equation Y = 14 – 2X. With Y on the vertical axis and X on the horizontal axis, the horizontal intercept of this line is A) 14 B) – 2 C) 7 D) – (1/7) E) – (1/2) Table for Individual Question Feedback C 4. Consider the equation Y = 14 – 2X. With Y on the vertical axis and X on the horizontal axis, the vertical intercept of this line is A) 14 B) – 2 C) -7 D) – (1/7) E) – (1/2) Table for Individual Question Feedback A 5. Economics is the study of how A) people make money. B) preferences are determined. C) psychology influences preferences.. D) people make choices. Table for Individual Question Feedback D 6. Economics is concerned with choices A) that involve the wants of individuals. B) that involve the political goals of professional associations. C) made by individuals only when they are consuming goods or services. D) that involve making money. Table for Individual Question Feedback A 7. Economics is a part of the A) social sciences. B) natural sciences. C) biological sciences. D) organizational sciences. Table for Individual Question Feedback A 8. One topic of study for a microeconomist would be the A) causes of inflation. B) causes of aggregate unemployment. C) effects of a gasoline price increase on consumer behavior. D) effects of an increase in government spending on overall economic activity. Table for Individual Question Feedback C 9. Macroeconomics deals with A) aggregates within the economy. B) specific sectors within the economy. C) the retail industry only. D) decisions made by firms. Table for Individual Question Feedback A 10. A macroeconomist would study A) the price changes at K-Mart. B) the cost problems at several airlines. C) the economy's unemployment level. D) none of the above. Table for Individual Question Feedback C 11. Which of the following is an example of an application of the ceteris paribus assumption? A) An analysis of how price changes affect how much of a good people will purchase when all other factors are held constant B) An analysis of how people purchase more goods when prices decline and income increases C) After reading an article on the dangers of high-fat diets, an individual buys less red meat when prices increase D) An analysis of how worker productivity increases when a firm invests in new machines and training programs Table for Individual Question Feedback A 12. Professor's economics students are constructing models for how gasoline prices change. Maria's model has very realistic assumptions and is quite complex. Anna's model is less complicated and less realistic. Maria's model correctly predicts gas price increases 5% of the time. Anna's model predicts correctly 15% of the time. On the basis of usefulness or "goodness," Professor will give which student's model the higher grade and why? A) Maria's model gets the higher grade because it is more complex. B) Anna's model gets the higher grade because it is simpler. C) Maria's model gets the higher grade because it is more realistic. D) Anna's model gets the higher grade because it predicts accurately more often. Table for Individual Question Feedback D 13. A positive relationship occurs when A) the two variables being compared change in opposite directions, or when one goes up the other goes down. B) a change in one of the variables causes a change in the other variable in any direction. C) the two variables being compared change in the same direction, or when one goes up the other also goes up. D) the two variables have no identifiable relationship with each other. Table for Individual Question Feedback C 14. In a negative relationship, A) one variable rises while the other falls. B) both variables rise together. C) both variables fall together. D) the two variables have nothing to do with each other. Table for Individual Question Feedback A 15. "No individual should have less than $20,000 income in the United States in 2010" is an example of A) a normative statement. B) a positive statement. C) an illogical and refutable statement. D) a truism. Table for Individual Question Feedback A 16. Which of the following is an example of a positive economic statement? A) In order to reduce the budget deficit, tax rates should be increased. B) In order to increase employment, the minimum wage should be decreased. C) If payroll taxes are raised, then the Social Security crisis will be resolved. D) If gas prices fall, consumers should purchase more gas. Table for Individual Question Feedback C 17. In every economic system, choices must be made because resources A) are unlimited, but human desires and wants are limited. B) are limited, but human desires and wants are unlimited. C) are unlimited, and so are human desires and wants. D) are limited, and so are human desires and wants. Table for Individual Question Feedback B 18. Which of the following statements about economic scarcity is FALSE? A) Scarcity occurs among the poor and the rich. B) Scarcity only occurs if there are shortages and people wait in line to buy things. C) Scarcity results from not having enough resources to produce all the things we want. D) Scarcity results in the necessity to make choices. Table for Individual Question Feedback B 19. Assume Nebraska and Virginia each have 100 acres of farmland. The following table gives hypothetical figures for yield per acre in the two states Who has the absolute advantage in the production of wheat? A) Nebraska B) Virginia C) Both of the above D) None of the above Table for Individual Question Feedback A 20. Who has the absolute advantage in the production of cotton? A) Nebraska B) Virginia C) Both of the above D) None of the above Table for Individual Question Feedback A 21. Who has the comparative advantage in the production of wheat? A) Nebraska B) Virginia C) Both of the above D) None of the above Table for Individual Question Feedback 0.0/3.0 B 22. Who has the comparative advantage in the production of cotton? A) Nebraska B) Virginia C) Both of the above D) None of the above Table for Individual Question Feedback 0.0/3.0 A 23. Suppose the two states decide that they want to produce 590 units of wheat together (not 590 units of wheat each). What is the maximum amount of cotton that they could produce? A) 700 units of cotton B) 630 units of cotton C) 200 units of cotton D) 90 units of cotton Table for Individual Question Feedback 0.0/4.0 B 24. Draw the PPF for , putting wheat on the vertical axis and cotton on the horizontal axis. What is the vertical intercept of Nebraska’s PPF? A) 900 B) 700 C) 500 D) 200 Table for Individual Question Feedback 0.0/3.0 A 25. Draw the PPF for Nebraska, putting wheat on the vertical axis and cotton on the horizontal axis. What is the horizontal intercept of Nebraska’s PPF? A) 900 B) 700 C) 500 D) 200 Table for Individual Question Feedback 0.0/3.0 B 26. Draw the PPF for Virginia, putting wheat on the vertical axis and cotton on the horizontal axis. What is the vertical intercept of Virginia’s PPF? A) 900 B) 700 C) 500 D) 200 Table for Individual Question Feedback 3.0/3.0 C 27. Draw the PPF for Virginia, putting wheat on the vertical axis and cotton on the horizontal axis. What is the horizontal intercept of Virginia’s PPF? A) 900 B) 700 C) 500 D) 200 Table for Individual Question Feedback 0.0/3.0 D 28. The combined PPF for Nebraska and Virginia is shown in the picture above. What is the value of vertical intercept, Y? A) 1800 B) 1400 C) 1000 D) 400 E) 1600 Table for Individual Question Feedback B 29. The combined PPF for Nebraska and Virginia is shown in the picture above. What is the value of horizontal intercept, X? A) 1800 B) 900 C) 500 D) 1200 E) 1400 Table for Individual Question Feedback 0.0/4.0 B 30. The combined PPF for Nebraska and Virginia is shown in the picture above. What is the amount of wheat being produced at point Z? A) 300 B) 400 C) 500 D) 600 E) 700 Table for Individual Question Feedback C 31. The combined PPF for Nebraska and Virginia is shown in the picture above. What is the amount of cotton being produced at point Z? A) 300 B) 400 C) 450 D) 600 E) 700 Table for Individual Question Feedback E 32. The combined PPF for Nebraska and Virginia is shown in the picture above. What is the slope of the PPF between points Y and Z? A) – (7/9) B) – (9/7) C) – (2/5) D) – (5/2) Table for Individual Question Feedback 0.0/4.0 B 33. The combined PPF for Nebraska and Virginia is shown in the picture above. What is the slope of the PPF between points Z and X? A) – (7/9) B) – (9/7) C) – (2/5) D) – (5/2) Table for Individual Question Feedback 0.0/4.0 D 34. You own The Wedding Crasher on DVD. The opportunity cost of watching this DVD for the fourth time A) is zero, since you own it. B) is one-fourth the cost of the DVD, as this is the fourth time you have watched it. C) is the value of the alternative use of the time you spend watching the DVD. D) must be the same as the opportunity cost of watching it the first time. Table for Individual Question Feedback C 35. If you own a condo and you decide to lease it to your cousin, A) there is NOT an opportunity cost of leasing the condo because you own it. B) there IS an opportunity cost of leasing the condo because you could have chosen to live in it. C) there is NOT an opportunity cost of leasing the condo because you collect rent from your cousin. D) there IS an opportunity cost of leasing the condo because you have already made payments on it Table for Individual Question Feedback B 36. If your tuition is $2,000 this semester, your books cost $400, you can only work 10 rather than 40 hours per week during the 15 weeks you are taking classes and you make $12 per hour, and your room and board is $4,000 this semester (same as if not attending college), then your opportunity cost of attending college this semester is A) $2,400. B) $2,760. C) $7,800. D) $11,800. Table for Individual Question Feedback C 37. Video Question. Watch the following video (made by Dave Brown from Penn State Economics). Link here: https://www.youtube.com/watch?v=8DW9ENfRon0. What is true, according to the video? A) Many people consume gasoline, so gas prices are a Macroeconomics topic. B) Gasoline is just one good, so gas prices are a Microeconomics topic. C) If you lose your job, we can discuss how your life is affected in Macroeconomics. D) The overall unemployment rate is discussed in Microeconomics. Table for Individual Question Feedback B 38. Video Question. Watch the following video (made by Dave Brown from Penn State Economics). Link here: https://www.youtube.com/watch?v=ODYE_KaLjA0. According to the video, what is true about the phrase “Rich people should pay more taxes?” A) The statement is positive since most people agree with it B) The statement is positive since rich people don’t pay enough taxes C) The statement is normative because some people disagree with it D) The statement is normative because it is an opinion statement that can’t be tested Table for Individual Question Feedback D Homework 2 1. For the next 6 questions, use the graph above. USING THE MIDPOINT METHOD, what is the absolute value of the price elasticity of demand between P=100 and P=80? A) 0.3333 B) 0.5 C) 0.75 D) 1 E) 1.5 F) 2 G) 2.5 H) 3 I) 3.5 Table for Individual Question Feedback H 2. The value found in the above question is considered to be: A) elastic B) unit elastic C) inelastic Table for Individual Question Feedback A 3. Suppose that at this point, producers raised the price by 5%. What would happen to quantity demanded as a result? A) it would rise by 5% B) it would fall by 5% C) it would rise by more than 5% D) it would fall by more than 5% E) it would rise by less than 5% F) it would fall by less than 5% Table for Individual Question Feedback D 4. USING THE MIDPOINT METHOD, what is the absolute value of the price elasticity of demand between P=40 and P=20? A) 0.3333 B) 0.5 C) 0.75 D) 1 E) 1.5 F) 2 G) 2.5 H) 3 I) 3.5 Table for Individual Question Feedback A 5. The value found in the above question is considered to be: A) elastic B) unit elastic C) inelastic Table for Individual Question Feedback C 6. Suppose that at this point, producers raised the price by 5%. What would happen to quantity demanded as a result? A) it would rise by 5% B) it would fall by 5% C) it would rise by more than 5% D) it would fall by more than 5% E) it would rise by less than 5% F) it would fall by less than 5% Table for Individual Question Feedback F 7. The following graph below represents a linear demand function. Use the graph below to answer the following questions. Elasticity values are greater than 1 (in absolute value) in the portion of the graph described by letter _____. A) a B) b C) c Table for Individual Question Feedback A 8. Elasticity values are less than 1 (in absolute value) in the portion of the graph described by letter _____. A) a B) b C) c Table for Individual Question Feedback C 9. Elasticity values are exactly equal to 1 in absolute value in the portion of the graph described by letter _____. A) a B) b C) c Table for Individual Question Feedback B 10. The inelastic portion of the graph is the area described by letter _____. A) a B) b C) c Table for Individual Question Feedback C 11. The unit elastic portion of the graph is the area described by letter _____. A) a B) b C) c Table for Individual Question Feedback B 12. The elastic portion of the graph is the area described by letter _____. A) a B) b C) c Table for Individual Question Feedback A 13. Total revenue is maximized over the portion of the graph described by letter ______. A) a B) b C) c Table for Individual Question Feedback B 14. Suppose we are somewhere in portion “c” on the graph and the firm raises the price of the good by a small amount. What happens to total revenue? A) Total revenue will increase B) Total revenue will decrease C) Total revenue will stay the same Table for Individual Question Feedback A 15. Suppose we are somewhere in portion “a” on the graph and the firm raises the price of the good by a small amount. What happens to total revenue? A) Total revenue will increase B) Total revenue will decrease C) Total revenue will stay the same Table for Individual Question Feedback B 16. Suppose that the firm lowered prices by 2%, and in response, consumers purchased 6% more of the good. We know that we are somewhere on the portion labeled by letter _________. A) a B) b C) c D) not enough information to answer Table for Individual Question Feedback A 17. For the next 5 questions, consider the following market for Blu-Ray players. Demand: Qd = 400 – 3P Supply: Qs = –100 + 2P Given these equations, what are the equilibrium price and quantity? Equilibrium price is Equilibrium quantity is Table for Individual Question Feedback 0.0/4.0 Box 1: 100, $100, $100.00; Box 2: 100 18. Suppose the actual market price of Blu-Ray players is $92. What is the quantity demanded and quantity supplied at this price? Quantity demanded is Quantity supplied is Table for Individual Question Feedback 0.0/4.0 Box 1: 124; Box 2: 84 19. At this price of $92, will there be a shortage or a surplus of Blu-Ray players? A) Shortage B) Surplus Table for Individual Question Feedback A 20. What is the amount of this shortage or surplus? The shortage or surplus is Blu-Ray players. Table for Individual Question Feedback 40 21. Over time, do you expect the price of Blu-Ray players to rise or fall? A) expect the price to rise B) expect the price to fall Table for Individual Question Feedback A 22. For the next 5 questions, consider the following market for digital cameras. Demand: Qd = 500 – 2P Supply: Qs = –80 + 3P Given these equations, what are the equilibrium price and quantity? Equilibrium price is Equilibrium quantity is Table for Individual Question Feedback 0.0/4.0 Box 1: 116, $116, $116.00; Box 2: 268 23. Suppose the actual market price of digital cameras is $128. What is the quantity demanded and quantity supplied at this price? Quantity demanded is Quantity supplied is Table for Individual Question Feedback 0.0/4.0 Box 1: 244; Box 2: 304 24. At this price of $128, will there be a shortage or a surplus of digital cameras? A) Shortage B) Surplus Table for Individual Question Feedback B 25. What is the amount of this shortage or surplus? The shortage or surplus is digital cameras. Table for Individual Question Feedback 0.0/4.0 60 26. Over time, do you expect the price of digital cameras to rise or fall? A) expect the price to rise B) expect the price to fall Table for Individual Question Feedback B 27. Suppose guitars and guitar strings are complements in consumption. What will happen in the market for guitars if the price of guitar strings decreases? A) There will be an increase in quantity demanded for guitars B) There will be a decrease in quantity demanded for guitars C) There will be an increase in demand for guitars D) There will be a decrease in demand for guitars Table for Individual Question Feedback C 28. Based on your answer, what will happen to the equilibrium price of guitars? A) increase B) decrease C) remain the same D) could do any of the above Table for Individual Question Feedback 0.0/4.0 A 29. What will happen to the equilibrium quantity of guitars? A) increase B) decrease C) remain the same D) could do any of the above Table for Individual Question Feedback A 30. Consider another good, bread. Which of the following would cause a leftward shift in the demand for bread? A) an increase in the production costs involved in making bread B) a decrease in consumer income, assuming that bread is a normal good C) an increase in consumer income, assuming that bread is a normal good D) a decrease in the price of jelly, which is a complement to bread Table for Individual Question Feedback B 31. Watch the following video (made by Dave Brown from Penn State Economics). Link here:https://www.youtube.com/watch?v=P9jj_rIVbeg. The video details the complexities that can arise if there are simultaneous shifts in demand and supply. Based on the analysis done in the video, what is the net effect on equilibrium price if there is a simultaneous increase in demand and an increase in supply? A) Equilibrium price will always go up B) Equilibrium price will always go down C) Equilibrium price could go up or down Table for Individual Question Feedback 0.0/3.0 C 32. Based on the analysis done in the video, what is the net effect on equilibrium quantity if there is a simultaneous increase in demand and an increase in supply? A) Equilibrium quantity will always increase B) Equilibrium quantity will always decrease C) Equilibrium quantity could increase or decrease Table for Individual Question Feedback 0.0/3.0 A 33. Using the same analysis done in the video, draw for yourself the situation of a simultaneous decrease in demand and increase in supply. Based on your graphs, what is the net effect on equilibrium price? A) Equilibrium price will always go up B) Equilibrium price will always go down C) Equilibrium price could go up or down Table for Individual Question Feedback 3.0/3.0 B 34. Using the same analysis done in the video, draw for yourself the situation of a simultaneous decrease in demand and increase in supply. Based on your graphs, what is the net effect on equilibrium quantity? A) Equilibrium quantity will always increase B) Equilibrium quantity will always decrease C) Equilibrium quantity could increase or decrease Table for Individual Question Feedback 0.0/3.0 C Quiz 2 Mark can produce 40 baseballs in a month and Katie can produce 30 baseballs in a month. Also, Mark can produce 10 bats in a month and Katie can produce 5 bats in a month. What is Mark’s opportunity cost of producing 20 bats? A) 20 baseballs. B) None of these C) 40 baseballs. D) 30 baseballs. E) 10 baseballs. Feedback: It would take Mark 2 months to produce 30 bats. In that time, Mark could have produced 80 baseballs. Table for Individual Question Feedback 0.0/1.0 B 2. Mark can produce 60 baseballs in a month and Katie can produce 42 baseballs in a month. Also, Mark can produce 40 bats in a month and Katie can produce 30 bats in a month. What is Katie’s opportunity cost of producing 10 bats? A) 12 baseballs. B) None of these C) 126 baseballs. D) 14 baseballs. E) 42 baseballs. Feedback: It would take Katie 1/3 of a month to produce 10 bats. In that time, Katie could have produced 40 baseballs. Table for Individual Question Feedback 1.0/1.0 D 3. Mark can produce 6 guitars in a month and Katie can produce 5 guitars in a month. Also, Mark can produce 8 banjos in a month and Katie can produce 2 banjos in a month ______________has the absolute advantage in the production of banjos, and _____________ has the comparative advantage in the production of banjos. A) Mark; Mark B) Katie; Katie C) Katie; Mark D) Mark; Katie Feedback: Mark can produce more banjos in a month than Katie can, so Mark has the absolute advantage in the production of banjos. Also, Mark’s opportunity cost of producing a given number of banjos is lower than Katie’s, so Mark has the comparative advantage in the production of banjos. Table for Individual Question Feedback 0.0/1.0 A 4. Which of the following is most likely to shift the PPC out and to the right? A) A decrease in the unemployment rate. B) A change in the preferences of the country’s population. C) The discovery of a new technology. D) An increase in the unemployment rate. Feedback: A new technology will allow the country to produce more with its existing resources which will shift its PPC out and to the right. Table for Individual Question Feedback 0.0/1.0 C 5. Consider the following table which shows the yield per acre of cotton and wheat in two countries, USA and Mexico: _____________ has the absolute advantage in the production of cotton, and __________ has the comparative advantage in the production of cotton. YIELD PER ACRE USA Mexico Cotton 25 20 Wheat 30 15 A) Mexico; USA. B) USA; USA. C) USA; Mexico. D) Mexico; Mexico. Feedback: USA can produce a given amount of cotton using fewer resources than Mexico, but Mexico can produce a given amount of cotton at a lower opportunity cost than USA. Table for Individual Question Feedback 1.0/1.0 C 6. Consider the following table which shows the yield per acre of cotton and wheat in two countries, USA and Mexico: In USA, the opportunity cost of producing 20 units of cotton is YIELD PER ACRE USA Mexico Cotton 8 9 Wheat 5 12 A) 40 units of wheat. B) 12.5 units of wheat. C) None of these D) 30 units of wheat. E) 22.5 units of wheat. Feedback: USA would have to use 2.5 acres of land to produce 20 units of cotton. Had they chosen to use that land for the production of wheat, they could have produced 12.5 units of wheat. Table for Individual Question Feedback 1.0/1.0 B 7. Assume Oklahoma and South Dakota each have 100 acres of farmland. The following table gives hypothetical figures for yield per acre in the two states: Suppose the two states decide that they want to produce 600 total units of wheat. What is the maximum amount of corn that they could produce? South Dakota Oklahoma Wheat 5 2 Corn 6 3 A) 150 units of corn B) 250 units of corn C) None of these D) 300 units of corn E) 120 units of corn Feedback: South Dakota has the comparative advantage in the production of wheat, so they should produce wheat. South Dakota can only produce 500 units of wheat. In order to get 600 total units of wheat, Oklahoma would have to produce the other 100 units of wheat. This would leave them 50 acres of land that they could use to produce corn, so they could produce 150 units of corn. Table for Individual Question Feedback 1.0/1.0 A 8. Refer to Figure 1. Which point would best represent a combination of goods that is not feasible? A) A B) B C) C D) D Feedback: Points outside the Production Possibilities Frontier are not feasible. Table for Individual Question Feedback 1.0/1.0 D 9. Refer to Table 2. Suppose the country is producing 20 units of capital goods. What is the opportunity cost of producing an additional 10 units of capital goods? Table 2 Capital Goods Consumer Goods 0 105 10 100 20 90 30 75 40 55 50 30 60 0 A) 15 units of consumer goods. B) 90 units of consumer goods. C) None of these D) 75 units of consumer goods. E) 10 units of consumer goods. Feedback: The country would have to reduce its production of consumer goods from 90 to 75. So they would give up 15 units of consumer goods. Table for Individual Question Feedback 0.0/1.0 A 10. Assume Oklahoma and South Dakota each have 100 acres of farmland. The following table gives hypothetical figures for yield per acre in the two states: What is the marginal rate of transformation between wheat and corn in Oklahoma? South Dakota Oklahoma Wheat 5 2 Corn 6 3 A) None of these B) -2/5 C) -5/2 D) -2/3 E) -2 Feedback: Oklahoma gives up 2/3 of a unit of wheat for every unit of corn it produces, so the MRT is -2/3. Table for Individual Question Feedback 0.0/1.0 D When the percent change in price is equal to the percent change in quantity demanded, we say that the demand is A) inelastic B) perfectly inelastic C) unit elastic D) elastic Feedback: When the percent change in price is equal to the percent change in quantity demanded, the demand curve can be described as unit elastic. Table for Individual Question Feedback 1.0/1.0 C 2. Demand tends to be relatively inelastic A) when the good is a luxury B) in more broadly defined markets C) in the long run D) when there are many substitutes available Feedback: Broadly defined markets tend to have relatively inelastic demands. Table for Individual Question Feedback 0.0/1.0 B 3. Consider the graph above. Between points a and b, the slope of the demand curve is ______ and the elasticity is ________ in absolute value. A) -0.125, 1.67 B) 8, 0.6 C) 8, 1.67 D) -0.125, 0.6 Feedback: Use the midpoint method to calculate the price elasticity of demand. Table for Individual Question Feedback 0.0/1.0 A 4. Consider the graph above. The demand curve is divided into three segments, the segments are labeled a, b and c. Area a can be described as A) elastic B) inelastic C) perfectly elastic D) unit elastic Feedback: The price elasticity of demand decreases in absolute value as you move down along the downward sloping demand curve. Table for Individual Question Feedback 1.0/1.0 A 5. Consider the linear demand curve above. As price falls, the slope along this demand curve is ________, and the price elasticity is _________ in absolute value. A) falling, constant B) falling, falling C) constant, constant D) constant, falling Feedback: The slope of a straight line is constant. The price elasticity of demand however changes along the linear demand. Table for Individual Question Feedback 1.0/1.0 D 6. Consider the figure above. As price decreases over area a, total revenue is A) unchanged B) decreasing C) increasing D) maximized Feedback: As price falls over the elastic region of the demand curve, total revenue rises. Table for Individual Question Feedback 1.0/1.0 C 7. Consider the figure above. Lowering price from $2.00 to $1.50 would A) increase total revenue by $1 B) decrease total revenue by $1 C) increase total revenue by $4 D) leave total revenue unchanged Feedback: Total revenue is calculated by multiplying price times quantity. Table for Individual Question Feedback 1.0/1.0 A 8. If the cross price elasticity of demand equals -0.5 then the goods are A) substitutes B) inferior C) complements D) unrelated goods Feedback: If when the price of good one rises, less of good two is purchased, then the goods are complements. Table for Individual Question Feedback 1.0/1.0 C 9. When the price of bagels increases by 25%, the quantity supplied increases by 30%. The price elasticity of supply is A) 0.833 and inelastic B) 0.833 and elastic C) 1.20 and inelastic D) 1.20 and elastic Feedback: The price elasticity of supply is calculated as the percent change in quantity supplied divided by the percent change in price. Table for Individual Question Feedback 1.0/1.0 D 10. There are some government programs that pay farmers not to plant wheat on part of their land. This would help farmers A) by increasing total revenue but it hurts consumers by increasing prices for wheat B) by increasing total revenue and it also helps consumers by lowering the price of wheat C) since the government payment will increase income to farmers and it helps consumers too by lowering the price of wheat D) since the government payment will reduce the costs of production and increase the supply of wheat Feedback: The government payment forces farmers to decrease production. Supply shifts to the left and the price of wheat rises while total revenue to farmers rises since the demand for wheat tends to be relatively inelastic. Table for Individual Question Feedback 1.0/1.0 A 1. Mark can produce 40 baseballs in a month and Katie can produce 30 baseballs in a month. Also, Mark can produce 10 bats in a month and Katie can produce 5 bats in a month. What is Mark’s opportunity cost of producing 20 bats? A) 20 baseballs. B) None of these C) 40 baseballs. D) 30 baseballs. E) 10 baseballs. Feedback: It would take Mark 2 months to produce 30 bats. In that time, Mark could have produced 80 baseballs. Table for Individual Question Feedback 0.0/1.0 B 2. Mark can produce 60 baseballs in a month and Katie can produce 42 baseballs in a month. Also, Mark can produce 40 bats in a month and Katie can produce 30 bats in a month. What is Katie’s opportunity cost of producing 10 bats? A) 12 baseballs. B) None of these C) 126 baseballs. D) 14 baseballs. E) 42 baseballs. Feedback: It would take Katie 1/3 of a month to produce 10 bats. In that time, Katie could have produced 40 baseballs. Table for Individual Question Feedback 1.0/1.0 D 3. Mark can produce 6 guitars in a month and Katie can produce 5 guitars in a month. Also, Mark can produce 8 banjos in a month and Katie can produce 2 banjos in a month ______________has the absolute advantage in the production of banjos, and _____________ has the comparative advantage in the production of banjos. A) Mark; Mark B) Katie; Katie C) Katie; Mark D) Mark; Katie Feedback: Mark can produce more banjos in a month than Katie can, so Mark has the absolute advantage in the production of banjos. Also, Mark’s opportunity cost of producing a given number of banjos is lower than Katie’s, so Mark has the comparative advantage in the production of banjos. Table for Individual Question Feedback 0.0/1.0 A 4. Which of the following is most likely to shift the PPC out and to the right? A) A decrease in the unemployment rate. B) A change in the preferences of the country’s population. C) The discovery of a new technology. D) An increase in the unemployment rate. Feedback: A new technology will allow the country to produce more with its existing resources which will shift its PPC out and to the right. Table for Individual Question Feedback 0.0/1.0 C 5. Consider the following table which shows the yield per acre of cotton and wheat in two countries, USA and Mexico: _____________ has the absolute advantage in the production of cotton, and __________ has the comparative advantage in the production of cotton. YIELD PER ACRE USA Mexico Cotton 25 20 Wheat 30 15 A) Mexico; USA. B) USA; USA. C) USA; Mexico. D) Mexico; Mexico. Feedback: USA can produce a given amount of cotton using fewer resources than Mexico, but Mexico can produce a given amount of cotton at a lower opportunity cost than USA. Table for Individual Question Feedback 1.0/1.0 C 6. Consider the following table which shows the yield per acre of cotton and wheat in two countries, USA and Mexico: In USA, the opportunity cost of producing 20 units of cotton is YIELD PER ACRE USA Mexico Cotton 8 9 Wheat 5 12 A) 40 units of wheat. B) 12.5 units of wheat. C) None of these D) 30 units of wheat. E) 22.5 units of wheat. Feedback: USA would have to use 2.5 acres of land to produce 20 units of cotton. Had they chosen to use that land for the production of wheat, they could have produced 12.5 units of wheat. Table for Individual Question Feedback 1.0/1.0 B 7. Assume Oklahoma and South Dakota each have 100 acres of farmland. The following table gives hypothetical figures for yield per acre in the two states: Suppose the two states decide that they want to produce 600 total units of wheat. What is the maximum amount of corn that they could produce? South Dakota Oklahoma Wheat 5 2 Corn 6 3 A) 150 units of corn B) 250 units of corn C) None of these D) 300 units of corn E) 120 units of corn Feedback: South Dakota has the comparative advantage in the production of wheat, so they should produce wheat. South Dakota can only produce 500 units of wheat. In order to get 600 total units of wheat, Oklahoma would have to produce the other 100 units of wheat. This would leave them 50 acres of land that they could use to produce corn, so they could produce 150 units of corn. Table for Individual Question Feedback 1.0/1.0 A 8. Refer to Figure 1. Which point would best represent a combination of goods that is not feasible? A) A B) B C) C D) D Feedback: Points outside the Production Possibilities Frontier are not feasible. Table for Individual Question Feedback 1.0/1.0 D 9. Refer to Table 2. Suppose the country is producing 20 units of capital goods. What is the opportunity cost of producing an additional 10 units of capital goods? Table 2 Capital Goods Consumer Goods 0 105 10 100 20 90 30 75 40 55 50 30 60 0 A) 15 units of consumer goods. B) 90 units of consumer goods. C) None of these D) 75 units of consumer goods. E) 10 units of consumer goods. Feedback: The country would have to reduce its production of consumer goods from 90 to 75. So they would give up 15 units of consumer goods. Table for Individual Question Feedback 0.0/1.0 A 10. Assume Oklahoma and South Dakota each have 100 acres of farmland. The following table gives hypothetical figures for yield per acre in the two states: What is the marginal rate of transformation between wheat and corn in Oklahoma? South Dakota Oklahoma Wheat 5 2 Corn 6 3 A) None of these B) -2/5 C) -5/2 D) -2/3 E) -2 Feedback: Oklahoma gives up 2/3 of a unit of wheat for every unit of corn it produces, so the MRT is -2/3. Table for Individual Question Feedback 0.0/1.0 D 1. The market demand curve for Cheerios is A) the sum of the quantities of Cheerios that all households in the market demand. B) the average of the prices of Cheerios that all households in the market demand. C) the sum of the prices of Cheerios that all households in the market demand. D) the average of the quantities of Cheerios that all households in the market demand. Feedback: Market demand is the sum of individual households’ demands. Table for Individual Question Feedback 1.0/1.0 A 2. For a normal good, when income increases, A) demand increases. B) supply increases. C) supply decreases. D) demand decreases. Feedback: When income increases demand increases for a normal good. Table for Individual Question Feedback 1.0/1.0 A 3. In the above figure, a decrease in the price of a complement for a product is represented by A) the movement from P0 to P1 in Graph B. B) the movement from D0 to D1 in Graph A. C) the movement from P1 to P0 in Graph B. D) the movement from D1 to D0 in Graph A. Feedback: A decrease in the price of a complement causes an increase in demand. This is represented in Graph A by a movement from D0 to D1. Table for Individual Question Feedback 0.0/1.0 B 4. The law of supply states that A) as price rises, quantity supplied will remain constant, ceteris paribus. B) as price rises, quantity supplied will rise, and vice versa, ceteris paribus. C) None of the above is correct. D) as price rises, quantity supplied will fall, and vice versa, ceteris paribus. Feedback: The law of supply states that as price rises, quantity supplied will rise, and vice versa. Table for Individual Question Feedback 1.0/1.0 B 5. Each of the following would cause a decrease in the supply of corn EXCEPT A) a season of unfavorable weather. B) an increase in the price of soybeans. C) an increase in the wage rate for agricultural workers. D) an advancement in technology used to produce corn. Feedback: A technological advancement will cause an increase in supply. The other options cause a decrease in the supply of corn. Table for Individual Question Feedback 1.0/1.0 D 6. An increase in quantity supplied is demonstrated by A) a rightward movement along the supply curve. B) a rightward shift of the supply curve. C) a leftward shift of the supply curve. D) a leftward movement along the supply curve. Feedback: An increase in supply is shown by a rightward shift of the entire supply curve. In contrast, an increase in quantity supplied is shown by a movement along the supply curve. Table for Individual Question Feedback 0.0/1.0 A 7. In the above figure, a shortage will occur in the market at a price of A) None of these. B) P1. C) P2. D) P0. Feedback: At a price of P2, quantity demanded is greater than quantity supplied, so we have a shortage. Table for Individual Question Feedback 1.0/1.0 C 8. What happens to equilibrium price and quantity in the market for steak when there is a simultaneous increase in the price of chicken (which is typically consumed in place of steak) and an increase in the price of corn (which is an input in the production of steak)? A) We expect equilibrium price to decrease, but equilibrium quantity is indeterminate. B) We expect equilibrium quantity to increase, but equilibrium price is indeterminate. C) We expect equilibrium quantity to decrease, but equilibrium price is indeterminate. D) We expect equilibrium price to increase, but equilibrium quantity is indeterminate. Feedback: When demand increases and supply decreases, we know that equilibrium price will increase. However, the degree of the changes is needed in order to know whether equilibrium quantity will increase or decrease. Table for Individual Question Feedback 1.0/1.0 D 9. Which of the figures above would be an appropriate representation of the effects of an advancement in technology of the production of a product? A) Figure 1 B) Figure 3 C) Figure 4 D) Figure 2 Feedback: Figure 1 refers to an increase in supply. Table for Individual Question Feedback 1.0/1.0 A 10. An effective price floor A) creates a surplus. B) creates a shortage. C) results in an efficient market outcome. D) results in an equilibrium market outcome. Feedback: An effective price floor results in excess supply, which creates a surplus. Table for Individual Question Feedback 1.0/1.0 A 1. The law of demand states that there is a ________ relationship between price and quantity demanded. A) increasing B) direct C) positive D) negative Feedback: The law of demand states that there is a negative relationship between price and quantity demanded. Table for Individual Question Feedback 1.0/1.0 D 2. Which of the following are the best examples of substitutes? A) pasta and tomato sauce B) golf balls and golf clubs C) iPods and earphones D) pens and pencils Feedback: Pens and pencils are the best examples of substitutes because they can be consumed in place of each other. The other examples are complements because they are typically consumed together. Table for Individual Question Feedback 1.0/1.0 D 3. In the above figure, a decrease in the price of the product is represented by A) the movement from P0 to P1 in Graph B. B) the movement from P1 to P0 in Graph B. C) the movement from D1 to D0 in Graph A. D) the movement from D0 to D1 in Graph A. Feedback: A change in the price of the product is represented by a movement along the demand curve, which is represented in Graph B. The decrease in the price is a movement from P0 to P1. Table for Individual Question Feedback 1.0/1.0 A 4. A supply curve A) slopes downward because of the negative relationship between price and quantity supplied. B) slopes upward because of the positive relationship between price and quantity supplied. C) slopes upward because of the negative relationship between price and quantity supplied. D) slopes downward because of the positive relationship between price and quantity supplied. Feedback: The supply curve slopes upward because of a positive relationship between price and quantity supplied, ceteris paribus. Table for Individual Question Feedback 1.0/1.0 B 5. Which of the following will cause a shift of the entire supply curve? A) A change in the price of the product. B) A change in the price of an input. C) A change in the price of a substitute. D) A change in consumers' income. Feedback: The cost of an input is a determinant of supply. Table for Individual Question Feedback 0.0/1.0 B 6. A decrease in the quantity supplied of pizza in State College could be caused by A) an increase in the supply of spaghetti in State College. B) a decrease of the price of pizza in State College. C) an increase in income for most people who live in State College. D) an increase in the price of cheese and tomato sauce in State College. Feedback: A change in quantity supplied can only be caused by a change in the price of that good. In this case, a decrease in quantity supplied could only be caused by decrease in the price of pizza in State College. An increase in income causes an increase in the demand for pizza. An increase in the price of cheese and tomato sauce causes a decrease in the supply of pizza. An increase in the supply of spaghetti will probably cause a decrease in the supply of pizza. Table for Individual Question Feedback 0.0/1.0 B 7. A surplus occurs in a market when A) there is excess supply at the prevailing price. B) there is excess demand at the prevailing price. C) producers sell all of the product that they have supplied to the market at the prevailing price. D) there is neither excess demand nor excess supply in the market at the prevailing price. Feedback: A surplus occurs when there is excess supply, or quantity supplied is greater than quantity demanded, at the prevailing price. Table for Individual Question Feedback 1.0/1.0 A 8. What happens to the equilibrium price and quantity of deli ham when the price of deli turkey decreases? (Assume that deli ham and deli turkey are consumed in place of each other.) A) We expect equilibrium price to increase and equilibrium quantity to decrease. B) We expect equilibrium price to decrease and equilibrium quantity to increase. C) We expect equilibrium price and equilibrium quantity to decrease. D) We expect equilibrium price and equilibrium quantity to increase. Feedback: When income the price of deli turkey decreases, the demand for deli ham decreases. Therefore equilibrium price and quantity both decrease. Table for Individual Question Feedback 0.0/1.0 C 9. In the above figure, if the supply curve moves from S0 to S1 and the demand curve remains at D0. which of the following statements is TRUE? A) Supply has decreased. B) Supply has increased. C) Quantity supplied has decreased. Feedback: A rightward shift in the supply curve is an increase in supply. Table for Individual Question Feedback 0.0/1.0 B 10. In the above figure, a price floor of $0.75 would result in A) a remainder of 200. B) a surplus of 200. C) a shortage of 200. D) the equilibrium market outcome. Feedback: A price floor below equilibrium price is ineffective in that it results in the equilibrium market outcome. Table for Individual Question Feedback 0.0/1.0 D 1. If demand is inelastic then A) consumers respond substantially to price changes B) sellers respond substantially to price changes C) consumers do not respond substantially to price changes D) sellers do not respond substantially to price changes Feedback: With an inelastic demand, an increase in price will lead to a reduction in quantity demanded that is smaller (in percentage terms) than the price increase. Table for Individual Question Feedback 0.0/1.0 C 2. A good that is a necessity is likely to have a relatively _______ demand. A) inelastic B) unit elastic C) perfectly elastic D) elastic Feedback: If a good is a necessity, people will not reduce consumption by very much when the price rises. Table for Individual Question Feedback 1.0/1.0 A 3. When the price elasticity of demand is larger than 1 in absolute value, demand is A) inelastic B) unit elastic C) elastic D) perfectly elastic Feedback: When the price elasticity of demand is greater than 1 in absolute value, demand is elastic. Table for Individual Question Feedback 1.0/1.0 C 4. Consider the figure above. Which curve is the least elastic? A) c B) a C) b D) all are equally elastic Feedback: The steeper the curve, the less elastic it is. Table for Individual Question Feedback 0.0/1.0 B 5. Consider the linear demand curve above. As price falls, the slope along this demand curve is ________, and the price elasticity is _________ in absolute value. A) constant, falling B) constant, constant C) falling, constant D) falling, falling Feedback: The slope of a straight line is constant. The price elasticity of demand however changes along the linear demand. Table for Individual Question Feedback 0.0/1.0 A 6. Consider the figure above. If the price increases from $0.50 to $1.00, then total revenue A) increases by $3 and demand is considered to be inelastic B) increases by $3 and demand is considered to be elastic C) decreases by $3 and demand is considered to be inelastic D) decreases by $3 and demand is considered to be elastic Feedback: When demand is inelastic, total revenue and price move in the same direction. Table for Individual Question Feedback 1.0/1.0 A 7. Consider the figure above. Lowering price from $2.00 to $1.50 would A) leave total revenue unchanged B) decrease total revenue by $1 C) increase total revenue by $4 D) increase total revenue by $1 Feedback: Total revenue is calculated by multiplying price times quantity. Table for Individual Question Feedback 0.0/1.0 D 8. If the cross price elasticity of demand equals -0.5 then the goods are A) substitutes B) complements C) inferior D) unrelated goods Feedback: If when the price of good one rises, less of good two is purchased, then the goods are complements. Table for Individual Question Feedback 1.0/1.0 B 9. When the price of bagels increases by 25%, the quantity supplied increases by 30%. The price elasticity of supply is A) 0.833 and elastic B) 1.20 and inelastic C) 1.20 and elastic D) 0.833 and inelastic Feedback: The price elasticity of supply is calculated as the percent change in quantity supplied divided by the percent change in price. Table for Individual Question Feedback 1.0/1.0 C 10. Suppose you are a producer that sells products to two groups of buyers. These groups of buyers have no contact with one another. Group 1 has a relatively elastic demand curve and group 2 has a relatively inelastic demand curve. If your goal is to maximize total revenue you should A) charge both groups the same price B) charge group 1 a lower price than group 2 C) increase the price to both groups D) charge group 2 a lower price than group 1 Feedback: When demand is elastic, a decrease in price will increase total revenue. Table for Individual Question Feedback 0.0/1.0 B [Show More]
Last updated: 1 year ago
Preview 1 out of 65 pages
Reviews( 0 )
Document information
Connected school, study & course
About the document
Uploaded On
Oct 04, 2020
Number of pages
65
Written in

Additional information
This document has been written for:
Uploaded
Oct 04, 2020
Downloads
2
Views
140


.png)

.png)