Mathematics > QUESTIONS & ANSWERS > Questions and Answers > Colorado Technical University MATH 451-1404B-Transportation Model (All)
Questions and Answers > Colorado Technical University MATH 451-1404B-Transportation Model
Document Content and Description Below
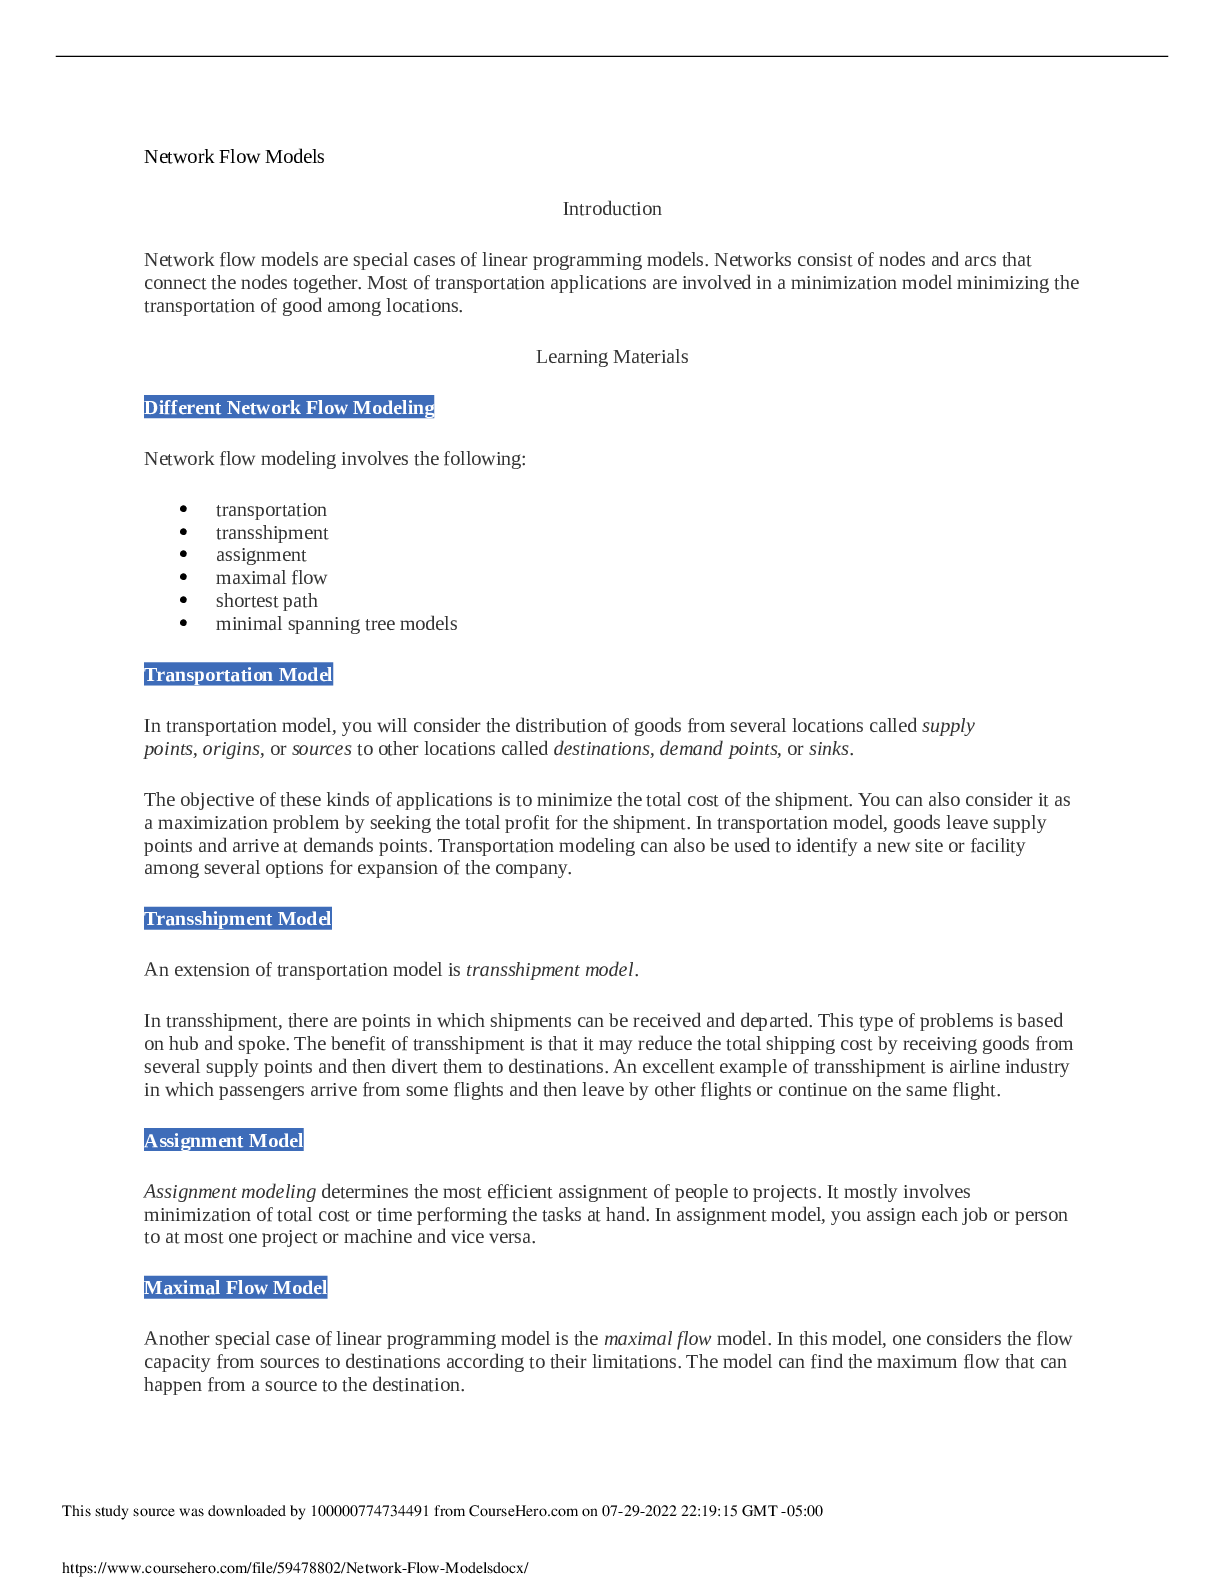
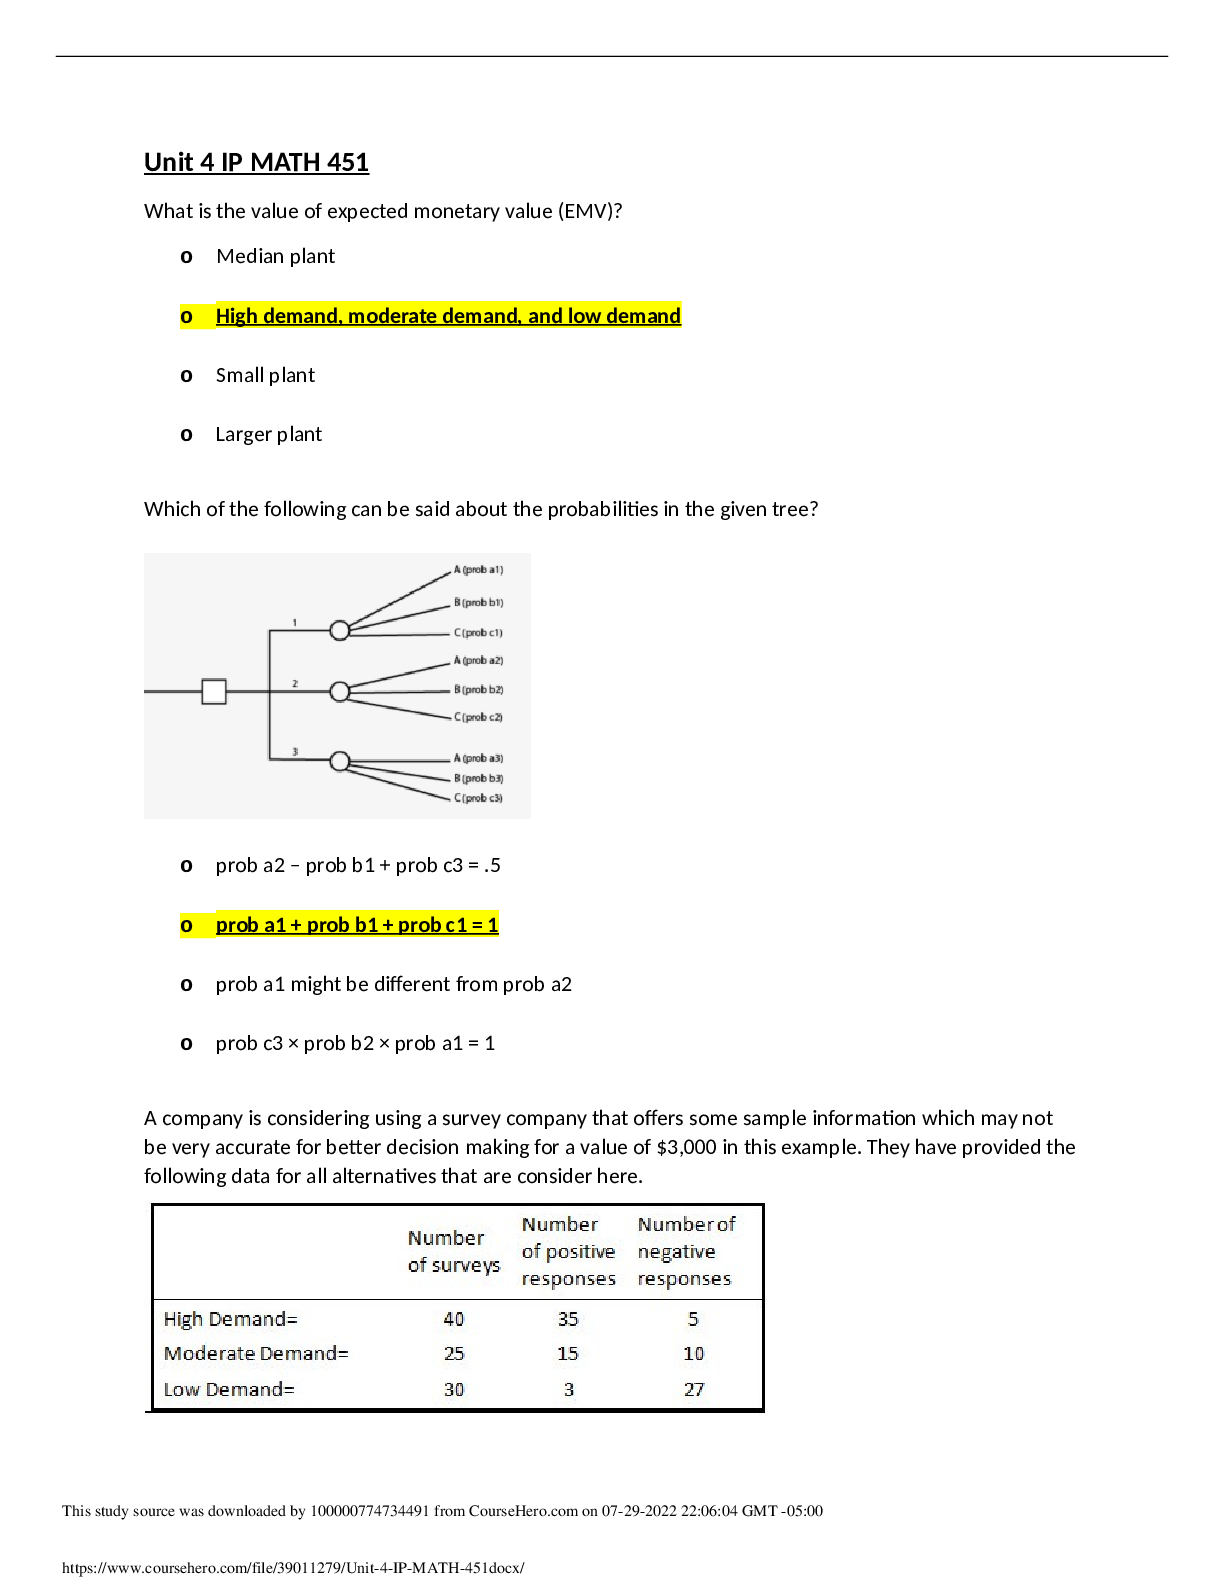
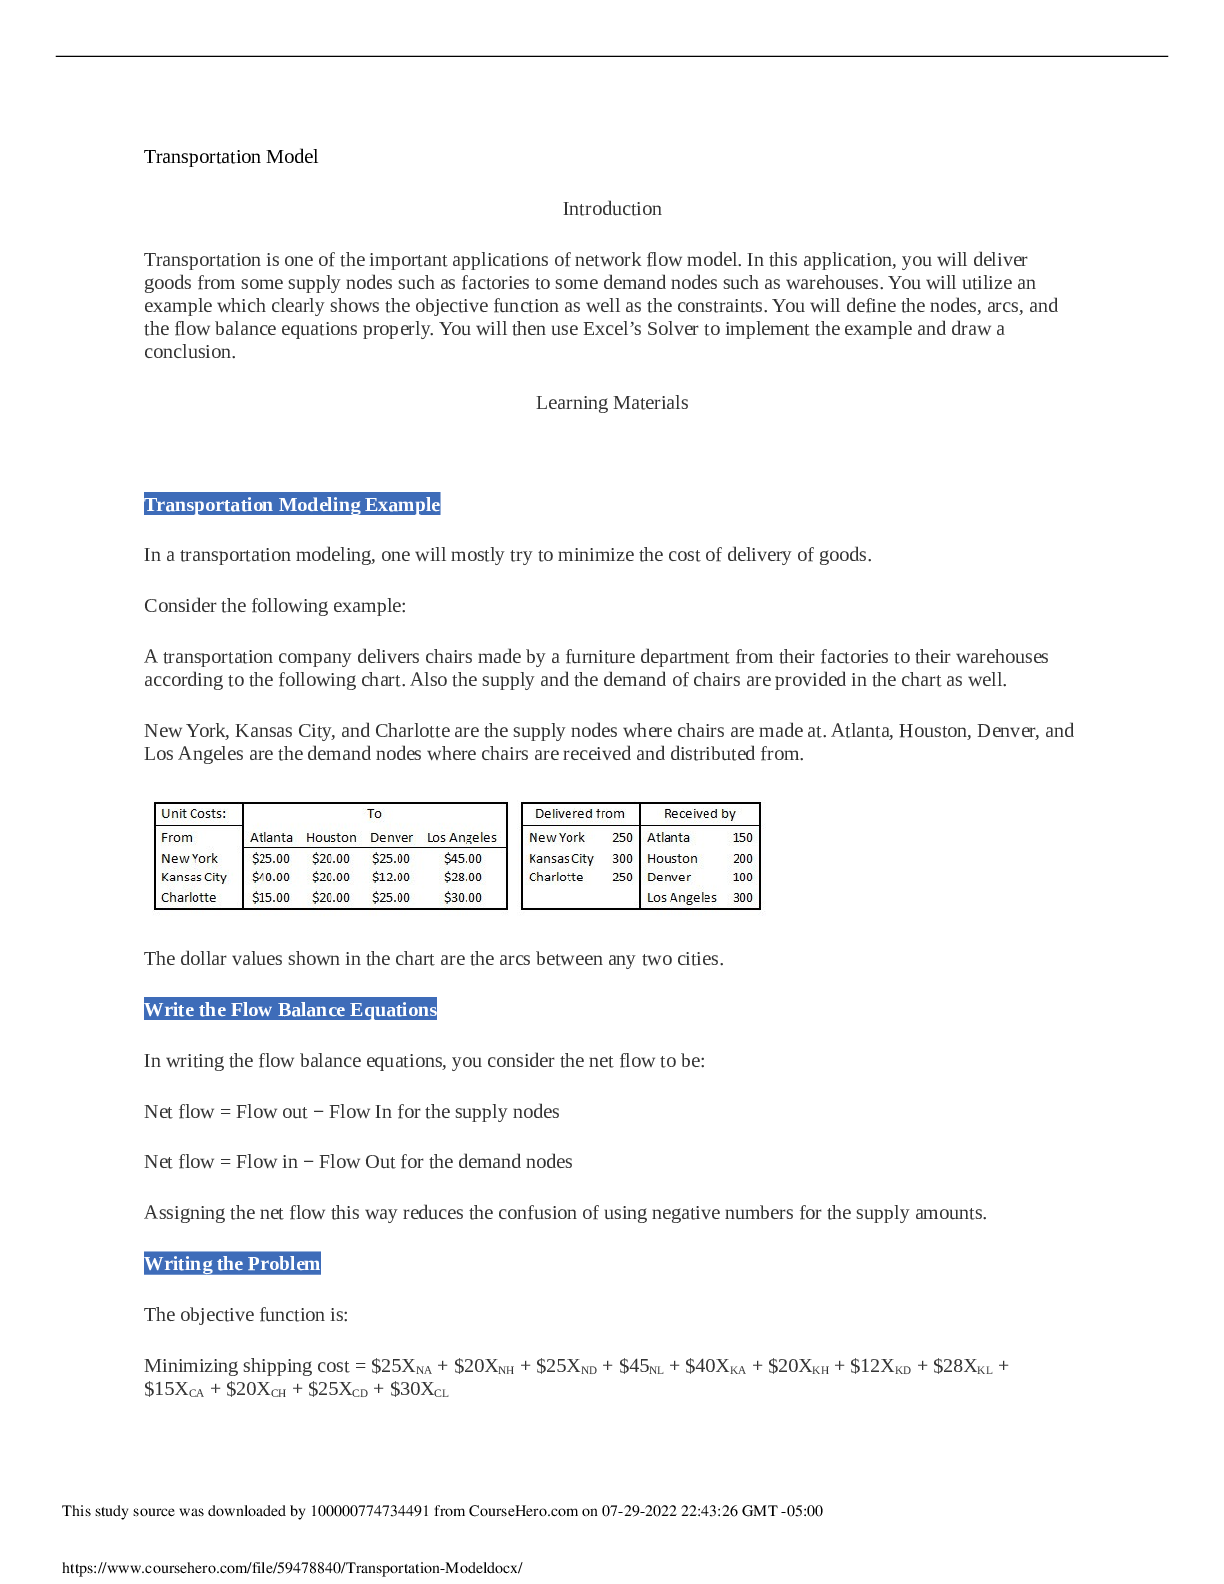
Colorado Technical University MATH 451-1404B- Transportation Model Transportation Model Introduction Transportation is one of the important applications of network flow model. In this applicatio... n, you will deliver goods from some supply nodes such as factories to some demand nodes such as warehouses. You will utilize an example which clearly shows the objective function as well as the constraints. You will define the nodes, arcs, and the flow balance equations properly. You will then use Excel’s Solver to implement the example and draw a conclusion. Learning Materials Transportation Modeling Example In a transportation modeling, one will mostly try to minimize the cost of delivery of goods. Consider the following example: A transportation company delivers chairs made by a furniture department from their factories to their warehouses according to the following chart. Also the supply and the demand of chairs are provided in the chart as well. New York, Kansas City, and Charlotte are the supply nodes where chairs are made at. Atlanta, Houston, Denver, and Los Angeles are the demand nodes where chairs are received and distributed from. The dollar values shown in the chart are the arcs between any two cities. Write the Flow Balance Equations In writing the flow balance equations, you consider the net flow to be: Net flow = Flow out - Flow In for the supply nodes Net flow = Flow in - Flow Out for the demand nodes Assigning the net flow this way reduces the confusion of using negative numbers for the supply amounts. Writing the Problem The objective function is: Minimizing shipping cost = $25XNA + $20XNH + $25XND + $45NL + $40XKA + $20XKH + $12XKD + $28XKL + $15XCA + $20XCH + $25XCD + $30XCL The flow balance constraints are: XNA + XNH + XND + XNL ≤ 150, XKA + XKH + XKD + XKL ≤ 300, XCA + XCH + XCD + XCL ≤ 250 XNA + XKA + XCA = 150, XNH + XKH + XCH = 200, XND + XKD + XCD = 100, XNL + XKL + XCL = 300 Assumptions Assume that the total supply is larger than total demand by using ≤ sign in the supply flow balance equations and = sign in the demand flow balance equations. Some of the chairs made at any of the three locations may not be delivered because there is no demand for it. On the other hand, if the total demand was larger than the total supply, use ≤ sign for the demand flow balance equations and use = sign for the supply flow balance equations. Some of the warehouse(s) may not receive as much as their demand. If the total supply and the total demand were exactly the same, use = sign for all the balance equations. Figure 1 shows the Excel’s Solver program used to solve the transportation model containing all of the required excel functions. Figure 1: Excel’s Solver Program Used to Solve the Transportation Model Figure 2 shows the same program containing the numerical values of the decision-making variables and the amount of resources consumed. Figure 2: Results of the Application Using Excel’s Solver Let be the cost of shipping a unit from to , let be the quantity shipped from to , let be the demand at sink i, and let be the supply at source j. What is the object function? Let be the cost of shipping a unit from to , let be the quantity shipped from to , let be the demand at sink i, and let be the supply at source j. What is the object function? Let be the cost of shipping a unit from to , let be the quantity shipped from to , let be the demand at sink i, and let be the supply at source j. What is the object function? Suppose that you have three supply nodes S1–S3 and four demand nodes D1–D4 with the following costs of shipping from S_i to D_j: D1 D2 D3 D4 S1 13 7 5 6 S2 12 10 4 11 S3 4 14 8 9 The demand node requirements are as follows: Node D1 D2 D3 D4 Required 100 120 160 280 The supply capacities are as follows: Node S1 S2 S3 Capacity 300 150 200 Use Solver to compute the solution in Excel. How many units are shipped from S1 to D2? 0 180 The problem does not have a feasible solution. 150 A transportation company delivers chairs made by a furniture department from their factories to their warehouses according to the following chart. The supply and the demand of chairs are provided in the chart as well. How much is the total shipping cost from Kansas City? $40, $20, $12, and $28 $9,200 $100 $22,198 A transportation company delivers chairs made by a furniture department from their factories to their warehouses according to the following chart. Also the supply and the demand of chairs are provided in the chart as well. What is the balance constraint for Houston? XNH + XKH + XCH ≤ 250 XNH + XKH + XCH = 250 $20XNH + $20XKH + $20XCH = 250 XNH + XKH + XCH ≥ 250 Transportation Example Demand Total Supply at Node S_i D1 D2 D3 D4 Sources S1 13 7 5 6 300 S2 12 10 4 11 150 S3 4 14 8 9 200 Total demand at node D_i 90 120 150 280 Based on the given table, how much can S2 supply? At least 300 At most 150 At least 150 Suppose that you have three supply nodes S1–S3 and four demand nodes D1–D4 with the following costs of shipping from S_i to D_j: D1 D2 D3 D4 S1 13 7 5 6 S2 12 10 4 11 S3 4 14 8 9 The demand node requirements are as follows: Node D1 D2 D3 D4 Required 100 120 150 280 The supply capacities are as follows: Node S1 S2 S3 Capacity 300 150 200 Use Solver to compute the solution in Excel. How many units are shipped from S1 to D2? 180 120 150 The problem does not have a feasible solution. A transportation company delivers chairs made by a furniture department from their factories to their warehouses according to the following chart. The supply and the demand of chairs are provided in the chart as well. How much is the total shipping cost for Los Angeles? $7,000 $10,400 $9,000 $1,400 Transportation Example Demand Total Supply at Node S_i D1 D2 D3 D4 Sources S1 13 7 5 6 300 S2 12 10 4 11 150 S3 4 14 8 9 200 Total demand at node D_i 90 120 150 280 Table 1: Costs and Constraints In the given table, you see the costs and the supply and demand constraints. What is the required supply at node D2? At least 14 90 150 , At least 120 A transportation company delivers chairs made by a furniture department from their factories to their warehouses according to the following chart. The supply and the demand of chairs are provided in the chart as well. How many chairs are left at the supply node after delivery? 0 You have shortage of chairs 50 800 A transportation company delivers chairs made by a furniture department from their factories to their warehouses according to the following chart. The supply and the demand of chairs are provided in the chart as well. What is the numerical value of objective function if Kansas City lowers its production down by 50 chairs? $23,750 $305 $24,750 $16,200 Let be the cost of shipping a unit from to , let be the quantity shipped from to , let be the demand at sink i, and let be the supply at source j. Which of the following is a valid constraint? (Theupside downAmeans “for all.”) A transportation company delivers chairs made by a furniture department from their factories to their warehouses according to the following chart. The supply and the demand of chairs are provided in the chart as well. What is the objective function? Maximizing shipping cost = $25XNA + $20XNH + $25XND + $45XNL + $40XKA + $20XKH + $12XKD + $28XKL + $15XCA + $20XCH + $25XCD + $30XCL Minimizing shipping cost = $25XNA + $20XNH + $25XND + $45XNL + $40XKA + $20XKH + $12XKD + $28XKL + $15XCA + $20XCH + $25XCD + $30XCL Minimizing shipping cost = $25 + $20 + $25 + $45 + $40 + $20 + $12 + $28 + $15 + $20 + $25 + $30 Minimize shipping cost = XNA + XNH + XND + XNL + XKA + XKH + XKD + XKL + XCA + XCH + XCD + XCL The following figure shows a possible layout of a transportation problem. The light green area has the costs and constraints. The light gray area shows the decision variables. Figure 1: Transportation Problem Example The given figure shows an example of a transportation problem. Why is it important to clearly label it? Because labeling is part of the ISO 8002 standard Because labeling is required for the scenario manager So that other people can understand the calculation, Because you will not remember what the numbers mean when you look at it later Because labeling is required for using the Solver add-in A transportation company delivers chairs made by a furniture department from their factories to their warehouses according to the following chart. The supply and the demand of chairs are provided in the chart as well. What is the balance constraint for New York? XNA + XNH + XND + XNL = 150 XNA + XNH + XND + XNL ≥ 200 $25XNA + $20XNH + $25XND + $45XNL ≤ 200 XNA + XNH + XND + XNL ≤ 200 A transportation company delivers chairs made by a furniture department from their factories to their warehouses according to the following chart. The supply and the demand of chairs are provided in the chart as well. How many chairs are delivered from Charlotte to Houston? 400 200 250 0 Suppose that there are M demand nodes and N supply nodes. Let be the demand at node , and let be the supply at . For Solver to be able to find a solution, which of the following must be true? The total demand is equal to the total supply . , The total demand is no more than the total supply . .(Thismeansthat for alli, the demand at nodeiis less than the supply at nodei.) The total supply is less than the total demand . . Transportation Example Demand Total Supply at Node S_i D1 D2 D3 D4 Sources S1 13 7 5 6 300 S2 12 10 4 11 150 S3 4 14 8 9 200 Total demand at node D_i 90 120 150 280 In the given table, the cell where row S3 and column D3 intersect contains a value of 8. What does this mean? This is the smallest number of units that can be shipped from S3 to D3. The maximum number of units that can be shipped from S3 to D3 is 8. Shipping one unit from S3 to D3 costs 8. This means nothing because this value will be changed by the Solver add-in. In the given table, the cell where row S3 and column D3 intersect contains a value of 8. What does this mean? This is the smallest number of units that can be shipped from S3 to D3. This is the delay for shipping from S3 to D3. If four units are shipped from S3 to D3, it will cost 32. The cell contains a value of 4, so the question is meaningless. Suppose that you have a transportation problem where the minimum demand exceeds the available supply. Solver will report that there is no feasible solution. One way to get around this is to create a dummy node with sufficient supply to make the problem feasible. How would you reflect the costs of undersupplying the demand nodes? Add the costs of undersupply to the costs of shipping to each demand node. Add a dummy demand node to capture the costs of undersupply. The cost of shipping from the dummy node is the cost of undersupply. Make manual adjustments after Solver has found a solution. A transportation company delivers chairs made by a furniture department from their factories to their warehouses according to the following chart. The supply and the demand of chairs are provided in the chart as well. Which one of the supply nodes runs out of chairs first? Charlotte New York Kansas City and New York Kansas City A transportation company delivers chairs made by a furniture department from their factories to their warehouses according to the following chart. The supply and the demand of chairs are provided in the chart as well. To what capacity can Kansas City plant lower its production to fully deliver all required chairs and have no left over at any supply node? 50 350 800 0 A transportation company delivers chairs made by a furniture department from their factories to their warehouses according to the following chart. The supply and the demand of chairs are provided in the chart as well. What is the numerical value for the objective function? $16,200 $23,750 $305 $24,750 How much is the total shipping cost from Kansas City? $9,200 $22,198 $100 $40, $20, $12, and $28 How much is the total shipping cost for Charlotte to Denver? 0 $22,198 $25 $2,500 [Show More]
Last updated: 1 year ago
Preview 1 out of 9 pages
Instant download
Buy this document to get the full access instantly
Instant Download Access after purchase
Add to cartInstant download
Reviews( 0 )
Document information
Connected school, study & course
About the document
Uploaded On
Aug 02, 2022
Number of pages
9
Written in

Additional information
This document has been written for:
Uploaded
Aug 02, 2022
Downloads
0
Views
45