Statistics > QUESTIONS & ANSWERS > Elements of Statistics. Chapter 1 to chapter 14 Exercise Solutions. All Answers 100% and Explained (All)
Elements of Statistics. Chapter 1 to chapter 14 Exercise Solutions. All Answers 100% and Explained
Document Content and Description Below
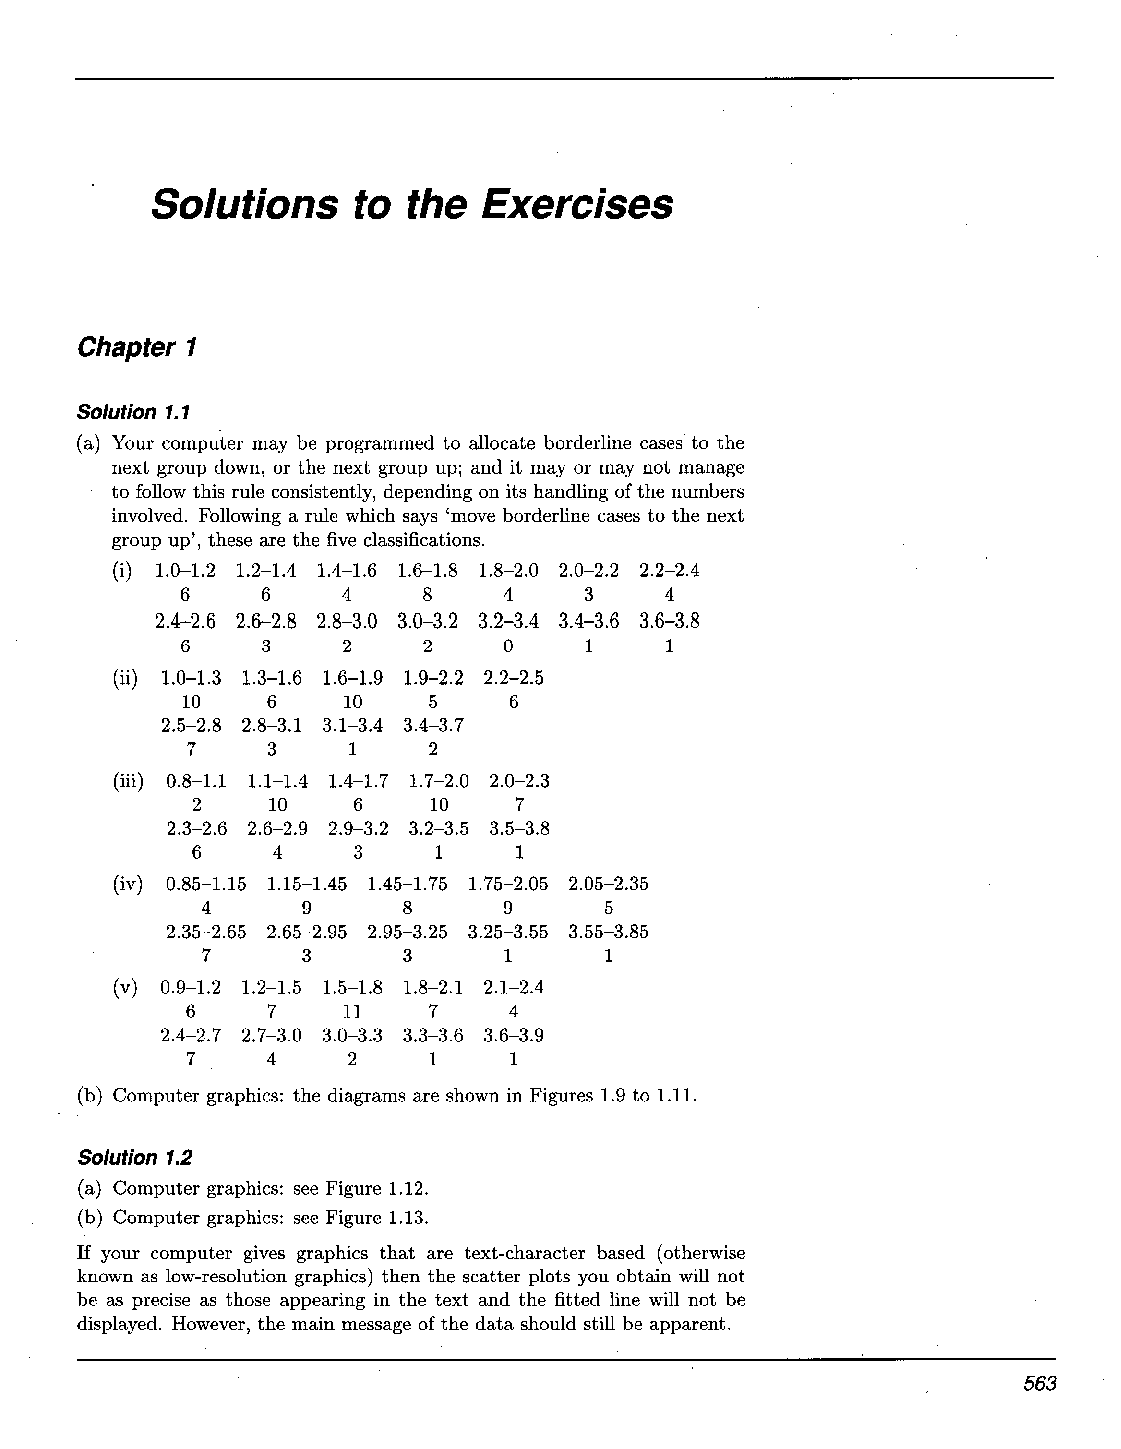
Exercise 2.1 A researcher studying reading habits stands outside a London railway station and approaches people at random as they leave the station. She asks them which newspapers they read. What a... re the inadequacies of this way of drawing the sample? What differences might you expect between samples drawn at 9 am on a weekday and at 7 pm on a Saturday? The point being made in Exercise 2.1 is that in drawing a sample it is essential that it should represent the population being studied. In a study of road traffic accidents, you might decide to examine a sample of 50 accidents. However, unless you wanted only to make inferences about motorway accidents, these 50 should not just be motorway accidents but should be drawn from the entire population of different types of road accident. 2.1.2 Probability Example 2.3 Street lamp bulbs Suppose that a local council suspects that the latest consignment of sodium tubes for its street lamps is of poor quality, with an unacceptably large proportion of them being faulty and not working. To investigate this, a researcher examines a sample of bulbs from this consignment waiting in the warehouse. This example is fairly typical of a particular problem of quality control: the estimation of 'percentage defectives' in a batch of supplied items. In practice, quality procedures are much more rigidly prescribed than is suggested by the sequential testing approach described in what follows, both for the supplier and end-user. However, we shall be mainly concerned with the essential idea of testing a random sample from a population (the population being, in this case, the recent consignment of bulbs). The researcher enters the warehouse and randomly chooses bulbs. The first bulb works. Amongst the first ten bulbs he examines, he finds that only one does not work. Amongst the first fifty, nine do not work. Amongst the first 100, fifteen do not work. The researcher could go on, examining all the bulbs in the warehouse, and find the exact proportion of bulbs which do not work. Alternatively, he may use statistical arguments to support a claim that the proportion of faulty bulbs within a sample of a certain size provides a sufficiently accurate estimate of the overall proportion that is faulty. As the researcher increases his sample size he will observe an interesting phenomenon. For small samples, quite substantial deviations between the proportions of faulty bulbs for different sample sizes are observed. Suppose that the first two bulbs he examined were functioning, then he came across a faulty one so that the sequence of the observed proportions of defectives initially was 0/1,0/2 and 113. These may be regarded as successive estimates of the unknown overall proportion of defectives and the last of these three estimates is quite different from the first two. As the sample gets larger, however, the deviations between successive estimates tend to become smaller. Suppose for the 98th, 99th, and 100th bulbs that he tested the estimates were 14/98,15/99 and 15/100. These proportions are much closer to one another. The proportion of bulbs observed to be faulty seems to be settling down towards some constant value (about 0.15). H A 'random sample' here is strictly one where no item in the population is any more likely than any other to be incorporated into the sample. In this simplified description of events, bulbs less accessible than others are probably less likely to be sampled! Hence the need, in practice, for strict quality procedures.Chapter 2 Section 2.1 We can simulate this phenomenon ourselves, that is, we can produce a simplified version or model of this situation which behaves in the same way. Later on you will be encouraged to perform such simulations using a computer, but for this first exploration the results will be more striking if we carry it out for some physical system. The simulation tools that we shall use are dice and coins. In many ways these provide ideal models because they strip away much of the complexity so that we can focus on the essentials. Exercise 2.2 Using a die from a family board game, carry out a sequence of 30 rolls with a view to obtaining either a three or a six. Each time that a three-spot face or a six-spot face occurs record a 1, to represent success. Each time that some other face of the die occurs record a 0, to represent failure. In this way you will generate a sequence of Is and OS. At any stage you will not be able to predict whether the next number will be a 1 or a 0-so the next number is a random variable. By adding the Is and OS as you go along you can calculate the total number of successes after each roll. At each roll you can also calculate the proportion of rolls so far that have produced a three- or six-spot face. Letting P denote this proportion, plot a graph of P, on the vertical axis, against the number of rolls, on the horizontal axis. Join together successive points to produce a jagged line running from left to right across the page. Your sequence in Exercise 2.2 might have begun 0 0 1 1 0 0 0 0 0 0 1 1 , which would give you a sequence of points to plot as shown in Table 2.2. Table 2.2 The first 12 rolls Not everybody has easy access to a six-sided die-some people will not possess a board game. You can get round the problem this way. Obtain a six-sided pencil or ball-point pen and identify particularly two sides of the six (to match the 'three' and the 'six' of the exercise). These could be the side impressed with the maker's name and the next side round; or, in the case of a ball-point'pen, the side with the maker's name and the side with the little hole in the casing. Roll number 1 2 3 4 5 6 7 8 9 1 0 1 1 1 2 Observedresult 0 0 1 1 0 0 0 0 0 0 1 1 Total so far 0 0 1 2 2 2 2 2 2 2 3 4 Proportion (P) 011 012 113 214 215 216 217 218 219 2/10 3/11 4/12 An example of the kind of graph you might have obtained is given in Figure 2.2. The thirty rolls which produced this graph gave the following results. 0 0 1 1 0 0 0 0 0 0 1 1 0 0 1 0 0 0 0 1 0 0 1 0 1 0 0 1 0 0 Roll Figure 2.2 Proportion P, thirty rolls of a dieElements of Statistics The phenomenon described above is apparent in this graph. As the number of rolls increases, the sequence of estimates given by successive values of P becomes less variable. The sequence appears to be tending to a particular constant value, in this case about i. Did you notice something like this happening for your sequence of estimates? The sequence of rolls that resulted in the graph in Figure 2.2 was taken further-up to 500 rolls of the die. The points in Figure 2.3 show the proportions obtained. The phenomenon is even more marked here. Roll Figure 2.3 Proportion P, 500 rolls of a die Exercise 2.3 Take a coin and carry out a sequence of 40 tosses, recording 1for Heads and 0 for Tails. Again, the outcome of each toss is a random variable. Plot the proportion of tosses producing Heads against the number of tosses. What do you observe about the proportion of Heads as the number of tosses increases? In Exercise 2.3, you might have observed behaviour similar to that of Exercise 2.2, but with the points defining the jagged line converging within a narrow region close to $ instead of $. However, what is readily apparent from as many as 500 repetitions of an experiment (Figure 2.3) will not necessarily be evident in as few as 30 repetitions (Figure 2.2) or even 40. The four examples described so far (leaf lengths, quality testing of street lamp bulbs, the die and coin experiments) have some common features. In each example a number of cases is observed in which recorded measurements on a random variable may differ from case to case. In the leaf measuring example, the length of the leaves differed. In the street lamp example, bulbs may or may not be faulty. In the die-rolling and coin-tossing examples, there were two possible outcomes and each repetition produced one of these. The leaf length example is different from the other three because, in this case, the measured random variable is continuous. For the moment, let us considerChapter 2 Section 2.1 only the other three. Each example consists of a sequence of observations on a binary random variable (two possible outcomes only). Using OS and Is to label the different outcomes in each case, the results for any one of the examples could be recorded as a sequence of OS and Is, such as The term Bernoulli trial is used to describe a single statistical experiment resulting in one of only two possible outcomes. Each of these examples therefore consists of a sequence of Bernoulli trials. The outcome of each trial is uncertain (it was not possible to predict beforehand what it would be). We have also noticed, for the bulb, die and coin examples at least, a tendency for the observed proportions to settle down towards some constant value. The value towards which the proportion is tending as the number of trials increases is called the probability of the particular outcome of interest. In the introduction to this chapter it was remarked that probability models are used to represent the important aspects of random phenomena, and that it is often necessary in the construction of such models to make simplifying assumptions. This is true for the cases under discussion now. It is often assumed that a coin is fair-that there is no reason to suppose that Heads is more or less likely than Tails. So we might construct a probability model for the outcome of a coin-tossing experiment by starting with the assumption that the probability that Heads will appear is the same as the probability that Tails will appear-both being equal to exactly i. Similarly, for the die example, we might assume that each face has the same probability of appearing. That is, we might choose to model the outcomes of rolls of a real die by those of a perfect die in which the appearance of each face is equiprobable. If we do this, the probability that a particular one of the six faces appears is i,and so the probability that one of the two faces showing three or six spots will appear is exactly 2 , or i. Two other terms sometimes used in statistics are sample frequency, to describe the number of times an outcome occurs, and sample relative frequency, to describe the proportion of times an outcome occurs in a particular experiment. In a coin-tossing experiment in which a coin is tossed 100 times, coming up Heads 47 times, we would say that the sample frequency (or just 'frequency') of Heads was 47 and the sample relative frequency of Heads was = 0.47. In the examples above, the modelling assumption is made that the probability that a three- or six-spot face will appear in a roll of a perfect die is i;and that the probability that Heads will appear in a toss of a perfect coin is i,. The bulb-testing example is different. We cannot deduce, from any kind of theoretical argument based on symmetry, a numerical value for the probability that a bulb will be faulty. This probability has to be estimated from data-in Example 2.3, this probability estimate was the sample relative frequency of failures, 0.15 (based on 15 observed failures in 100 trials). We might say, on the basis of this experiment, that we believe the proportion of faulty bulbs in the latest consignment to be about 0.15.Elements of Statistics Exercise 2.4 In an experiment to explore the issue of whether people are generally more helpful to females than to males, eight students approached people and asked if they could change a 5p coin. Altogether 100 people were approached by the male students and 105 by the female students. The results of the experiment are displayed in Table 2.3. Table 2.3 Helping behaviour Gender of student Help given Help not given Male 71 29 Female 89 16 (a) Use these data to estimate the probability that a male is given help under Sissons, M. (1981) Race, sex and helping behaviour. British Journal of Social Psychology, 20, 285-292. The sum of 5p may seem very small indeed to the modern reader, and prompt the question why change might be required for such a sum. At the time the experiment these circumstances. (b) What would you estimate this probability to be for a female? (c) Do the results of the experiment support the notion that people are more . helpful to females? was carried out, a local telephone call could be made from public telephone boxes for as little as 2p. In Exercise 2.4 you were asked to estimate two probabilities. A large part of this course is concerned with estimation-methods for obtaining estimates and assessing how reliable these estimates are. You were also asked to comment on the meaning of the results of the experiment. Later in the course (Chapter 8) you will see formal ways of doing this-so that you can actually quantify the extent to which experimental results support a research hypothesis. Now let us take a slightly more complicated example. In a Bernoulli trial there are only two possible outcomes: what if we were to consider, say, each of the six faces of a die as distinct possible outcomes? Suppose the die is rolled. What is the probability that the face with a single spot appears, what is the probability that the face with two spots appears and so on? We could carry out an experiment analogous to those above-rolling the die a large number of times and calculating the relative frequency with which each of the faces came up. This would enable us to directly estimate the probability that each face occurs. Alternatively, since there is no reason to suppose that any one of the six faces is favoured more than any of the others, we could argue that each face is equally likely to appear-that the probabilities are equal for each face. That is, our model would be that each face has a probability of i of appearing. This would mean that about i of the time we should expect the face with one spot to come up, about i of the time we should expect the face with two spots to come up and so on. As we rolled the die more and more times, so, under our model, we should expect the proportion of times each face appears to get closer and closer to 6. Example 2.4 A simulated die-rollingexperiment Here is a simulation of an experiment based on the assumption of a perfect die. The simulation was achieved using a computer to mimic the rolls and also to record the outcomes. The die was rolled a large number of times, and the observed frequencies of Is, 2s, ..., 6s (six possible outcomes) recorded after 30, 300 and 3000 rolls. At each stage the sample relative frequency for each outcome was calculated. 52Chapter 2 Section 2.1 Table 2.4 Simulation results for a perfect die Outcome 1 2 3 4 5 6 30 rolls Frequency 5 3 6 4 5 7 Relative frequency 0.1667 0.1000 0.2000 0.1333 0.1667 0.2333 300 rolls Frequency 55 54 56 52 46 3 7 Relative frequency 0.1833 0.1800 0.1867 0.1733 0.1533 0.1233 3000 rolls Frequency 506 508 497 525 467 497 Relative frequency 0.1687 0.1693 0.1657 0.1750 0.1557 0.1657 B It is apparent from the observed frequencies that the computer model is capable of reflecting the random variation inherent in the physical process. Although we might 'expect' 50 observations of each of the six equiprobable outcomes after 300 rolls of the die, we would nevertheless be somewhat surprised to see exactly that: actually, there were only 37 6s. However, after a large number of rolls, the observed relative frequency for each of the possible outcomes seems to be showing a tendency to approach the theoretical value of A = 0.1667. This tendency is shown graphically in Figure 2.4, summarizing the-findings in Table 2.4. Relative frequency Relative frequency 1 2 3 4 5 6 Outcome Rela 0.25 0.20 0.15 o.ia 0.05 0 re frequency 1 2 3 4 5 6 Outcome Figure 2.4 Relative frequencies from a simulation of a perfect die (a) 30 rolls (b) 300 rolls (c) 3000 rolls Assuming a perfect die and applying a symmetry argument, Figure 2.5 illustrates the conclusions of a very extended experiment involving many rolls of the die. Relative freq~lency Outcome Figure 2.5 The perfect dieElements of Statistics Put another way, the diagram in Figure 2.5 shows the theoretical probability distribution over the six possible outcomes (1,2,.. .,6) for a die that is assumed to be perfect. It will be useful if at this stage some simple notation is introduced. In this course, the probability that a statistical experiment results in a particular outcome will be denoted P(.). For instance, the earlier statement that, in tossing a perfect coin, Heads and Tails are equally likely so each outcome has probability i,would be written The theoretical probability distribution for the perfect die may be written In particular, referring to the original experiment (Exercise 2.2), This concept of a probability distribution is a very important and fundamental one in statistics. It tells us how likely it is that different outcomes (or, in general, events) will occur. For example, you will see later how the idea can be used to work out for a random sample how likely it is that a particular average will occur. Conversely, we might express our confidence, given a sample average, that some particular underlying probability distribution might have generated the data. This serves as a test of our understanding of what is going on. If it is very unlikely that the data could have arisen from the model that we believed to be a realistic representation for the phenomenon, then maybe our beliefs need modification. The next three sections of this chapter explore the idea of a probability distribution in more detail. Exercise 2.5 Table 2.5 gives the numbers of yeast cells found in each of 400 very small squares on a microscope slide when a liquid was spread over it. The first row gives the number n of yeast cells observed in a square and the second row gives the number of squares containing n cells. (For instance, 213 of the 400 squares contained no yeast cells at all; no square contained more than 5 cells.) Table 2.5 Yeast cells on a microscope slide Cells in a square, n 0 1 2 3 4 5 Frequency 213 128 37 18 3 1 Evidently, the number of cells per square is a random variable taking (in this experiment) observed values between 0 and 5. Would you model this variation using a discrete or continuous probability model? Table 2.6 gives the lengths (in mm) of the jawbones of 23 kangaroos of the Macropus Giganteus species. Table 2.6 Jawbone lengths (mm) Would you choose to model jawbone length as a discrete or continuous random variable? The following is a list of 20 operational lifetimes (in hours) for components. Table 2.7 Operational lifetimes (hours) 'Student' (1906) On the error of counting with a haemocytometer. Biometrika, 5, 351-360. 'Student1 was the pseudonym of William Sealy Gosset (1876-1937). Gosset pursued his research whilst working for the Guinness brewery company, which prohibited its employees from publishing their work-hence the need to write under a pen name. The probability distribution bearing the name 'Student' is a very important statistical model, which we shall meet in Chapter 7. Andrews, D.F. and Herzberg, A.M. (1985) Data. Springer Verlag, New York, p. 311. Angus, J.E. (1982) Goodness-of-fit tests for exponentiality based on a loss-of-memory type functional equation. J. Statistical Planning and Inference, 6, 241-251. What sort of model would you adopt for the variation in lifetimes?Chapter 2 Section 2.2 Daily rainfall (in mm) was recorded over a 47-year period in Turramurra, Sydney, Australia. For each year, the wettest day was identified, that is, that having the greatest rainfall. Table 2.8 shows the rainfall recorded for the 47 annual maxima. Table 2.8 Annual maxima, daily rainfall (mm) What sort of random variable would you use to model the variation evident here? Incidentally, the seventh observation of 3830mm seems very exceptional, even in a location as wet as Turramurra would appear to be! In fact, it turns out that a fairly standard probability model fits these data quite well without ignoring that observation as an outlier, or assuming a misprint. Without local knowledge, it is difficult to say whether or not the units of measurement (mm) have been incorrectly recorded or whether perhaps there is confusion over reporting what was actually measured. However, the fact that something has gone wrong in the recording of these data is clear: weather records give the annual average rainfall in Sydney as about 47 inches or about 1200mm! The Encyclopedia Britannica (15th edition, 1985) reports that the heaviest daily rainfall then recorded anywhere in the world was 1870mm at Cilaos, La Reunion in the Indian Ocean, during 15-16 March 1952. This kind of situation where the data units are wrong, or omitted, or where it is not entirely clear what was being recorded, occasionally happens in statistics. Data are given in Table 2.9 for library book usage. A sample of 122 books was selected and for each of them the number of times they had been borrowed in the preceding twelve months was counted. (For instance, of the 122 books sampled, 65 had been borrowed just once in the preceding year.) Table 2.9 Library book usage Loans per year 1 2 3 4 5 6 7 Frequency 65 26 12 10 5 3 1 The number of loans is a random variable. Is the random variable discrete or continuous? Here is a further example. Example 2.7 Memory recall times In a study of memory recall times, a series of stimulus words was shown to a subject on a computer screen. For each word, the subject was instructed to recall either a pleasant or an unpleasant memory associated with that word. Successful recall of a memory was indicated by the subject pressing a bar Rayner, J.C.W. and Best, D.J. (1989) Smooth tests of goodness of fit. Oxford University Press, p. 146. Burrell, Q.L. and Cane, V.R. (1982) The analysis of library data. J. Royal Statistical Society, Series A, 145, 439-471. The authors collected the data from several libraries. These data are from one of the sections of the Wishart Library in Cambridge. Dunn, G. and Master, D. (1982) Latency models: the statistical analysis of response times. Psychological Medicine, 12, 659-665.Elements of Statistics on the computer keyboard. Table 2.10 shows the recall times (in seconds) for twenty pleasant and twenty unpleasant memories. The random variable 'recall time' is an example of a continuous random variable-in principle, any value within a certain range could arise. Of key interest in this study was whether pleasant memories could be recalled more easily and quickly than unpleasant ones. Figure 2.10 shows a comparative boxplot for these two samples and we can see that although the smaller values of recall time for the unpleasant memories have values similar to the smaller values for the pleasant memories, the larger values tend to be substantially greater for the unpleasant memories. Both distributions are skewed. We shall explore more formal techniques for examining problems like this later in the course. pleasant, I I I I I I I I I I I 1 2 3 4 5 6 7 8 9 10 1 1 Time (seconds) Figure 2.10 Boxplot for memory recall times Exercise 2.6 m (a) According to the model suggested in Example 2.8, what proportion of ODD. gaps exceeds 5 seconds? (b) According to the suggested model, can you find a formula for the probability that a gap is not longer than t, for some general value of t? In your solution to Exercise 2.6(b), you used geometrical arguments to find a formula for the probability P(T < t) for the triangular density defined over the interval 0 5 t 5 20. A different approach is to use integration and say This would give you the same answer. However, most of the results we shall use in this course are standard and do not need to be worked out from first principles. If you cannot remember a particular formula, then all you need do is turn the pages to find it. This section finishes with a summary of the ideas introduced so far, thus identifying the important points. 2.2.3 Properties of probability models We have briefly looked at two probability models for discrete random variables. The first was proposed in order to describe the variation that would be observed when a six-sided die is rolled. Under the assumption that the die is perfectly fair, the corresponding probability function is where the random variable X denotes the number of spots on the face that appears. The second probability model was used to describe'the variation in outcome when a Double-Five is rolled. Denoting the outcome of that experiment by the random variable Y, the corresponding probability function is and the range of Y is {l,3,4,5,6). For continuous random variables, we needed a different mathematical entity, reflecting the fact that the range of observable values is continuous. We saw that in this case we can represent the variation that might be observed through a probability density function f (.), and calculate the probability that a particular value is observed between a lower limit xl and an upper limit x2 asChapter 2 Section 2.2 where the expression on the right-hand side means the area under the curve f (X)between X = x1 and X = 22. In the traffic example (Example 2.8), we used the triangular density function as a continuous probability model for traffic waiting times (in seconds). Different models will be appropriate in different contexts: for example, data suggest that a model very different to the triangular density would be appropriate to represent variation in leaf lengths, at least for one particular bush of one particular species. The expression 'probability density function' is often abbreviated to p.d.f. and we may summarize the situation so far as follows. Probability density function For a continuous random variable X , observed variation may be modelled through the probability density function (or simply the density function) f(x). This is often abbreviated to p.d.f. Then the probability that an observation on X lies between limits xl and 2 2 may be calculated as the area under the curve of f(x) between X = xl and X = 22. This is written in mathematical notation as the integral The p.d.f. is defined for all values of X in the range of X . What we have so far loosely called the probability function p(x) describing the probability distribution of a discrete random variable X is sometimes called a probability mass function, which clearly distinguishes it from the probability density function f (X)for a continuous random variable. The term is often abbreviated to p.m.f. Probability mass function The probability function for a discrete random variable is usually called the probability mass function (6r simply the mass function) of the random variable. This is often abbreviated to p.m.f. For a discrete random variable X , the probability mass function gives the probability distribution of X: p(.) = P ( X = X). The p.m.f. is defined for all values of X in the range of X . During this discussion of probability mass functions and probability density functions some important properties of probability models have been identified. First, a probability (whether of taking a particular value, or of observing a value within a particular interval) is a number representing a long-term proportion for an event; and that event will either never happen, sometimesElements of Statistics happen, or always happen. Second, of all the possible outcomes (all the values of X in the range of X ) one will certainly happen. Thus we are led to these properties of probability functions. For a discrete random variable X with probability mass function p(x), 0 l P(X) 5 1 for all X in the range of X , and where the summation is over all X in the range of .X. For a continuous random variable Y with probability density function f (y), the p.d.f. cannot be negative, and where the integration is over the whole range of possible values of the random variable Y. (The total area under the curve f (y) over the entire range of Y is equal to 1.) Using the appropriate probability function, we can calculate the probability that a random variable will lie in any given interval by summing probabilities (or by integration in the continuous case). For the sort of standard probability density function that will be considered in this course, it will not be necessary to go through the process of integration, since most results are well-documented. It is often useful to know the probability that the random variable will not exceed some specified value. Suppose, for example, that we wish to know the probability that a random variable X, which only takes non-negative values, will not exceed some specified value X. That is, we want to find the probability P ( X 5 X). If X is discrete, this probability may be obtained from the p.m.f. p(x) by summing appropriate terms: so, for a random variable X with range O,1,2,. . ., this probability may be written On the other hand, if X is continuous, then we would have r x (the lower limit of the integral being, in general, the lowest observable value of X, not necessarily zero). In either case, the function F(x) = P ( X < X)is called the cumulative distribution function of the random variable X .Chapter2 Section 2.2 The cumulative distribution function The cumulative distribution function F(x) of a random variable X is the probability that X takes a value less than or equal to X: F(x) = P ( X 2 X), where X is in the range of X. Often the abbreviation c.d.f. is used, or the simpler term distribution function. In the following example, the c.d.f. of a discrete random variable is obtained. Example 2.9 The c.d.f. for a fair die For a fair die, the probability mass function is given by P ( X = x ) = p ( x ) = k, x = 1 , 2 , 3 , 4 , 5 , 6 , and the cumulative distribution function is defined by F(x) = P ( X 5 X). For instance, The p.m.f. p(x) and the c.d.f. F(x) for the random variable X may conveniently be set out in a table as shown in Table 2.12. . Exercise 2.7 If the random variable Y taking values y = 1,3,4,5,6is used to model the outcome of a roll of a perfectly engineered Double-Five,and if the c.d.f. of Y is written F(y), construct a table like Table 2.12 to represent the probability distribution of the random variable Y. Exercise 2.8 You have already found in Exercise 2.6(b) the c.d.f. of T, the random variable describing the waiting time (in seconds) between consecutive vehicles using the Kwinana Freeway in Perth. It was Use the c.d.f. to calculate the probabilities (a) P(T 5 10); (b) P(T> 5). (Again, you should notice that the supposition that these calculations are useful is based on the assumption that F(t) as given above provides a good model for the probability distribution of the time intervals between cars.) The notation p ( . ) is standard for probability mass functions; so is the notation f (.) for probability density functions. In either case, F ( . ) is standard notation for the cumulative distribution function. Table 2.12 The probability distribution for a fair dieElements of Statistics The probability function for a random variable tells us all there is to know about the probability that a random variable will take particular values or fall in a particular interval of the range. If, for a given random variable, we knew this function, then life would be straightforward-questions about likely outcomes could be answered simply by reading off values from this function or by using appropriate formulas. Unfortunately, life is not so straightforward. In general, the probability function will not be known. This means that to make headway in answering questions about probabilities we shall have to estimate the function. Histograms and bar charts based on samples of data provide one general way of estimating probability functions. In some cases we may have more information on which to base our model for the process generating the values of the random variable. In the street lamp example (Example 2.3) there were only two possible outcomes (faulty or not faulty) so that the probability distribution had only two peaks (0.15 and 0.85). In the coin-tossing example (Exercise 2.3) which is very similar, we might go further and postulate that the coin is fair-it favours neither Heads nor Tails-so P(Heads) = ~ ( ~ a i l s ) . Since, as we have seen, the sum of the probabilities of all possible outcomes is 1,i.e. ~ ( ~ e a d s ) + P(Tai1s) = 1, we must have P(Heads) = P(Tai1s) = $. This means that the two non-zero peaks of the corresponding probability distribution in the coin-tossing example must have equal heights. If we do not wish to make the assumption that the coin is fair, then the situation is, from a mathematical viewpoint, identical to the bulb-testing example. In both these cases we shall have to estimate the probabilities from a sample, that is, from the data. In other situations, such as the leaf length example (Example 2.1) or the blood plasma P endorphin concentration data from Chapter 1, Example 1.4, we might also have some reason (perhaps based on theory or on extensive experience with similar situations) for believing that the probability function will have a particular form. In the rest of this chapter, and in Chapters 3 and 4, particular forms which occur frequently and have very widespread application are described. The probability models associated with the bulb-testing example, the cointossing example and the first die-rolling example (with two outcomes: either the three- or six-spot face, or one of the other four) all used Bernoulli trials: this illustrates an important feature of such situations. This is that the probability function in question will typically be a member of a family of similar functions. In these three examples, each function consisted of just two peaks, but the heights of the peaks differed between the examples. We can index the family by the heights of the peaks. In fact, in each case the height of only one of the peaks needs to be given since the other can be found by subtraction from 1. This indexing value is called a parameter of the distribution. The value of the parameter tells us exactly which member of a family of distributions is being Exercise 2.9 In a study in the Norwegian county of Sogn and Fjordane of all 6503 women Keiding, N. (1991) Age-specific aged between 35 and 49, 591 of them were found to have passed menopause. imidence and prevalence: a statistical perspective. J. Royal (a) If we were to choose one of these women at random, what is the probability Statistical Society, Series A, 154, that she would have passed the menopause? 371-412. (b) Define a suitable random variable X to indicate whether a randomly chosen woman has passed the menopause, and write down its probability mass function. Exercise 2.10 Telephone surveys are surveys conducted over the telephone. These are easier and cheaper than sending out interviewers, but not all households have telephones so the coverage will be incomplete. In 1986, 78% of British households had telephones. For a randomly chosen British household, write down the probability distribution of the random variable X which takes the value 1if the household does have a telephone and 0 if it does not Exercise 2.11 An experiment is performed consisting of a sequence of 15 independent Bernoulli trials. If a trial is successful (the interpretation of 'success' depends on the context) a score of 1 is recorded; otherwise, a score of 0 is recorded. The total 'score' for the experiment, Y, a random variable, is obtained by adding together all 15 Is and OS. What is the range of the random variable Y? The situation where what is of interest is the total number of successful trials in a set of independent Bernoulli trials is a very common one in statistics. The probability model for this random variable is one of the standard models that we shall be using in the course. Its definition follows. If a set of n independent Bernoulli trials each has identical probability of success, p, then the random variable Y, defined as the total number of successes over all the trials, is said to follow a binomial distribution with parameters n and p. This is written Y B(n,p). Sometimes the expression 'Y is a binomial random variable' or 'Y is binomially distributed' or, simply, 'Y is binomial' is used. Before going on to examine properties of the binomial probability distribution, we shall first explore different situations where it might or might not provide an adequate model.Chapter 2 Section 2.3 Example 2.13 Coin tossing Suppose a (fair) coin is tossed three times. Each time it may come up Heads or Tails, and each of these outcomes has probability i. It is reasonable to assume that the trials are independent-that the fact that it came up Heads (or Tails) the first time does not influence the chance of it doing so at the second (or any subsequent) trial. These three trials thus satisfy the conditions for the total number of Heads to follow a binomial distribution with parameters n = 3 and p = l. 2 This means that the probability distribution for the total number of Heads (either 0, 1, 2 or 3) is binomial B(3,3). W Example 2.14 Political attitudes in one household In a survey of political attitude, we might ask all adults in a household how they intend to vote in a two-party system. There are two possible outcomes. Let us define, for each adult in the household, a random variable X, taking the value 1 if they say they intend to vote RED and 0 if they say BLUE. Then we could add up these random variables to produce a new one, Y, the total number of adults who say they intend to vote RED. However, the X scores would not be independent since adults within a household are likely to influence the way the others vote, so the random variable Y would not follow a binomial distribution. W Exercise 2.12 Half of the married people in the United Kingdom are female and half male. Thus, if a married person is chosen at random, the probability of picking a female is i. If 100 married people are randomly picked, the distribution of the number of females will follow the binomial distribution B(100,i).However, suppose that 100 married people are picked by choosing 50 different people at random, along with their spouse. Does the number of females now follow a binomial distribution? Example 2.15 Visual perception In an experiment on visual perception, it was necessary to create a screen of Laner, S., Morris, P. and Oldfield, small squares ( h inch by inch) and, at random, colour the squares black or (1957) A random pattern white. The size of the screen was 27 inches by 40 inches, so there were 155520 Screen. Quarterly Experimental Psychology, 9, small squares to colour. A computer was used to make the decision according 105-108. to a very long sequence of Bernoulli trials with predetermined probabilities After this was done, and before performing the experiment, the screen was sampled to see whether the colouring algorithm had operated successfully. A total of 1000 larger squares (iinch by inch) each containing 16 of the small squares were randomly selected and the number of black small squares was counted in each case. The results should have been consistent with 1000 observations from the binomial probability distribution B(16,0.29). The results are shown in Table 2.13.Elements of Statistics If the computer algorithm for the random colouring was correct, then-the data in Table 2.13 give us our first glimpse of a random sample from a binomial distribution. Figure 2.17 gives the corresponding bar chart for these data. You can see that the sample is unimodal and moderately skewed. Table 2.13 Counts on a random screen pattern Number of Frequency black squares Frequency Screen counts Figure 2.17 Counts on a random screen pattern The statistical procedures for testing the quality of the fit of a hypothesized probability model to a particular data set will be discussed in Chapter 9. Indeed, at this stage we have only discussed circumstances under which the binomial model might be assumed to hold, and the model itself has not yet been developed. That is, we have not yet discovered how to calculate the probability that a particular total will be obtained if-weobserve data assumed to arise from a binomial distribution. To illustrate the calculations, let us use the following example. Suppose that we are interested in how likely people are to visit their doctor. We might be interested in this as members of a team reporting to a local health authority on the demand for health treatment. To investigate this, we could draw a random sample of people and ask each person if they have visited their doctor in the last year. We shall assume that whether or not one person has visited the doctor implies nothing about the probability that any other person will have visited the doctor-the observations are independent. Let us also suppose that, unknown to us, 1 in 3 people will answer Yes to the question, so the probability is !j that a randomly chosen person will answer Yes. We shall go through the calculation in two stages. First, suppose that three people are asked the question: have you visited your doctor in the past twelve months? The probability that the first answers Yes is 5 . The probability that the second answers Yes is also 5 . The probability that the third gives a No response is $. An assumption of the binomial model is that these responses are independent. What then is the overall probability that the question elicits the responses Yes Yes No in that order? The easiest way to think about this is to calculate the proportion of occasions in repeated samples that the first three responses would take precisely that form. Only in one-third of such samples would the first response be Yes; and only in one-third of those would the second also be Yes-so only in one-ninth of repeated samples would the first two responses be Yes: In reality, estimating this probability would be the purpose, or one of the purposes, of such an investigation. P(Yes Yes) = P(Yes) X P(Yes) = f X f = B.Chapter2 Section 2.3 Continuing the process, you can see that only in two-thirds of those samples would the third response be No: P(Yes Yes No) = P(Yes) X P(Yes) X P(No) = i X $ X -2 - 1 3 - 2 7 ' We can apply the same sort of argument to any particular Now we move to the second stage of the calculation. In pursuing this survey, sequence. For example, the we are not actually interested in recording the order in which the responses rob ability that the sequence occurred, only in counting the different responses. What, for instance, is the Yes Yes Yes after asking the question of five probability that amongst the first three people questioned, two say Yes and people is one says No? There are exactly three different ways this could happen and $ x ~ x ? x ' x ' = 4 their probabilities are as follows. 3 3 3 3 243' P(Yes Yes No) = i X i X i = ;1Z? P(Yes No Yes) = $ X i X = P(No Yes Yes) = i X i X -31 - 2 - 27 If we now disregard the order of response, we find that the probability of achieving two Yes responses and one No after questioning these three people is P(Yes Yes No) + P(Yes No Yes) + P(No Yes Yes) - - 5 + & + & = 3 x & . 2 Fortunately, it is not necessary to list all the possible sequences of responses in order to establish, say, the probability that in a sample of ten people questioned seven responded Yes; or that more than twelve responded Yes in a sample of twenty. There is a formula that makes such efforts unnecessary. It states generally that the number of different ways of ordering X Yeses (and n - X Noes) in a sequence of n Yes-No responses is given by for X taking any value from 0 (all Noes) to n (all Yeses). The notation X!is a shorthand for the number 1 X 2 X 3 X ... X X. You might also have seen the notation 'The number X!is read 'X factorial'. The number (E) is read 'n C X'. So, for instance, the number of different ways of obtaining 7 Yeses (and 3 Noes) in a sample of ten people questioned is 7 3 Each one of these 120 ways occurs with probability (i) ( g ) ; for instance, P(Yes Yes Yes No No Yes Yes Yes No Yes)Elements of Statistics Overall, then, the probability of obtaining 7 Yes responses and 3 No responses in a sample of size ten is This is the probability that a binomial random variable with parameters n = 10 (the sample size) and p = (the probability of obtaining a Yes response) will take the value 7. That is, if Y- B (10, $),then or, more generally, if Y- B (10,i),then The number O! is defined to be 1. Setting y equal to 0 in this formula gives which is the probability that all ten responses are No. The binomial probability model may be summarized as follows. The binomial probability model The random variable X follows a binomial distribution with parameters n and p if it has probability mass function where 0 < p < 1,and This is written X- B(n,p) and provides a probability model for the total number of successes in a sequence of n independent Bernoulli trials, in which the probability of success in a single trial is p. Exercise 2.13 m Suppose that a study is undertaken to compare the safety and efficacy of two H antidepressant drugs. Eighteen patients are each randomly allocated to one of three groups, six to a group. The first group is treated with Drug A and the second with Drug B. Patients in the third group are treated with a placebo (a substance which is inert as far as antidepressive effects go, but which is given to the patients in the same way as the treatments being studied, so that the analysis can be controlled for any natural remission). One of the problems associated with studies of this sort is that patients occasionally 'drop out': they cease treatment before the study is completed. This might be for reasons unrelated to their course of treatment, or because 78Chapter 2 Section 2.3 they suffer from side-effects, or it might be because they perceive no beneficial effect from their treatment. The phenomenon is consequently a complicating feature in a statistical analysis of the results of such studies. A previous study suggests that the proportion of patients in placebo groups who drop out might be about 14%. (a) Using this estimate for the value of the parameter p in a binomial model, calculate for the placebo group in the present study (i) the probability that all six patients drop out; (ii) the probability that none of the six drop out; (iii) the probability that exactly two drop out. (b) An assumption of the binomial model is that of 'independence from trial to trial'. Interpret this assumption in the context of the study, and comment on whether you believe that, in this case, it is a reasonable assumption. Example 2.16 Multiple choice examination scores One of the components of assessment of the statistics students at a certain British university is a multiple choice examination consisting of twenty questions. . For each question the correct answer is one of five possible options. Students indicate the one of the five they believe to be correct. Sometimes some of the students give the impression that they have gone through the paper guessing answers at random. Since such a student guesses answers at random, an answer to any particular question is independent of an answer to any other question. Moreover, since there are five possible answers to each q6estion and since the selection is made at random, the probability of picking the correct one is $ for each question. Thus the answers of a student who guesses at random form a sequence of twenty independent Bernoulli trials, each with probability of success i , i.e. 0.2. So the total number of correct answers given to the twenty questions is a random variable following a binomial distribution with parameters n = 20 and p = 0.2. That is, letting the random variable T denote the total number of correct answers, T B(20,0.2). In such a situation we might like to know the proportion of students who would score more than the pass mark if they guessed in the way described above. For example, if the pass mark was 10, the probability that a student adopting a random guessing procedure such as that described above would score less than 10 (and so fail the examination) is given by Here, we have summed the probabilities of all the scores less than 10. Table 2.14 gives the probability mass function P ( T = t) = p(t) and the cumulative distribution function P ( T 5 t )= F(t) for the binomial random variable T B(20,0.2). For example, P ( T = 3) Dunbar, G.C., Cohn, J.B., Fabre, L.F., Feighner, J.P., Fieve, R.R., Mendels, J. and Shrivastava, R.K. (1991) A comparison of paroxetine, imipramine and placebo in depressed outpatients. British Journal of Psychiatry, 159, 394-398.Elements of Statistics The probabilities are given correct to four decimal places, but notice that, Table 2.14 The probability because of rounding effects, the numbers in the right-hand column are not all distribution of 2' B(20,0.2) exactly equal to the 'running sum' of the probabilities in the middle column. P(T= t ) P(T5 t ) For instance, the table gives 0 P(T= 0) = 0.0115, P ( T = 1)= 0.0576; adding gives P ( T = 0) + P ( T = 1)= 0.0691; but P(T 5 1)= 0.0692 (to 4 decimal places). This kind of discrepancy occurs occasionally in probability calculations involving rounding and can be ignored. If the pass mark is set at 10, the probability that a student who randomly guesses his answers passes may be found as follows: P(T2 10) = 1- P ( T 5 9) = 1- 0.9974 = 0.0026. In general, the c.d.f. of a binomial random variable Y B(n,p) is given by Unfortunately, this does not have a convenient mathematical form that is quick and easy to evaluate. (If you are doing a statistical analysis using a statistical computer package, then the computer will probably do the calculations for you and produce a probability value directly. This is the easiest way of obtaining particular values of p(y) and F(y) when Y is binomial. Otherwise, you can sum the individual probabilities using a calculator.) In Figure 2.18 are diagrams of four typical binomial probability distributions. They show (a) the number dropping out in the placebo group (Exercise 2.13): B(6,0.14), (b) the number of correct answers guessed (Example 2.16): B(20,0.2), (c) the number of faulty bulbs in a box of ten (Example 2.3): B(10,0.15), (d) the number of 5s in eight rolls of a Double-Five (Example 2.6): B (8,4). Exercise 2.14 (a) If V W B(8,0.3), find the probability P ( V = 2). 1 (b) If W N B(12,0.5),find the probability P ( W = 8). (c) If X - B(6,0.8), find the probability P ( X > 4). (d) If Y B (6,i),find the probability P ( Y 5 2). (e) If Z B (10,i),find the probability P ( Z 5 7).Chapter 2 Section 2.3 (a) Number of dropoilt.~, g (h) Number of correct guesses, y 0.35 0.30 0.30 0.25 0.25 0.20 0.20 0.15 0.15 0.10 0.10 0.05 0.05 0 0 0 1 2 3 4 5 6 7 8 9 1 0 0 1 2 3 4 5 6 7 8 (C) Number of faillt,y hillhs, (d) Number of Ss, ?/ Figure 2.18 Typical members of the binomial family Exercise 2.15 The science of genetics includes the study of hereditable physical features R m. such as eye and hair colour, bone structure, blood group or unusual skin conditions. The Augustinian monk Gregor Mendel (1822-1884) investigated, in some experiments on pea plants, what happened when plants with round yellow peas of a certain kind were crossed. The offspring were not all round and yellow-some were wrinkled and others green, according to the following combinations and in the proportions shown. (These proportions are based on theory. However, observed experimental frequencies were very close to the theoretical predictions.) P(round and yellow) = & P(round and green) = P(wrink1ed and yellow) = P(wrink1ed and green) = Round yellow peas are crossed and produce eight offspring peas. (a) What is the distribution of the number of wrinkled yellow peas amongst the offspring? (b) What is the probability that all eight offspring are wrinkled yellow peas? (c) What is the probability that there are no wrinkled green peas amongst the offspring? Calculation of binomial probabilities using the formula can involve a surprisingly large number of key strokes on your calculator. This is especially true when you are calculating more than one probability in order to calculate the probability that a particular random variable takes one of several 81Elements of Statistics possible values. A set of statistical tables is another option, but these are not necessarily very easy to read and usually contain only a limited number of possibilities for the binomial parameter p. (For example, they may list binomial probabilities for n from 2 to 20 and for p from 0.1 to 0.9 by steps of 0.1 or possibly 0.05. It may be that the problem of interest to you has p equal to 0.37.) An option is to use a computer. Exercise 2.16 Use your computer to calculate directly these probabilities. (a) P ( X = 4) when X N B(10,0.3); (b) P ( X = 6) when X N B(20,0.17); (C) P(X 5 8) when X N B(ll,O.33); (d) P(X 1 8) when X N B(20, i). Parts (e) and (f) illustrate two applications of the binomial distribution. (e) Which is more probable: to obtain at least one 6 in one roll of four dice, or at least one double-6 in twenty-four rolls of two dice? (This problem was discussed by Cardano (1501-1576) and arose again at the gambling table when, in 1654, de M&-&proposed it to Pascal.) ( f ) On any given day of the year (365 days), past experience suggests that the probability of rain is about 0.3. What is the probability that in a whole year it rains at least 100 times? Exercise2.17 At the time of writing this section, one of the authors had a library of 5152 Data supplied by K.J. McConway, books-too many for his shelves-so many of them were stored in boxes. He The Open University. intended to move h&se andihoped that in his new house he would be able to have enough shelving for all his books. He considered that the books currently on his shelves poss&sed the same distribution of widths as his entire collection and so took a sample of 100 books from his shelves to estimate the shape of this distribution. The data are shown in Table 2.20. Table 2.20 Widths of 100 books (mm) (a) Plot a histogram of this sample, and calculate its mean and standard deviation. Using your calculated mean, obtain an estimate in metres of the total length of shelf space the author needed. (b) Comment on any similarities or differences between your sample histogram and the bell-shaped distribution of S?ction 2.4. In Section 2.1 you conducted some simulations using a die and a coin. Simulation can be a very powerful tool to investigate natural phenomena and is normally done using a computer. For example, suppose we wish to explore the statistical properties of an engineering production line. We may believe that the objects produced each have a probability p of being faulty, and that whether or not an object is faulty is independent of whether any other object is faulty. We might be interested in how often all six objects in a groupElements of Statistics of six will be in working order (perhaps the objects .are packed in boxes of six). We could try to explore this mathematically and indeed the problem is not very hard. Following the description (in Section 2.3) of the binomial distribution, we know that the proportion of boxes containing six working components out of six is (1-p)6. Alternatively, since we have a well-defined mathematical model, we could program a computer to behave in the same way as we believe the production line behaves. We could get the computer to generate random OS and 1s so that a proportion p of them were 1s and the others OS, and interpret 1as corresponding to a faulty product. Then we would look through the sequence of OS and 1s generated by the computer and grouped in sixes, and see how often a set of six is all OS. This is an example of simulation. It is a rather artificial example in that it is easy to work out the answer algebraically, as has been done. As the course progresses, we shall discover more realistic situations and reasons for using simulation approaches. To get used to the idea of generating data on your computer, try the following exercises. Exercise 2.18 (a) Using the Bernoulli random number generator of your computer, generate 10 values from a Bernoulli distribution with parameter p = 0.2, and calculate the total number of 1s amongst the 10 values. Now use the binomial random number generator to generate a single value from a binomial distribution B(10,0.2). What is the relationship between the populations from which these two numbers have come? (b) Again using the binomial random number generator, generate 10 values from a B(20,0.5) distribution, 100 values from the same B(20,0.5) distribution and then 500 values from the same B(20,0.5) distribution. In each of the three cases produce a bar chart of the samples. Comment on the differences between the three bar charts in terms of how jagged and irregular they are. (c) Using the binomial random number generator, generate 500 values from (i) a binomial distribution with parameters n = 10 and p = 0.1; (ii) a binomial distribution with parameters n = 10 and p = 0.3; (iii) a binomial distribution with parameters n = 10 and p = 0.5. In each case, produce a bar chart for the 500 values. How do you think the parameter p affects the shape of the binomial distribution? (d) Using the binomial random number generator, generate 500 values from (i) a binomial distribution with parameters n = 10 and p = 0.2; (ii) a binomial distribution with parameters n = 30 and p = 0.2; (iii) a binomial distribution with parameters n = 50 and p = 0.2. In each case produce a bar chart of the 500 values. What effect do you think the parameter n has on the shape of the binomial distribution?Chapter 2 Section 2.5 The next exercise is about the simulation of an industrial process. Exercise 2.19 Fuses for use in domestic electrical appliances are packaged in bags of eight for sale to customers. The probability that any fuse is defective is 0.012. A retailer buys a box of 100 of these bags direct from the manufacturer. Use your computer to 'open the bags' and count the number of defective fuses in each one. How many bags contained no defectives? How many contained just one? Complete a frequency table like the one in Table 2.21. Table 2.21 Defective fuses Number of Frequency defective fuses Total 100 The next exercise is about generating the results from simulated rolls of a die. Exercise 2.20 (a) Use your computer to roll a fair six-sided die 6 times; compare the sample relative frequencies for each of the six different outcomes with the theoretical probabilities. (b) Now use your computer to roll the die 600 times and repeat the calculations. Exercise 2.21 A researcher is exploring the theory that after early injury to the left half of the brain, the brain reorganizes itself to compensate for the loss. She hypothesizes that one manifestation of such reorganization would be that people who would otherwise have been right-handed would, after such damage and reorganization, become left-handed. To test this hypothesis she wishes to compare the proportion of left-handed people in the population of the United Kingdom with the proportion of left-handed people in a sample of brain-damaged people. She knows that in the United Kingdom population, around 10% of the people are left-handed. In a sample of 33 people who were brain-damaged at birth, 8 were found to be left-handed. Eight out of 33 represents a proportion of about 24%. Data were provided by Dr S.L. Channon, Middlesex Hospital, University College London.Elements of Statistics This suggests that there may be some basis for the researcher's theory. However, we should explore the random variation that might be observed in samples from the wider population. If a count as high as 8 turns out to be not unusual, then, on the evidence of this experiment at least, there may be no foundation for her belief. Using the binomial random number generator on your computer, generate 100 samples from a binomial distribution with parameters n = 33 and p = 0.1, i.e. 10%, and see what fraction of these samples produce a count of 8 or more. This fraction gives you an indication of how often you might expect to obtain as many as 8 out of 33 left-handed people, if the proportion of left-handed people in the overall population from which the sample was drawn was only 10%. If this fraction is very small then the researcher can feel confident that there is some substance to her hypothesis. If the fraction is large then such an outcome (at least 8 out of 33) could easily have arisen by chance. This is an example of a statistical hypothesis test; hypothesis testing is described more formally in depth later in the course. If your computer incorporates functions or procedures for the triangular density Triangular(B), you can use the following exercise to investigate the command syntax. Otherwise, use your calculator. Exercise 2.22 (a) If the continuous random variable V follows a triangular distribution with parameter 60, i.e. V- Triangular(GO), find (i) P ( V I 2 0 ) ; (ii) P ( V > 40); \ (iii) P(20 5 V 5 40). (h) The following table gives the waiting times, that is, the gap (to the nearest Cox, D.R. and Snell, E.J. (1981) half-hour) between consecuti've admissions at an intensive care unit. (The ,Applied Statistics-Princ~ples and data are read across the rows.) Examples. Chapman and Hall, London, D. 53. The data were Table 2.22 Waiting times between admissions (hours) collectedAbyDr A. Barr, Oxford Regional Hos~ital Board. (i) Obtain a histogram for these data. (ii) Comment on the feasibility of fitting a triangular model to these data, and decide on a sensible value for the indexing .parameter 8. (iii) Use your model to determine the long-term proportion of waiting times that would exceed 100 hours. Compare this with the corresponding estimate of that proportion, based on these data.Chapter 2 Section 2. [Show More]
Last updated: 1 year ago
Preview 1 out of 105 pages
Instant download

Buy this document to get the full access instantly
Instant Download Access after purchase
Add to cartInstant download
Reviews( 0 )
Document information
Connected school, study & course
About the document
Uploaded On
Jan 28, 2020
Number of pages
105
Written in

Additional information
This document has been written for:
Uploaded
Jan 28, 2020
Downloads
0
Views
61


.png)
