Statistics > QUESTIONS & ANSWERS > Elements of Statistics. Chapter 1 to chapter 14 Exercise Solutions. All Answers 100% and Explained (All)
Elements of Statistics. Chapter 1 to chapter 14 Exercise Solutions. All Answers 100% and Explained
Document Content and Description Below
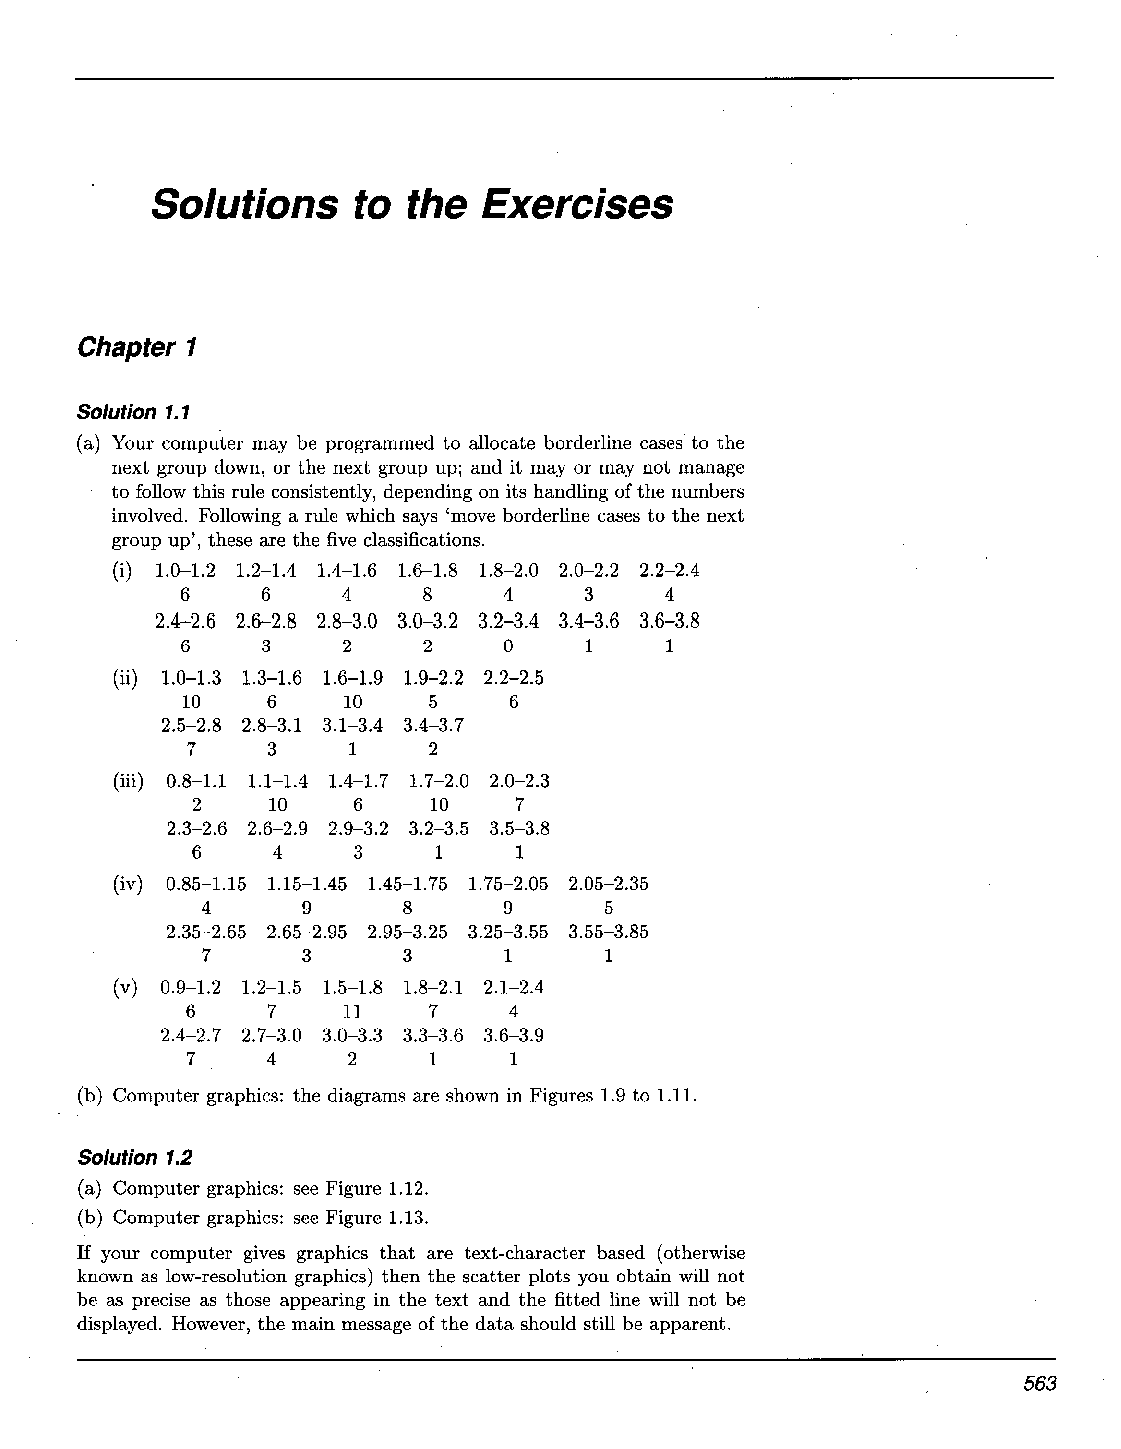
Exercise 3.1 In Chapter 2, you were also introduced to certain unfair dice called Tops and Table 3.4 A Double-Five you saw that, for a Double-Five, the probability distribution for the outcome j 1 ... 3 4 5 6 of a single roll is as given in Table 3.4. p ( j ) 1 1 L ~-~ 6 3 6 What is the mean of this distribution? How does it compare with the mean outcome for a fair die? One model for a certain disease within a particular family of 6 gave the prob- Table 3.5 A family of 6 ability distribution for the number X , who eventually suffer from the disease, 1 2 3 4 5 6 as shown in Table 3.5. 8 15 20 24 20 P ) & S S S 56 What is the mean of the distribution of X ? What is the mean score resulting from a toss of a fair coin, if we score 1 for Heads and 0 for Tails?Elements of Statistics (b) Suppose that a random variable is defined to take the value 1when a fair die shows a 3 or a 6, and 0 otherwise. What is the mean value for this Bernoulli distribution? A chainlet of length four is called a 'quad'. The original chain will result in two quads being projected, for instance, only if the middle joint breaks and the other six do not: the probability of this is p(l - p ) 6 . The probability distribution of the number of quads projected is given in Table 3.7. Again, do not worry about the algebraic details. Table 3.7 The probability distribution of the number of quads, Y Y P ( Y ) Find the expected value of Y when (a) p = 0.1; (b) p = 0.4; (c) p = 0.6; (d) p = 0.8. Exercise 3.5 (a) Generate a random sample of size 10 from the triangular distribution with parameter 0 = 20. List the elements of your sample and calculate the sample mean. (b) Find the mean of a random sample of size 1000 from the triangular distribution with parameter 0 = 20. Repeat the sampling procedure a further nine times and list the ten sample means you obtained. (You should find that your list offers supporting evidence for the result stated in Example 3.7(a): that the mean of the triangular distribution Triangular(20) is 6g.) (c) Find the mean of random samples of size 1000 from triangular populations with parameters (i) 0 = 30; (ii) 0 = 300; (iii) 0 = 600. (d) Use your results in this exercise to hazard a guess at the mean of the continuous random variable T when T Triangular(@ Exercise 3.6 For the triangular distribution with parameter 0, the c.d.f. is given by and the mean of the distribution is p = i0. It is assumed in a traffic monitoring context that the triangular density provides an adequate model for the waiting time between successive vehicles, but the value of the parameter 0 is unknown. (It could be one of the aims of a sampling experiment to estimate the value of 0: see Chapter 6 for more on the topic of estimation.) What proportion of waiting times is longer than average? What is the variance of the outcome of throwing a Double-Five? How does this compare with the variance for a fair die? The entries in Table 3.8 are values of the joint probability mass function Table 3.8 A joint p.m.f. pX,y(x,y) of random variables X and Y. The random variable X takes the values 0, 1 and 2, and Y takes the values -1 or 1. The columns of the table correspond to the random variable X with p.m.f. px(0) = 0.4, px(1) = 0.4 and px(2) = 0.2. The rows are associated with the random variable Y with p.m.f. py(-l) = 0.3 and py ( l ) = 0.7. Notice that the separate probabilities for X are found by adding within columns, and the separate probabilities for Y by adding within rows. Are X and Y independent random variables? Exercise 3.9 Evidently, the number N is a random variable: it is impossible at the start of the sequence to forecast with certainty the number of the trial at which success will first occur. Assume independence and that the probability of success at any trial is p, 0 < p < 1, in the following. (a) Write down the probability P ( N = 1). (b) Write down the probability P ( N = 2). (c) Write down the probability P ( N = 3). (d) Using your answers to parts (a), (b) and (c), try to find a general formula for the probability P ( N = n). (e) State the range of possible values for the random variable N Exercise 3.10 Suppose that Nicholas Bernoulli was right, and his hypothesis that the sex of children may be modelled as independent rolls of a 35-sided die, with 18 faces marked 'boy' and the other 17 marked 'girl', was a correct one. Under a stopping rule 'stop after the first son', what proportion of completed families comprise at least four children? Suppose that the proportion of defective chips leaving a chip factory's assembly line is only 0.012: manufacturing standards are quite high. A quality inspector collects daily a random sample. He examines sampled chips in the order in which they came off the assembly line until he finds one that is defective. He decides that he will halt production if fewer than six chips need examining. What proportion of his daily visits result in a halt in production? Exercise 3.11 The proportion of defective products in a battery factory is 0.02. A quality control inspector tests batteries drawn at random from the assembly line. What is the probability that he will have to examine more than 20 to obtain a faulty one? What is the probability that he will have to examine at least 50? Exercise 3.12 Without doing any arithmetic, try to answer the following questions. (Just jot down your first reaction.) (a) The probability that a fair coin shows Heads when it is tossed is i. How many times, on average, do you think a coin would need to be tossed to come up Heads? (b) The probability that a Double-Five comes up showing 5 when it is rolled is = i. On average, how many times do you think a Double-Five would need to be rolled to show a 5? (c) One car in six on British roads is white. If you stand by the side of the road and start counting, how many cars, on average, do you think you would have to count to record your first white one? (d) The probability that a car starts first time in the morning is p, where 0 < p < 1. Assuming that attempts to start it can be modelled as a sequence of Bernoulli trials, guess in terms of p the average number of attempts necessary to get it going each morning. (The assumption that a Bernoulli model will be a useful one is probably not reasonable in this case: most cars just need 'encouraging'. If it does not start first time, then it will almost certainly start at the second or third; and if not then, then not at all.) Exercise 3.13 In some board games, progress round the board is dictated by the score from a roll of a six-sided die. In some games, you cannot start playing until you have obtained your first six (and then you move accordingly). If you score some other number, you have to wait until your next turn and then make another attempt. (a) What is the probability that you can start playing with your first roll of the die? (b) What is the probability that you can start playing only at your second roll? At your third? (c) What is the probability that you will need at least six rolls to get started? (d) Find the expected number of rolls required to get you started, and calculate the standard deviation. Exercise 3.15 Use a sketch of the p.d.f. of X to find the following for the uniform random variable X U(a,b): (a) the mean (use a symmetry argument); (b) the cumulative distribution function. Write down the variance of the standard uniform random variable X - U(0,l), H and hence calculate its standard deviation. Exercise 3.17 (a) In a simulation experiment, a computer is programmed to generate pseudo- B random numbers from the continuous uniform distribution on U ( a ,b ) . What is the median of this distribution? (b) Theory suggests that a particular random variable X has p.d.f. (i) Sketch the density function of X. (ii) The mean of X is p = $. Show this on your sketch of the density of X . (iii) The c.d.f. of X is given by Calculate the median m of the random variable X and show m on your sketch. Find the interquartile range for the distribution with p.d.f Exercise 3.19 (a) Find the median of the binomial distribution B(10,0.5). (b) Find the median of the binomial distribution B(17,0.7). (c) Find the upper quartile of the binomial distribution B(2,0.5). (d) Find the interquartile range of the binomial distribution B(19,0.25). (e) Find the 0.85-quantile of the binomial distribution B(15,0.4) [Show More]
Last updated: 1 year ago
Preview 1 out of 105 pages
Instant download

Buy this document to get the full access instantly
Instant Download Access after purchase
Add to cartInstant download
Reviews( 0 )
Document information
Connected school, study & course
About the document
Uploaded On
Jan 28, 2020
Number of pages
105
Written in

Additional information
This document has been written for:
Uploaded
Jan 28, 2020
Downloads
0
Views
59


.png)
