Geography > QUESTIONS & ANSWERS > Questions and Answers > University of British Columbia - EOSC 114waves-assignment. Quiz Score: 35.71 (All)
Questions and Answers > University of British Columbia - EOSC 114waves-assignment. Quiz Score: 35.71 out of 39
Document Content and Description Below
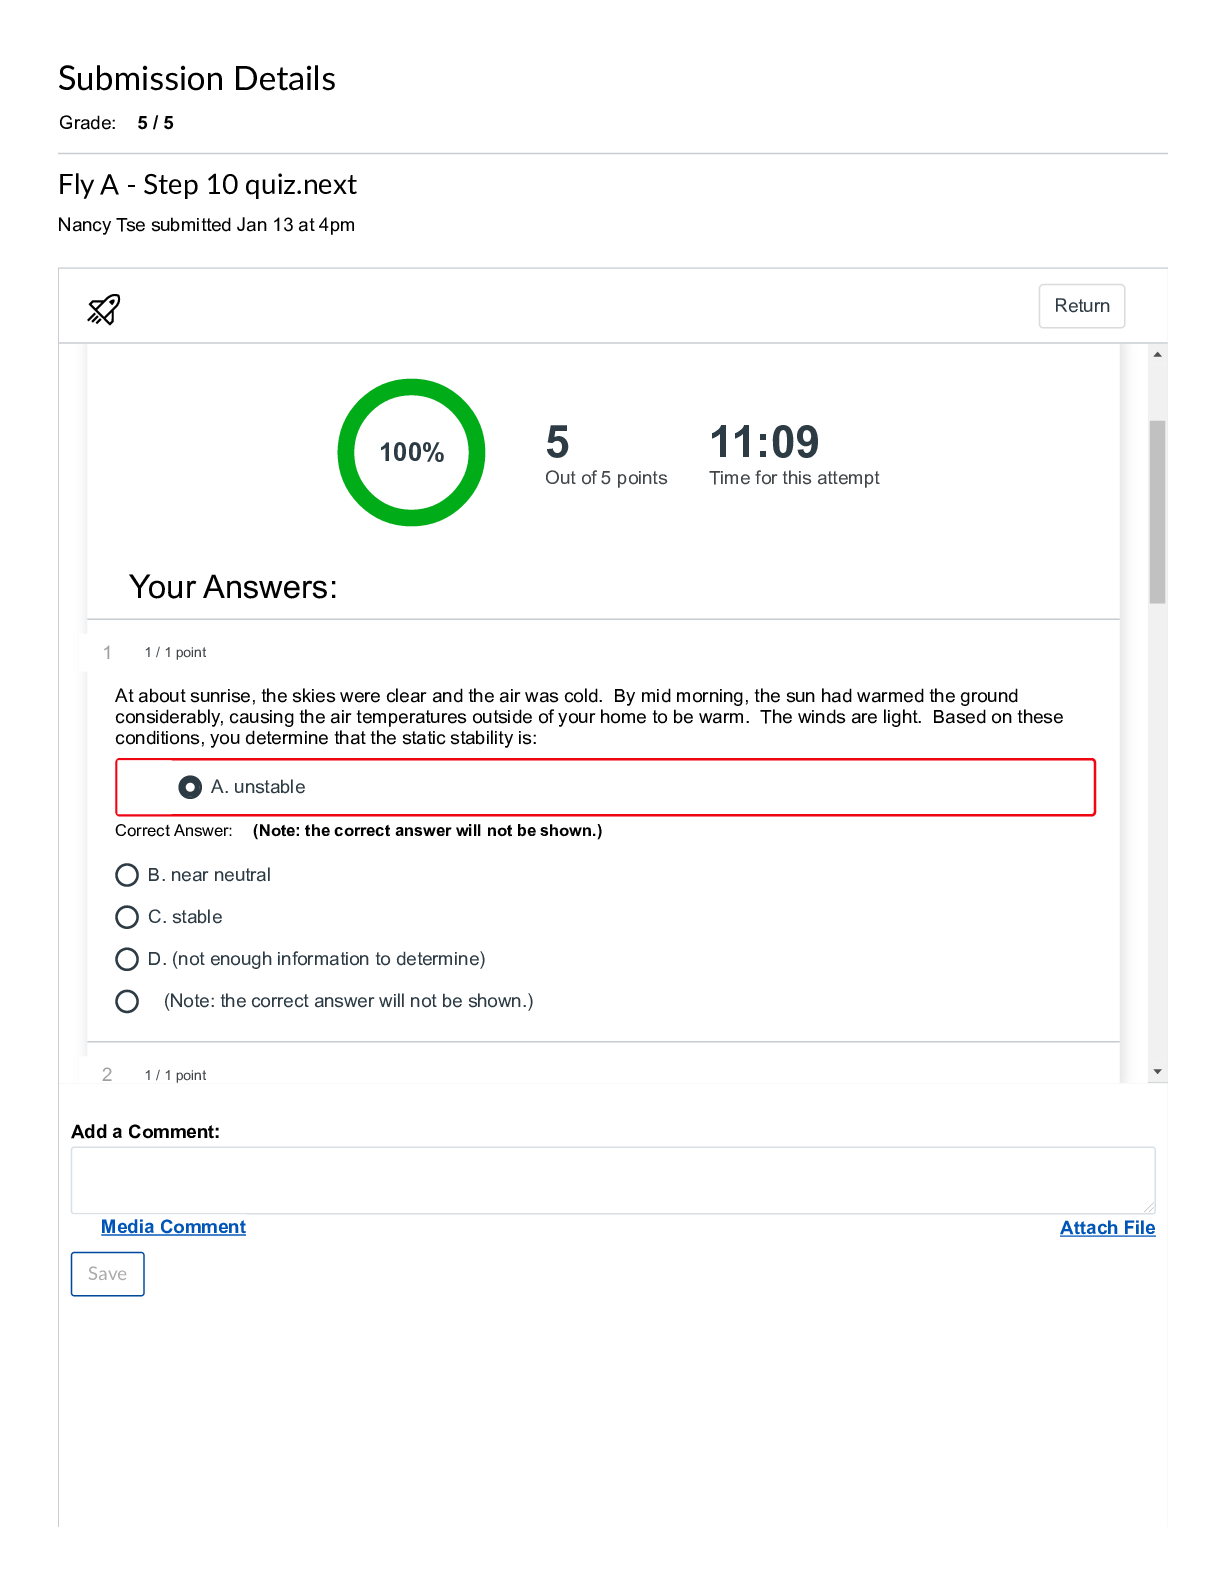
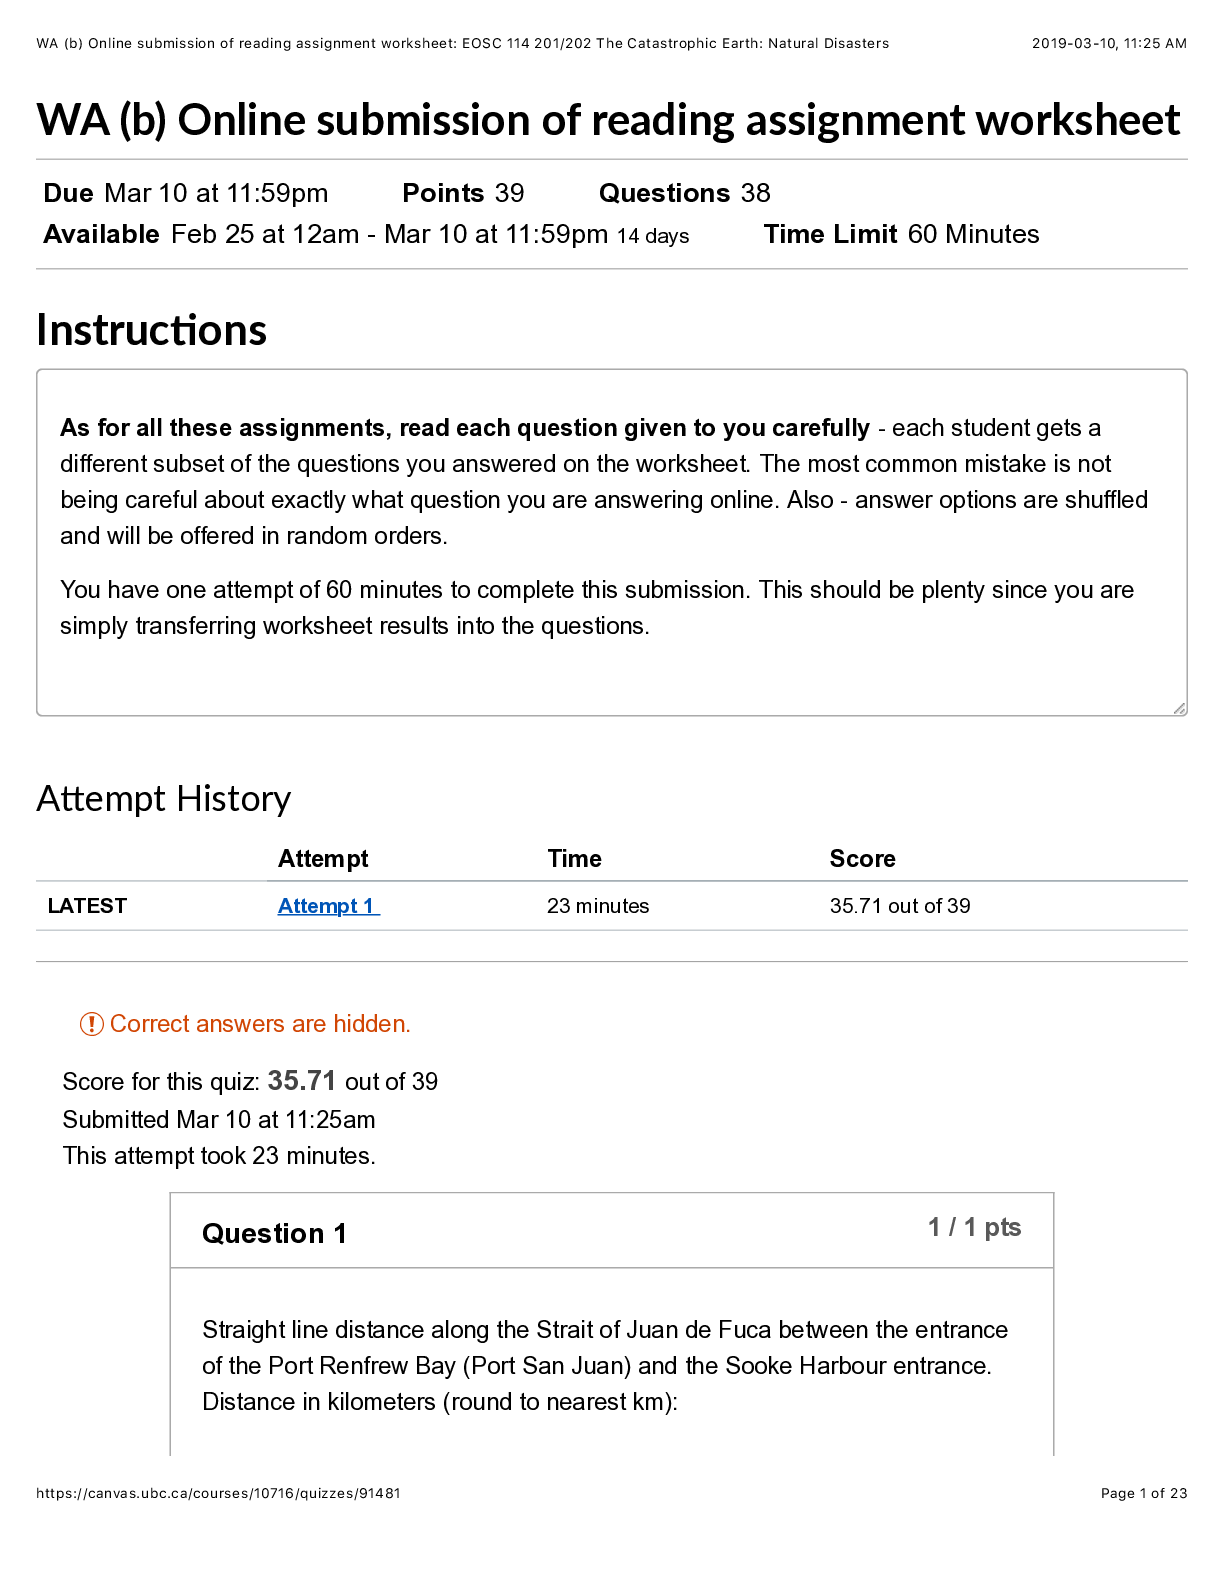
WA (b) Online submission of reading assignment worksheet | Due Mar 10 at 11:59pm | Points 39 | Questions 38 | Available Feb 25 at 12am - Mar 10 at 11:59pm 14 days | Time Limit 60 Minutes | In... struc!ons A!empt History Attempt Time Score LATEST Attempt 1 23 minutes 35.71 out of 39 ! Correct answers are hidden. Score for this quiz: 35.71 out of 39 Submitted Mar 10 at 11:25am This attempt took 23 minutes. As for all these assignments, read each question given to you carefully - each student gets a different subset of the questions you answered on the worksheet. The most common mistake is not being careful about exactly what question you are answering online. Also - answer options are shuffled and will be offered in random orders. You have one attempt of 60 minutes to complete this submission. This should be plenty since you are simply transferring worksheet results into the questions. | Question 1 1 / 1 pts | Straight line distance along the Strait of Juan de Fuca between the entrance of the Port Renfrew Bay (Port San Juan) and the Sooke Harbour entrance. Distance in kilometers (round to nearest km): | Question 2 1 / 1 pts | Straight-line distance in km between the entrance to Cadboro Bay and just off shore at Sidney. 24 | Question 3 2 / 2 pts | For the following places on the map provided, label them in order from 1 for MOST vulnerable to 6 for LEAST vulnerable, should a tsunami arrive from the Pacific Ocean west of the map. NOTE: order from MOST=1 to LEAST=6. Pachena Beach (in the Pacific Rim National Park) or Bamfield (a marine sciences centre used by UBC researchers and students) 1 most vulnerable Port San Juan (Renfrew) 2 Sooke 3 Victoria 4 Sidney 5 Nanaimo 6 least vulnerable | Question 4 1 / 1 pts | Read the summary page (<5 minutes). Which of these lines of evidence was NOT incorporated into this report? computer simulations of rock- and land-slides from mountainsides into Howe Sound or Indian Arm oral traditions of first nations people of SW. British Columbia computer simulations of tsunami caused by CSZ (Cascadia Subduction Zone) earthquakes Studies of geological sediments that would have been deposited by tsunami computer simulations of underwater landslides or slumps around the mouth of the Fraser River | Question 5 1 / 1 pts | From section 2, which of these factors is NOT a factor contributing to a coastline’s tsunami hazard? Type of coastline (rocky, sandy, etc.) Underwater topography just off-shore Local topography of the shoreline area Direction of the travelling tsunami wave relative to direction of shoreline Potential for resonance or amplification within a bay or harbour | Question 6 1 / 1 pts | Use the google-maps distance-measuring procedure to estimate the distance a boat would travel along the inlet between Bamfield and Port Alberni (not the straight line or 'as the crow'; flies distance). ______ km. 30 - 39.999 km less than 10 km 40 - 49.999 km Greater than 80 km. 60 - 79.999 km 50 - 59.999 km 10 - 19.999 km. | Question 7 1.71 / 2 pts | Answer 1: Answer 2: Answer 3: In January of the year 1700 a tsunami caused damage at sites up to a maximum wave height of 5 m., along 1000 km of coastline in Japan. This tsunami was later determined to have been caused by a great earthquake of moment magnitude close to 9 , that happened January the event of 1700. 26 at 9 :00 pm, off the Pacific northwest coast of North America. By studying sedimentary deposits, the 1964 Alaska earthquake was determined to have been smaller in magnitude compared to Answer 4: Answer 5: Answer 6: Answer 7: smaller | Question 8 1 / 1 pts | If you wanted to ensure your new vacation property faced an annual probability of inundation that is less than 0.005 (i.e. 1 in 200), at what minimum elevation above msl should it be built? 1.5m above msl 0m (at sea level) 3m above msl 2.5m above msl Incorrect Incorrect | Question 9 0 / 1 pts Section 7 outlines the risk to North Shore coastal regions from storm waves. Your friend who lives on the south-facing coast of West Vancouver says: “there’s no way our house on the waterfront is in danger. We know waves encountered by friends across the bay in Kitsilano never reached more than 2m height even in the huge storm of December 15, 2006”. What’s your best response to this? (Hint: check your maps to compare locations and orientation of the shorelines at West Vancouver and Kitsilano.) Your friend is probably right – both shorelines are on the same bay. Your friend is probably wrong – the distance that wind can travel over open water for some wind directions will likely result in waves that are larger on the north shore than the south shore of this bay. Your friend is probably right – the distance that wind can travel over open water for both shorelines is pretty similar for waves coming from any direction. Your friend is probably right – the difference in near-shore depth patterns likely caused waves at Kitsilano to be larger than you would experience in North Vancouver. Your friend is probably wrong – the shape of the bay will cause all waves along the north side to be larger than the south side. It depends on applying your understanding of “fetch” to the specific setting; you need to have a picture of both shorelines and the ocean configuration around them. Also, this reason was expressed in the reading. | Question 10 1 / 1 pts | The main purpose for this reading is to . . . (Hint: consider where or how it harbor.) provide information for a person or organization who requested it. present and discuss recommendations about scientific priorities in the peerreviewed literature. communicate new scientific methods, procedures or discoveries to experts in the subject. offer social commentary to any reader. provide news for the general public. explain some scientific matters to the general public. | Question 11 0.5 / 0.5 pts The author(s) identified uncertainties, incomplete aspects or needs for further work. False True | Question 12 0.5 / 0.5 pts | Descriptions of "aesthetic" aspects like scenes, views and impressions were included. False True | Question 13 0.5 / 0.5 pts | The author(s) targeted human emotion as part of their writing strategies. False True Question 14 1 / 1 pts Which section in this report would be UNlikely to occur in a peer reviewed journal article, even if using somewhat different subtitles Modelling results References Statement of qualifications and limitations Background Potential next steps | Question 15 1 / 1 pts | The authors chose one out of how many possible 1-in-500-year earthquake scenarios? 12 15 9 2 1 5 | Question 16 1 / 1 pts | Answer 1: Answer 2: The computer-based mathematical model used to analyze tsunami behavior and effects was considered the best out of a total of 8 competing models that were tested in the year 2009 . 8 2009 | Question 17 1 / 1 pts | This is the official model used in several places, but which of following does NOT use this model? Alaska US Gulf Coast states Hawaii American Samoa Question 18 1 / 1 pts A complete and seamless Digital Elevation Model (or DEM) was needed, including above and below sea topography. All of the following challenge had to be overcome except one. Which is the one challenge not mentioned as needing attention before a final DEM could be produced? Different sources of data having varying accuracies and reliabilities; Sections of shoreline not having continuous data Differences between US and Canadian sources, including overlapping data having inconsistent elevations; Differences in the definition of “sea level” for different jurisdictions Different sources using different datums (i.e. differing definitions of “zero” elevation) | Question 19 1 / 1 pts | Based on observations of the tsunami caused by the 2011 Tohoku earthquake, the maximum water level occurring in Japan due to that event was ___ times larger than the maximum water level predicted for Greater Victoria in this study. 11.428 | Question 20 1 / 1 pts | Emergency planning decisions depend upon several “elevations” or heights, including the following 4 factors: A) The maximum high tide elevation; B) The maximum tsunami wave height; C) Uncertainties regarding earthquake size, initial tidal conditions and topographic data; D) the amount ground will sink in an earthquake. The so-called Tsunami Hazard Line is a line representing a certain elevation along the coast. Calculation of this line includes: The sum of all 4 factors The sum of factors B, C and D The sum of factors A, B and D The sum of factors A and B The sum of factors A, B and C Factor A only Factor B only | Question 21 1 / 1 pts | The greatest drop in sea level will occur at which location? Esquimalt Harbour entrance Cadboro Bay Victoria Harbour entrance Sidney Port Renfrew entrance Sooke Harbour entrance | Question 22 1 / 1 pts | The largest high-water level will occur at which location? Port Renfrew entrance Sidney Esquimalt Harbour entrance Sooke Harbour entrance Victoria Harbour entrance Cadboro Bay | Question 23 3 / 3 pts | Which three of these locations will experience variations between high and low water heights of MORE than 3.5 meters? - Selecting a correct option adds a point to this question's score, - Selecting an INCORRECT option removes a point - Leaving any option blank neither adds nor removes a point. - Score will not be less than 0. Victoria harbour entrance Esquimalt harbour entrance Sooke Harbour entrance Port Refnfrew entrance Cadboro Bay Sidney | Question 24 1 / 1 pts | The executive summary ends with suggestions for how the client might use these results. Which one of the following was NOT mentioned as a potential next step? Determining whether land use or zoning in the region is appropriate. Planning how to get people out of the area. Setting up contingencies handling transport of goods and people. Incorporating potential tsunami into a regional plan for responding to emergencies. Evaluating whether built facilities like docs, breakwaters, roads etc. are adequate. | Question 25 0 / 1 pts | Figure 5.2: In areas east of Cape Flattery, where is the maximum drawdown of water levels expected? Refer to our own map at the end of the worksheet to find Cape Flattery. Parts of the southern edge of the Strait of Juan de Fuca between Cape Flattery and Sooke Harbour Bays and inlets of Esquimalt or Victoria. Central region of the Strait of Juan de Fuca south and east of Victoria and Esquimault Some waterways among islands east of Cadboro Bay and Sidney Parts of the northern edge of the Strait of Juan de Fuca between Cape Flattery and Sooke Harbour Middle (not edges) of the Strait of Juan de Fuca between Cape Flattery and Sooke Harbour | Question 26 1 / 1 pts | Assume Port San Juan (entrance near Port Renfrew) and Sooke Harbour entrance are 58 km apart. Based on this distance and Tsunami Arrival Time data in Table ES1 (considered above), what is the average speed in km/hr of the tsunami wave traveling between these two points? This is just arithmetic but you must be careful with units. Distance is in km. Time difference from Table ES1 is in minutes, and we want wave speed in km/hr. | Question 27 1 / 1 pts | How do you expect wave speed to compare to water-flow speed in the center of the Juan de Fuca Strait? The difference is that water-flow speed is the rate at which WATER moves, while tsunami wave speed is the rate at which ENERGY (i.e. the wave crest) moves. Water speed is much slower than half the wave speed Water speed is closer to half the wave speed Water speed is much faster than wave speed Water speed is similar to wave speed Water speed is a little faster than wave speed | Question 28 1 / 1 pts | Figure 6.2 is a satellite photo of Victoria’s harbour with the Tsunami Hazard Line plotted over the image. (NOTE north is to the left and west is down on this photo.) Which of the following regions encompasses the largest area that could experience serious damage, should the event used by this study occur? Docks on the East side of Victoria Harbour’s entrance. Homes and parks along the coast immediately west of Victoria’s harbour entrance. Homes along the north edge of “West Bay” The golf course in the north-west (i.e. lower left) corner of this image. Buildings near the shoreline immediately to the east of the harbor entrance breakwater. | Question 29 0.5 / 0.5 pts | Assertions and arguments were supported by new, previously unreported scientific observations, measurements or experiments; True False | Question 30 0.5 / 0.5 pts | Narrative or personal stories were incorporated into the article; False True | Question 31 0.5 / 0.5 pts | Assertions and arguments were supported by scientific observations, measurements or experiments that have already been reported on elsewhere; True False | Question 32 1 / 1 pts | The main purpose for this second reading is to . . . present and discuss recommendations about scientific priorities in the peerreviewed literature. communicate new scientific methods, procedures or discoveries to experts in the subject. explain some scientific matters to the general public. provide news for the general public. provide information for a person or organization who requested it. offer social commentary to any reader. | Question 33 1 / 1 pts | Along the portion of Crescent Beach circled here, how many jetties can you see in use? | Question 34 1 / 1 pts WA (b) Online submission of reading assignment worksheet: EOSC 114 201/202 The Catastrophic Earth: Natural Disasters 2019-03-10, 11:25 AM https://canvas.ubc.ca/courses/10716/quizzes/91481 Page 21 of 23 Along the portion of Crescent Beach circled here, how many breakwaters can you see in use: None | Question 35 0 / 1 pts | Just north of the circled are of Crescent Beach is “Blackie Spit”. What is the predominant direction that sand moves along the beach at Blackie Spit due to longshore transport? The sand does not appear to exhibit longshore drift. From south-west towards the north-east From north-west towards the south-east From north-east towards the south-west From south-east towards the north-west | Question 36 1 / 1 pts | Along the south-facing White Rock beach, how many jetties can you see in use? more than 20 1-2 7-12 3-6 | Question 37 1 / 1 pts | Along the south-facing White Rock beach, how many breakwaters can you see in use: 1-2 | Question 38 1 / 1 pts | Along the south-facing White Rock beach, what is the predominant direction that sand moves due to longshore transport? The sand does not appear to exhibit longshore drift. From north towards the south From south towards the north From west towards the east From east towards the west [Show More]
Last updated: 1 year ago
Preview 1 out of 23 pages
Reviews( 0 )
Document information
Connected school, study & course
About the document
Uploaded On
Feb 27, 2021
Number of pages
23
Written in

Additional information
This document has been written for:
Uploaded
Feb 27, 2021
Downloads
1
Views
121