Geography > QUESTIONS & ANSWERS > University of British Columbia_EOSC 114 Homework: Waves and Tsunami. This exercise is a mixture of s (All)
University of British Columbia_EOSC 114 Homework: Waves and Tsunami. This exercise is a mixture of short readings and questions aimed at learning goals in the Waves Module associated with tsunami and shoreline or coastal hazards.
Document Content and Description Below
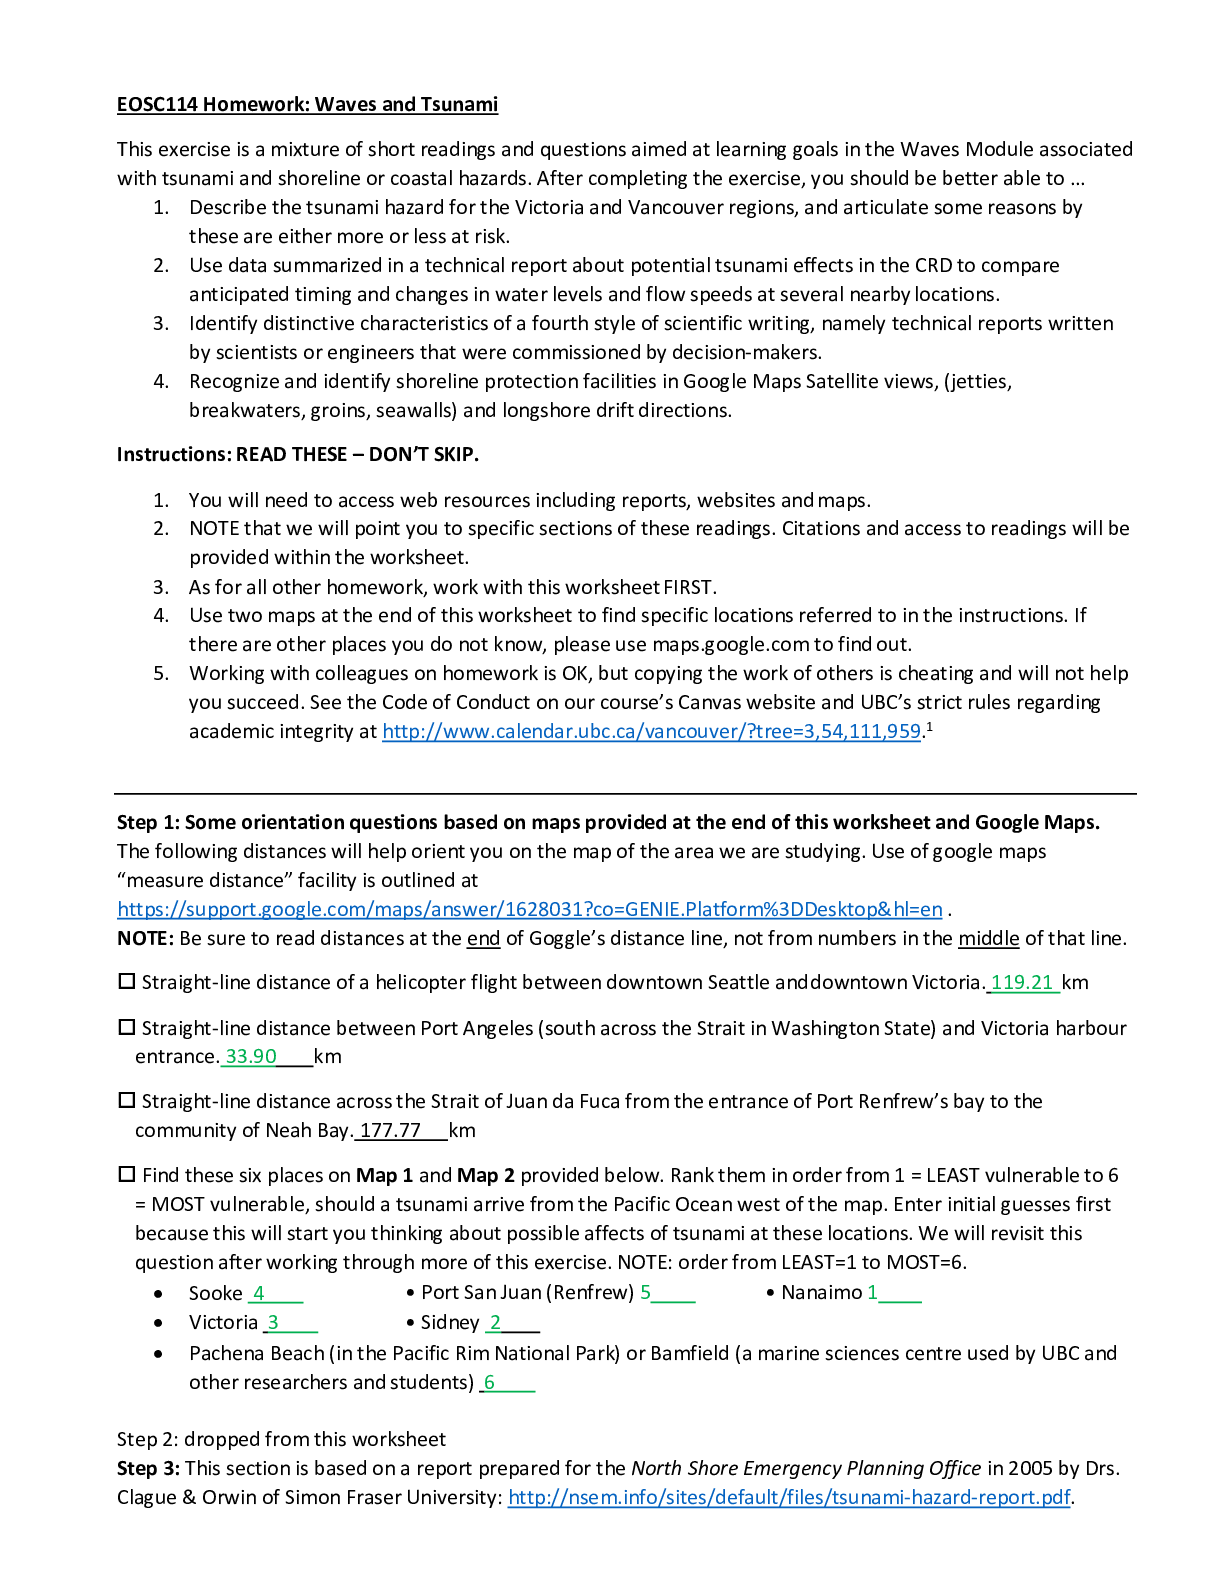
EOSC114 Homework: Waves and Tsunami This exercise is a mixture of short readings and questions aimed at learning goals in the Waves Module associated with tsunami and shoreline or coastal hazards. A... fter completing the exercise, you should be better able to … 1. Describe the tsunami hazard for the Victoria and Vancouver regions, and articulate some reasons by these are either more or less at risk. 2. Use data summarized in a technical report about potential tsunami effects in the CRD to compare anticipated timing and changes in water levels and flow speeds at several nearby locations. 3. Identify distinctive characteristics of a fourth style of scientific writing, namely technical reports written by scientists or engineers that were commissioned by decision-makers. 4. Recognize and identify shoreline protection facilities in Google Maps Satellite views, (jetties, breakwaters, groins, seawalls) and longshore drift directions. Instructions: READ THESE – DON’T SKIP. 1. You will need to access web resources including reports, websites and maps. 2. NOTE that we will point you to specific sections of these readings. Citations and access to readings will be provided within the worksheet. 3. As for all other homework, work with this worksheet FIRST. 4. Use two maps at the end of this worksheet to find specific locations referred to in the instructions. If there are other places you do not know, please use maps.google.com to find out. 5. Working with colleagues on homework is OK, but copying the work of others is cheating and will not help you succeed. See the Code of Conduct on our course’s Canvas website and UBC’s strict rules regarding academic integrity at http://www.calendar.ubc.ca/vancouver/?tree=3,54,111,959.1 Step 1: Some orientation questions based on maps provided at the end of this worksheet and Google Maps. The following distances will help orient you on the map of the area we are studying. Use of google maps “measure distance” facility is outlined at https://support.google.com/maps/answer/1628031?co=GENIE.Platform%3DDesktop&hl=en . NOTE: Be sure to read distances at the end of Goggle’s distance line, not from numbers in the middle of that line. Straight-line distance of a helicopter flight between downtown Seattle anddowntown Victoria. 119.21 km Straight-line distance between Port Angeles (south across the Strait in Washington State) and Victoria harbour entrance. 33.90 km Straight-line distance across the Strait of Juan da Fuca from the entrance of Port Renfrew’s bay to the community of Neah Bay. 177.77 km Find these six places on Map 1 and Map 2 provided below. Rank them in order from 1 = LEAST vulnerable to 6 = MOST vulnerable, should a tsunami arrive from the Pacific Ocean west of the map. Enter initial guesses first because this will start you thinking about possible affects of tsunami at these locations. We will revisit this question after working through more of this exercise. NOTE: order from LEAST=1 to MOST=6. Sooke 4 Victoria 3 • Port San Juan (Renfrew) 5 • Sidney 2 • Nanaimo 1 Pachena Beach (in the Pacific Rim National Park) or Bamfield (a marine sciences centre used by UBC and other researchers and students) 6 Step 2: dropped from this worksheet Step 3: This section is based on a report prepared for the North Shore Emergency Planning Office in 2005 by Drs. Clague & Orwin of Simon Fraser University: http://nsem.info/sites/default/files/tsunami-hazard-report.pdf.NOTE: this is an excellent example of technical writing prepared by experts for decision makers. It is concise, rigorous and well-referenced, yet highly readable and very well organized. We will identify exactly where to look for answers to these questions, BUT, this report is well worth taking ½ hr to read because it is very consistent with the tsunami and coastline hazards portion of our course. Part 2 is an especially clear background section. Read the summary page (<5 minutes). Which of these lines of evidence was NOT incorporated into this report? Check more than one and fewer than 6. oral traditions of first nations people of SW. British Columbia WAS computer simulations of tsunami caused by CSZ (Cascadia Subduction Zone) earthquakes WAS computer simulations of underwater landslides or slumps around the mouth of the Fraser River NOT computer simulations of rock- and land-slides from mountainsides into Howe Sound or Indian Arm NOT comparisons of the North Vancouver coastal setting to the coastal setting of southernAlasak WAS Studies of geological sediments that would have been deposited by tsunami NOT From section 2, which one of these factors IS a factor contributing to a coastline’s tsunami hazard? Check more than one and fewer than 6. Local topography of the shoreline area DOES Type of coastline (rocky, sandy, etc.) NOT Underwater topography just off-shore DOES Direction of the travelling tsunami wave relative to direction ofshoreline DOES The number of years since the previous tsunami experienced at thatsite. NOT Potential for resonance or amplification within a bay or harbour DOES Use the google-maps distance-measuring procedure to estimate the distance a boat would travel along the inlet between Bamfield and Port Alberni (not the straight line or “as the crow”flies distance). 50- 59.999km. Read this carefully – previous students made errors by not reading this question carefully. Refer to section 3.1 of the report, and fill blanks with numbers, NOT words. Due to the Alaska earthquake that occurred inthe year 1964 , a total of 260 homes in Port Alberni Port Alberni were damaged. This destruction was caused by atotal of 3 (enter how many) waves that arrived, each several hours apart, during the night of March 27th-28th. The first arrived after traveling up the river at 50 km/hr with a maximum wave height of 3.7 m above mean sea level. The second arrived less than 2 hrs later with a peak wave height of 4.3 m above mean sea level. The third was the largest wave but the tide had fallen so it’s peak wave height ended up being 3.9 From section 3.2 only: • In January of the year m above mean sea level. 1770 a tsunami was determined to have been caused by a great earthquake of moment magnitude close to 9 , that happened January 26 at 9:00 pm, off the Pacific northwest coast of North America. That tsunami caused damage at sites up to a maximum waveheight of 5 m., along 1000 km of coastline in Japan. • By studying sedimentary deposits, the event of 1700 was determined to have been (larger/smaller/similar) in magnitude compared to the 1964 Alaska earthquake. Next, consider just the 4-item list in section 6.1 which defines the level of “risk” for places close to the shore in terms of elevation above mean sea level (msl). {Hint: challenging. This kind of numerical thinking is not "mathematical", but it does involve thinking quantitatively and logically to make decisions about risk. Discuss / argue with colleagues.} If you wanted to ensure your new vacation property faced an annual probability of inundation that is lessthan 0.01 (i.e. 1 in 1000), at what minimum elevation above msl should it be built? 0m (at sea level) 1.5m above msl 2.5m above msl 3m above msl Section 7 of our reference outlines the risk to North Shore coastal regions from storm waves. Your friend who lives on the south-facing coast of West Vancouver says: “there’s no way our house on the waterfront is in danger. We know waves encountered by friends across the bay in Kitsilano never reached more than 2m height even in the huge storm of December 15, 2006”. What’s your best response to this? (Hint: check your maps to compare locations and orientation of the shorelines at West Vancouver and Kitsilano.) Your friend is probably right – both shorelines are on the same bay. Your friend is probably right – the distance that wind can travel over open water for both shorelines is pretty similar for waves coming from any direction. Your friend is probably right – the difference in near-shore depth patterns likely caused waves at Kitsilano to be larger than you would experience in North Vancouver. Your friend is probably wrong – the distance that wind can travel over open water for some wind directions will likely result in waves that are larger on the north shore than the south shore of this bay. Your friend is probably wrong – the shape of the bay will cause all waves along the north side to be larger than the south side. What writing strategies were used in the portions of this report that we have read? (Online, watch carefully to ensure you are answering each question correctly - they may be offered in a different order.) ) Assertions and arguments were supported by scientific observations, measurements or experiments that have already been reported on elsewhere; True / False Assertions and arguments were supported by new, previously unreported scientific observations, measurements or experiments; True / False Narrative or personal stories were incorporated into the article; True / False The author(s) targeted human emotion as part of their writing strategies; True /False Descriptions of "aesthetic" aspects like scenes, views and impressions were included; True / False The author(s) identified at least some uncertainties, incomplete aspects or needs for further work; T /F The main purpose for this reading is to . . . (Hint: consider where or how it was published.) offer social commentary to any reader. provide news for the general public. explain some scientific matters to the general public. provide information for a person or organization who requested it. present and discuss recommendations about scientific priorities in the peer-reviewed literature. communicate new scientific methods, procedures or discoveries to experts in the subject. Step 4: Now consider the expected effects of a tsunami for Southern Vancouver Island. To help the communities of southern Vancouver Island make emergency planning decisions, a report was commissioned to estimate the height to which potential tsunami waves could inundate coastal regions. Open the report here and browse the contents. But do NOT read any of the report yet. https://www.crd.bc.ca/docs/default-source/news-pdf/2013/modelling-ofpotential-tsunami-inundation-limits-and-run-up-report-.pdf?sfvrsn=0. First, this report is structured a little differently from most peer reviewed journal articles. Which sections in this report would be LIKELY to occur in a peer reviewed journal article, even if using somewhat different subtitles? (Do not read any of the report yet!) Letter of Transmittal NOT Background References Modelling results Statement of Qualifications and Limitations NOT Potential next steps Now read the Executive Summary section only. The authors chose one out of how many possible 1-in-500-year earthquakescenarios? 12 The computer-based mathematical model used to analyze tsunami behavior and effects was compared to other models in the year 2009 and considered the best out of 7 competing models. This is the official model used in several places, but which of following does NOT use thismodel? Hawaii American Samoa Alaska US Gulf Coast states A complete and seamless Digital Elevation Model (or DEM) was needed, including above and below sea topography. All of the following challenges had to be overcome except one. Which is the one challenge not mentioned as needing attention before a final DEM could be produced? Different sources of data having varying accuracies and reliabilities; Differences between US and Canadian sources, including overlapping data having inconsistent elevations; Different sources using different datums (i.e. differing definitions of “zero” elevation) Sections of shoreline not having continuous data Differences in the definition of “sea level” for different jurisdictions Based on observations of the tsunami caused by the 2011 Tohoku earthquake, the maximum water flow speed occurring in Japan due to that event was 12 times larger than the maximum water flow speed predicted for Greater Victoria in this study. Emergency planning decisions depend upon several “elevations” or heights, including the following 4factors. A) The maximum high tide elevation B) The maximum tsunami wave height C) Uncertainties regarding earthquake size, initial tidal conditions and topographic data D) The amount ground will sink in an earthquake The so-called Tsunami Hazard Line is a line representing a certain elevation along the coast. Calculation of this line includes (choose one option only): (Hint: be sure to consider all information surrounding Table ES1.) Factor A only Factor B only The sum of factors A and B The sum of factors A, B and C The sum of factors A, B and D The sum of factors B, C and D The sum of all 4 factors Now consider Table ES1 that summarizes tsunami modelling results. The largest high-water level will occur at which location? Port Renfrew entrance • Sooke Harbour entrance Esquimalt Harbour entrance • Victoria Harbour entrance Cadboro Bay • Sidney The fastest flowing water will occur at which location? Esquimalt Harbour entrance (Same options) The longest time before the tsunami first arrives will occur at whichlocation? Sidney(Same options) The longest stretch of time between arrival and maximum water level will occur at whichlocation? Cadboro Bay (Same options) Which three locations will experience variations between high and low water heights of LESS than 3.5metres? Sooke Harbour entrance Cadboro Bay Sidney (Why is this important? Because larger hi/lo spans may cause more damage to infrastructure like docks, bridges etc.) The executive summary ends with suggestions for how the client might use these results. Which one ofthe following was NOT mentioned as a potential next step? Planning how to get people out of the area. Incorporating potential tsunami into a regional plan for responding to emergencies. Evaluating whether built facilities like docs, breakwaters, roads etc. are adequate. Determining whether land use or zoning in the region is appropriate. Setting up contingencies handling transport of goods and people. Now let’s look at just three of the figures generated by the computer modelling done for this report. Do NOT read the whole report – the questions refer to figures only. Figure 5.1: In areas east of the Cape Flattery, where are maximum water levels expected? Refer to our own map at the end of the worksheet to find Cape Flattery. (Note that the term “maximum water level” is used for the map’s colour scale.) Middle (not edges) of the Strait of Juan de Fuca between Cape Flattery and Sooke Harbour Parts of the southern edge of the Strait of Juan de Fuca between Cape Flattery and Sooke Harbour Parts of the northern edge of the Strait of Juan de Fuca between Cape Flattery and Sooke Harbour Central region of the Strait of Juan de Fuca south and east of Victoria andEsquimault Some waterways among islands east of Cadboro Bay and Sidney Bays and inlets of Esquimalt or Victoria Figure 5.3: where will facilities like bridges, breakwaters and so on experience the maximum water flow speeds? These places will need to take extra care with assessing the ability of these facilities to withstand water moving faster than normal. Refer to the second map we have provided at the end of this worksheet to help identify place names. Beaches and shoreline on the north and south coasts of Juan de Fuca Straight Esquimalt harbour entrance Inside Esquimalt harbour Victoria Harbour entrance The main region of Victoria Harbour including “West Bay” The “Inner Harbour” of Victoria harbour The “Upper Harbour” of Victoria harbour The “Selkirk Water” portion of Victoria harbour Assume Port San Juan (entrance near Port Renfrew) and Esquimalt are 90km apart. Based on this distance and Tsunami Arrival Time data in Table ES1 (considered above), what is the average speed in km/hr of the tsunami wave traveling between these two points? This is just arithmetic but you must be careful with units. Distance is in km. Time difference from Table ES1 is in minutes, and we want wave speed inkm/hr. 128.6 How do you expect wave speed to compare to water-flow speed in the center of the Juan de Fuca Strait? The difference is that water-flow speed is the rate at which WATER moves, while tsunami wave speed is the rate at which ENERGY (i.e. the wave crest) moves. Wave speed is much slower than water speed Wave speed is a little slower the water speed Wave speed is similar to water speed Wave speed is a closer to twice the water speed Wave speed is much faster than twice the water speed Figure 6.2 is a satellite photo of Victoria’s harbour with the Tsunami Hazard Line plotted over the image. (NOTE north is to the left and west is down on this photo.) Which of the following regions encompasses the largest area that could experience serious damage, should the event used by this study occur? Again, use our map below to identify named features. Homes along the north edge of “West Bay” Docks on the East side of Victoria Harbour’s entrance. Buildings near the shoreline immediately to the east of the harbor entrance breakwater. The golf course in the north/west (i.e. lower left) corner of this image. Homes and parks along the coast immediately west of Victoria’s harbourentrance. What writing strategies were used in the portions of this second report that we have read? (Online, watch carefully to ensure you are answering each question correctly - they may not be all offered.) Assertions and arguments were supported by scientific observations, measurements or experiments that have already been reported on elsewhere; True / False Assertions and arguments were supported by new, previously unreported scientific observations, measurements or experiments; True / False Narrative or personal stories were incorporated into the article; True / False The author(s) targeted human emotion as part of their writing strategies; True / False Descriptions of "aesthetic" aspects like scenes, views and impressions were included; True / False The author(s) identified at least some uncertainties, incomplete aspects or needs for further work; T / F The main purpose for this second reading is to . . . (Consider where or how it waspublished.) offer social commentary to any reader. provide news for the general public. explain some scientific matters to the general public. provide information for a person or organization who requested it. present and discuss recommendations about scientific priorities in the peer-reviewed literature. communicate new scientific methods, procedures or discoveries to experts in the subject. At this stage, consider revisiting the earlier question about placing different locations in order of vulnerability.Step 5: Consider coast-line protection facilities in use at Victoria, Vancouver or neighboring cities Look at Crescent Beach in White Rock south of Vancouver, using this Google Maps link: https://www.google.ca/maps/@49.0530907,-122.8842827,1670m/data=!3m1!1e3 . You may have to zoom in to examine details, but do not consider coastline outside the region circled on the figure here. (Sediment transport, long shore drift and coastal protection facilities are discussed in class, or starting at http://www.beachapedia.org/Longshore_Sediment_Transport and http://www.beachapedia.org/Shoreline_Structures ) Which one of these types of coastline protection facilities is theonly one visible at Crescent Beach? (Take care – zoom in to see labels to avoid mistaking one of the visible features.) One or more jetties One or more seawalls One or more breakwaters One or more groins (or groynes) Along the portion of Crescent Beach circled in the figure, what is the predominant direction that sand moves due to longshore transport? From east towards the west From west towards the east From south towards the north From north towards the south Along the portion of Crescent Beach circled here, how many groins can you see in use? None 1-2 3-6 7-12 13-20 More than 20. On the Google Map you have open, explore along the coastline southwards, then eastwards to White Rock. Which one of these types of coastline protection facilities is most obvious along White Rock’s south-facing coastline? A jetty A seawall A breakwater A groin (or groyne)Step 6: feedback 1) What is one question that YOU would like to ask to clarify what you learned in this exercise? 2) Name one thing that surprised you the most as you carried out this work. 3) How long did you spend on this entire assignment, from starting tofinal submission? hrs. (Answer using decimals, as in "1.5". Value should be in units of hours – and no words please). 4) This assignment increased your knowledge or understanding of what information is needed to establish wellinformed emergency preparedness plans for communities: • Strongly agree • Agree • Neutral • Disagree • Strongly disagree 5) This assignment increased your appreciation for what communities might expect to experience if a tsunami should arrive from the Pacific Ocean at locations of South Western British Columbia (sameoptions)? 6) This assignment increased your appreciation for the processes contributing to storm, tsunami or other wave and erosional coastline hazards (same options)? 7) Have you any comments about how to improve this exercise (same options)?Map 1: used throughout the exercise, derived from Google Maps, with additional annotations for locations and features referenced during this exercise. Red stars * are specific locations discussed or studied in this homework exercise. Vancouver North Shore * * * * Boundary Bay * * Pacific Ocean Cape Port San Juan * Esquimault Harbour * * * Cadboro Bay Flattery Sooke Harbour * Victoria Harbour 10km Next pgMap2: The Victoria and Esquimalt harbour regions that are within the box shown on the previous map. Adapted from https://www.esquimalt.ca/sites/default/files/greater_victoria_tsunami_map.pdf Strait of Juan de Fuca S = schools; M = municipal halls; Brown shaded regions = Tsunami Planning Zones, 0m - 4m above sea level. Green stippled regions = parks. [Show More]
Last updated: 1 year ago
Preview 1 out of 23 pages
Reviews( 0 )
Document information
Connected school, study & course
About the document
Uploaded On
Feb 27, 2021
Number of pages
23
Written in

Additional information
This document has been written for:
Uploaded
Feb 27, 2021
Downloads
1
Views
327