Financial Accounting > QUESTIONS & ANSWERS > Chapter 15 Financial Statement Analysis: Answer Kay Provided at the end. (All)
Chapter 15 Financial Statement Analysis: Answer Kay Provided at the end.
Document Content and Description Below
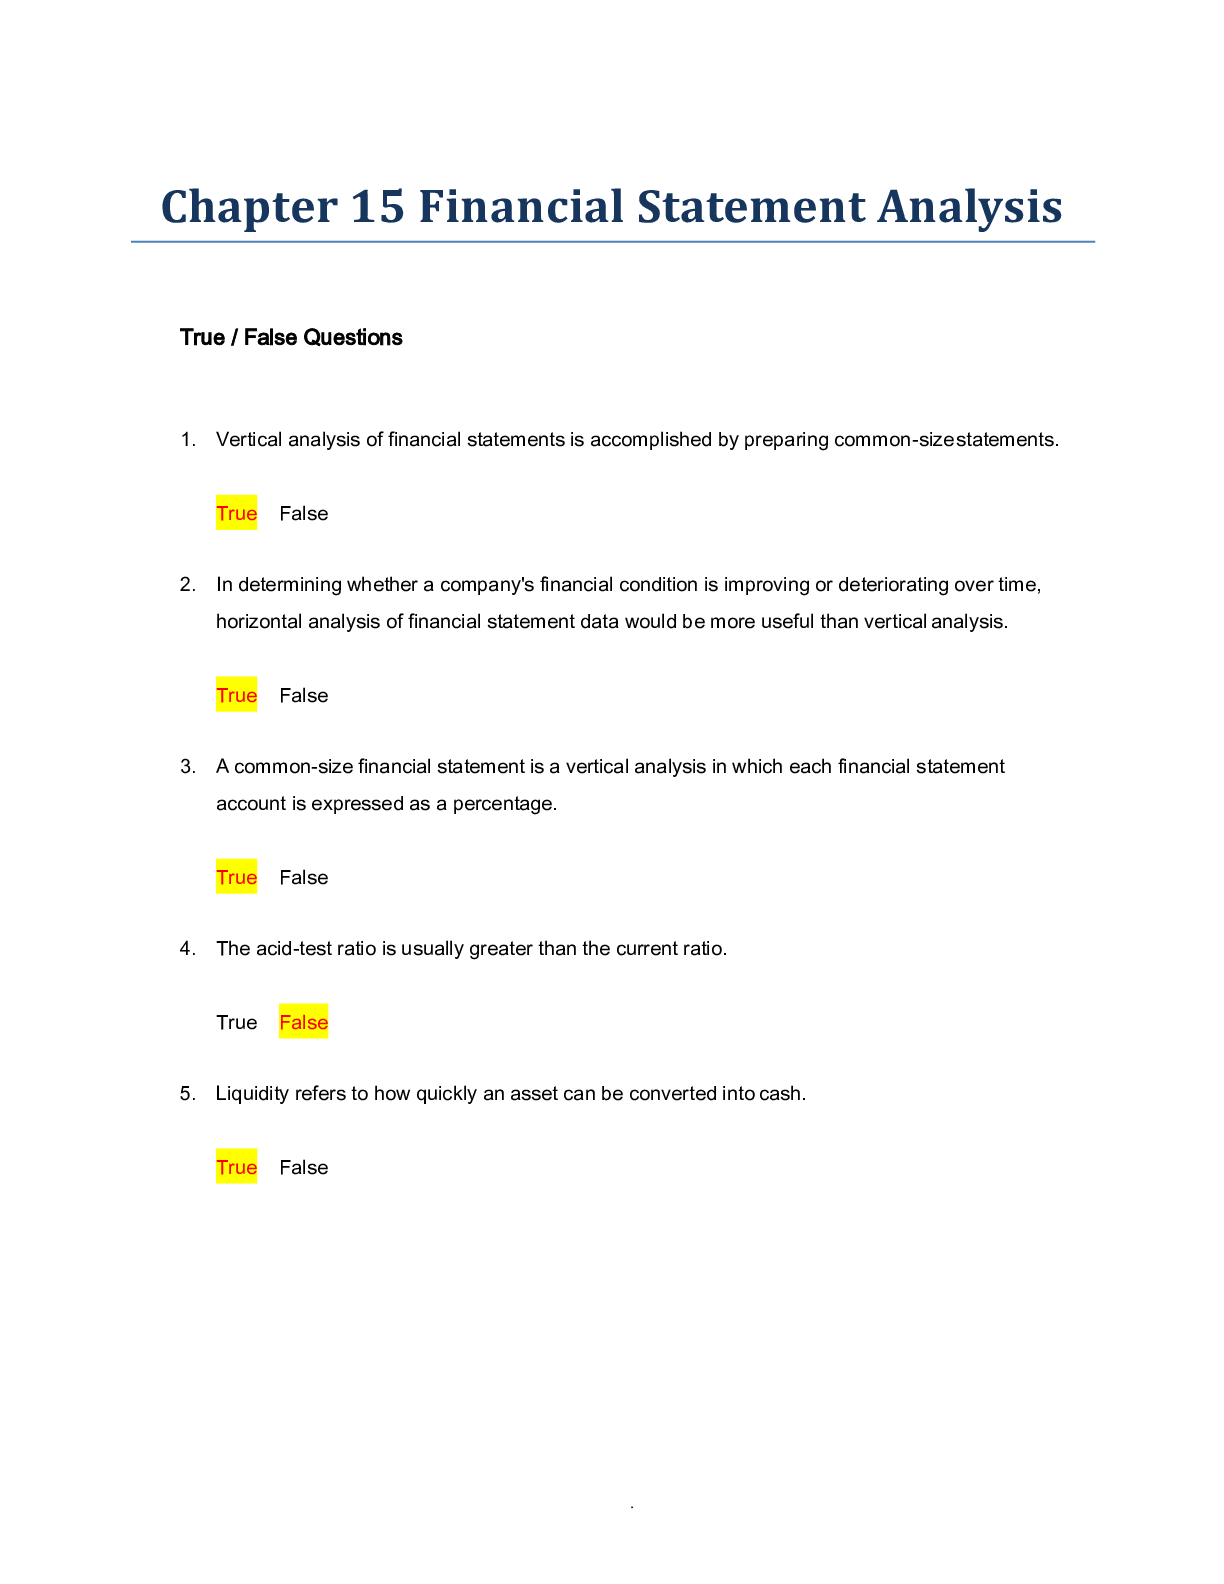
Chapter 15 Financial Statement Analysis True / False Questions 1. Vertical analysis of financial statements is accomplished by preparing common-size statements. True False 2. In determinin... g whether a company's financial condition is improving or deteriorating over time, horizontal analysis of financial statement data would be more useful than vertical analysis. True False 3. A common-size financial statement is a vertical analysis in which each financial statement account is expressed as a percentage. True False 4. The acid-test ratio is usually greater than the current ratio. True False 5. Liquidity refers to how quickly an asset can be converted into cash. True False 6. If the acid-test ratio is less than one, then paying off some current liabilities with cash will increase the acid-test (quick) ratio. True False 7. A company could improve its acid-test ratio by selling some equipment it no longer needs for cash. True False 8. Acquiring land by taking out a long-term mortgage will not affect the current ratio. True False 9. Purchasing marketable securities with cash will have no effect on a company's acid-test ratio. True False 10. As the accounts receivable turnover ratio decreases, the average collection period increases. True False 11. If a company's operating cycle is much longer than its average payment period for suppliers, it creates the need to borrow money to fund its inventories and accounts receivable. True False 12. All other things the same, purchasing inventory would decrease the inventory turnover ratio. True False 13. Buying inventory in large lots to take advantage of quantity discounts can be responsible for a high inventory turnover ratio. True False 14. All other things the same, when a company increases its inventories in anticipation of later higher sales, the accounts receivable turnover ratio for the current period increases. True False 15. All other things the same, purchasing merchandise inventory would have no effect on the accounts receivable turnover ratio at a retailer. True False 16. All other things the same, when a customer purchases an item for cash, the accounts receivable turnover ratio increases. True False 17. As the inventory turnover increases, the average sales period decreases. True False 18. To increase total asset turnover, management must either increase sales or reduce total stockholders' equity. True False 19. The formula for the average sale period is: Average sale period = Accounts receivable turnover ÷ Inventory turnover. True False 20. The formula for total asset turnover is: Total asset turnover = Total assets ÷ Total stockholders' equity. True False 21. A company whose inventory turnover ratio is much slower than the average for its industry may have too much inventory or the wrong sorts of inventory. True False 22. All other things the same, those who hold the company's debt (i.e., its creditors) would like a low debt-to-equity ratio to provide a buffer of protection. True False 23. All other things the same, if long-term debt is exchanged for short-term debt, the debt-to-equity ratio will be unchanged. True False 24. The times interest earned ratio is based on net income because that is the amount of earnings that is available for making interest payments. Interest expense is deducted before taxes are determined; creditors have first claim on the earnings before taxes are paid. True False 25. Issuing common stock will decrease a company's financial leverage. True False 26. The formula for the times interest earned ratio is: Times interest earned = Earnings before interest expense and income taxes ÷ Interest expense. True False 27. If a company's return on assets is substantially lower than its cost of borrowing, then the common stockholders would normally want the company to have a relatively high debt/equity ratio. True False 28. The formula for the return on equity is: Return on equity = Net income ÷ Average total stockholders' equity. True False 29. When computing the return on equity, retained earnings should be excluded from the average total stockholders' equity. True False 30. When computing the return on total assets, the interest expense is added back to net income to show what earnings would have been if the company had no debt. True False 31. When a company sells used equipment for a loss, the net profit margin percentage is unaffected. True False 32. All other things the same, if a company uses long-term debt to purchase land to develop in the future, the company's return on total assets will decrease. True False 33. If a retailer sells a product whose contribution margin equals the gross margin percentage, the gross margin percentage will be unaffected by the transaction. True False 34. The gross margin percentage is computed by dividing the gross margin by net income before interest and taxes. True False 35. The formula for the net profit margin percentage is: Net profit margin percentage = Net income ÷ Sales. True False 36. When fixed costs are included in the cost of goods sold, the gross margin percentage should increase and decrease with sales volume. True False 37. The gross margin percentage is computed by dividing sales by the gross margin. True False 38. A high price-earnings ratio means that investors are willing to pay a premium for the company's stock. True False 39. An increase in the number of shares of common stock outstanding will increase a company's price-earnings ratio if the market price per share remains unchanged. True False 40. The dividend payout ratio is equal to the dividend per share divided by the earnings per share. True False 41. All other things the same, if the company purchases equipment on credit, this transaction would have no impact on the company's book value per share. True False 42. Purchasing inventory on credit increases the book value per share of a retailer. True False 43. The price-earnings ratio is determined by dividing market price per share of stock by the earnings per share. True False 44. Earnings per share is computed by multiplying net income by the average number of common shares outstanding. True False Multiple Choice Questions 45. Selling used equipment at book value for cash will: A. increase working capital. B. decrease working capital. C. decrease the debt-to-equity ratio. D. increase net income. 46. If current assets exceed current liabilities, prepaying an expense on the last day of the year will: A. decrease the current ratio. B. increase the acid-test ratio. C. decrease the acid-test ratio. D. increase the current ratio. 47. Zack Company has a current ratio of 2.5. What will be the effect of a purchase of inventory with cash on the acid-test ratio and on working capital? A. Option A B. Option B C. Option C D. Option D 48. Norton Inc. could improve its current ratio of 2 by: A. paying a previously declared stock dividend. B. writing off an uncollectible receivable. C. selling merchandise on credit at a profit. D. purchasing inventory on credit. 49. The ratio of total cash, marketable securities, accounts receivable, and short-term notes to current liabilities is: A. the debt-to-equity ratio. B. the current ratio. C. the acid-test ratio. D. working capital. 50. A company's current ratio is greater than 1. Purchasing raw materials on credit would: A. increase the current ratio. B. decrease the current ratio. C. increase net working capital. D. decrease net working capital. 51. Sand Company has an acid-test ratio of 0.8. Which of the following actions would improve the acid-test ratio? A. Collect some accounts receivable. B. Acquire some inventory on account. C. Sell some equipment for cash. D. Use cash to pay off some accounts payable. 52. A company's current ratio and an acid-test ratio are both greater than 1. Payment of an account payable would: A. increase the current ratio but the acid-test ratio would not be affected. B. increase the acid-test ratio but the current ratio would not be affected. C. increase both the current and acid-test ratios. D. decrease both the current and acid-test ratios. 53. Turner Co. presently has a current ratio of 0.8. The company has been informed by its bank that it must improve its current ratio to qualify for a line of credit. Which of the following actions would improve the current ratio? A. Use cash to pay off some current liabilities. B. Purchase additional marketable securities with cash. C. Acquire a parcel of land in exchange for common stock. D. Purchase additional inventory on credit. 54. Accounts receivable turnover will normally decrease as a result of: A. the write-off of an uncollectible account against the allowance for bad debts. B. a significant sales volume decrease near the end of the accounting period. C. an increase in cash sales in proportion to credit sales. D. a change in credit policy to lengthen the period for cash discounts. 55. The gross margin percentage is equal to: A. (Net operating income + Selling and administrative expenses)/Sales B. Net operating income/Sales C. Cost of goods sold/Sales D. Cost of goods sold/Net income 56. Which of the following is not a source of financial leverage? A. Bonds payable. B. Accounts payable. C. Taxes payable. D. Prepaid rent. 57. Which one of the following statements about book value per share is most correct? A. Market price per common share usually approximates book value per common share. B. Book value per common share is based on past transactions whereas the market price of a share of stock mainly reflects what investors expect to happen in the future. C. A market price per common share that is greater than book value per common share is an indication of an overvalued stock. D. Book value per common share is the amount that would be paid to stockholders if the company were sold to another company. 58. The market price of Friden Company's common stock increased from $15 to $18. Earnings per share of common stock remained unchanged. The company's price-earnings ratio would: A. increase. B. decrease. C. remain unchanged. D. impossible to determine. 59. The Seabury Corporation has a current ratio of 3.5 and an acid-test ratio of 2.8. The corporation's current assets consist of cash, marketable securities, accounts receivable, and inventories. Inventory equals $49,000. Seabury Corporation's current liabilities must be: A. $70,000 B. $100,000 C. $49,000 D. $125,000 60. Data from Fontecchio Corporation's most recent balance sheet appear below: The corporation's acid-test ratio is closest to: A. 0.35 B. 0.15 C. 0.68 D. 0.79 61. Feiler Corporation has total current assets of $483,000, total current liabilities of $347,000, total stockholders' equity of $1,057,000, total net plant and equipment of $1,031,000, total assets of $1,514,000, and total liabilities of $457,000. The company's current ratio is closest to: A. 0.32 B. 0.30 C. 1.39 D. 0.95 62. Gnas Corporation's total current assets are $210,000, its noncurrent assets are $590,000, its total current liabilities are $160,000, its long-term liabilities are $490,000, and its stockholders' equity is $150,000. The current ratio is closest to: A. 1.31 B. 0.76 C. 0.33 D. 0.36 63. Dratif Corporation's working capital is $33,000 and its current liabilities are $80,000. The corporation's current ratio is closest to: A. 1.41 B. 0.59 C. 3.42 D. 0.41 64. Dennisport Corporation has an acid-test ratio of 2.5. It has current liabilities of $40,000 and noncurrent assets of $70,000. The corporation's current assets consist of cash, marketable securities, accounts receivable, prepaid expenses, and inventory; it has no short-term notes receivable. If Dennisport's current ratio is 3.1, its inventory and prepaid expenses must be: A. $12,400 B. $24,000 C. $30,000 D. $40,000 65. Calin Corporation has total current assets of $615,000, total current liabilities of $230,000, total stockholders' equity of $1,183,000, total net plant and equipment of $958,000, total assets of $1,573,000, and total liabilities of $390,000. The company's working capital is: A. $615,000 B. $1,183,000 C. $385,000 D. $958,000 66. Mcrae Corporation's total current assets are $380,000, its noncurrent assets are $500,000, its total current liabilities are $340,000, its long-term liabilities are $250,000, and its stockholders' equity is $290,000. Working capital is: A. $380,000 B. $40,000 C. $250,000 D. $290,000 67. Erastic Corporation has $14,000 in cash, $8,000 in marketable securities, $34,000 in account receivable, $40,000 in inventories, and $42,000 in current liabilities. The corporation's current assets consist of cash, marketable securities, accounts receivable, and inventory. The corporation's acid-test ratio is closest to: A. 1.33 B. 0.81 C. 2.29 D. 1.14 68. Windham Corporation has current assets of $400,000 and current liabilities of $500,000. Windham Corporation's current ratio would be increased by: A. the purchase of $100,000 of inventory on account. B. the payment of $100,000 of accounts payable. C. the collection of $100,000 of accounts receivable. D. refinancing a $100,000 long-term loan with short-term debt. 69. Stimac Corporation has total cash of $210,000, no marketable securities, total current receivables of $281,000, total inventory of $151,000, total prepaid expenses of $53,000, total current assets of $695,000, total current liabilities of $261,000, total stockholders' equity of $1,014,000, total assets of $1,415,000, and total liabilities of $401,000. The company's acid-test (quick) ratio is closest to: A. 2.08 B. 1.73 C. 2.66 D. 1.88 70. Orem Corporation's current liabilities are $75,000, its long-term liabilities are $225,000, and its working capital is $100,000. If the corporation's debt-to-equity ratio is 0.30, total long-term assets must equal: A. $1,000,000 B. $1,300,000 C. $1,125,000 D. $1,225,000 71. Irawaddy Company, a retailer, had cost of goods sold of $230,000 last year. The beginning inventory balance was $24,000 and the ending inventory balance was $22,000. The company's average sale period was closest to: A. 36.5 days B. 73.0 days C. 38.1 days D. 34.9 days 72. Harris Corporation, a retailer, had cost of goods sold of $290,000 last year. The beginning inventory balance was $26,000 and the ending inventory balance was $24,000. The corporation's inventory turnover was closest to: A. 12.08 B. 11.60 C. 5.80 D. 11.15 73. Natcher Corporation's accounts receivable at the end of Year 2 was $126,000 and its accounts receivable at the end of Year 1 was $130,000. The company's inventory at the end of Year 2 was $127,000 and its inventory at the end of Year 1 was $120,000. Sales, all on account, amounted to $1,380,000 in Year 2. Cost of goods sold amounted to $800,000 in Year 2. The company's operating cycle for Year 2 is closest to: A. 44.7 days B. 17.3 days C. 62.8 days D. 90.2 days 74. Kopas Corporation has provided the following data: The inventory turnover for this year is closest to: A. 3.09 B. 0.98 C. 1.03 D. 3.05 75. Granger Corporation had $180,000 in sales on account last year. The beginning accounts receivable balance was $10,000 and the ending accounts receivable balance was $18,000. The corporation's average collection period was closest to: A. 20.3 days B. 28.4 days C. 36.5 days D. 56.8 days 76. During the year just ended, the retailer James Corporation purchased $425,000 of inventory. The inventory balance at the beginning of the year was $175,000. If the cost of goods sold for the year was $450,000, then the inventory turnover for the year was: A. 2.77 B. 2.57 C. 3.00 D. 2.62 77. Laverde Corporation has provided the following data: The company's total asset turnover for Year 2 is closest to: A. 1.22 B. 7.60 C. 0.13 D. 0.82 78. Spomer Corporation's inventory at the end of Year 2 was $114,000 and its inventory at the end of Year 1 was $120,000. Cost of goods sold amounted to $710,000 in Year 2. The company's inventory turnover for Year 2 is closest to: A. 5.92 B. 1.05 C. 6.07 D. 6.23 79. Frantic Corporation had $130,000 in sales on account last year. The beginning accounts receivable balance was $10,000 and the ending accounts receivable balance was $16,000. The corporation's accounts receivable turnover was closest to: A. 5.00 B. 13.00 C. 10.00 D. 8.13 80. Data from Keniston Corporation's most recent balance sheet and income statement appear below: The average collection period for this year is closest to: A. 39.1 days B. 45.1 days C. 54.3 days D. 57.5 days 81. Louie Corporation has provided the following data: The company's operating cycle for Year 2 is closest to: A. 81.0 days B. 150.5 days C. 79.2 days D. 9.7 days 82. Last year Truro Corporation purchased $800,000 of inventory. The cost of goods sold was $750,000 and the ending inventory was $125,000. The inventory turnover for the year was: A. 6.0 B. 7.5 C. 6.4 D. 8.0 83. The accounts receivable for Note Corporation was $240,000 at the beginning of the year and $260,000 at the end of the year. If the accounts receivable turnover for the year was 8 and 20% of the total sales were cash sales, the total sales for the year were: A. $2,600,000 B. $2,000,000 C. $2,400,000 D. $2,500,000 84. Smay Corporation has provided the following data: The accounts receivable turnover for this year is closest to: A. 1.01 B. 0.99 C. 6.08 D. 6.11 85. Rawe Corporation's accounts receivable at the end of Year 2 was $329,000 and its accounts receivable at the end of Year 1 was $280,000. Sales, all on account, amounted to $1,350,000 in Year 2. The company's average collection period (age of receivables) for Year 2 is closest to: A. 1.2 days B. 1.0 days C. 82.4 days D. 89.0 days 86. Pascarelli Corporation's inventory at the end of Year 2 was $122,000 and its inventory at the end of Year 1 was $150,000. Cost of goods sold amounted to $870,000 in Year 2. The company's average sale period (turnover in days) for Year 2 is closest to: A. 230.1 days B. 51.2 days C. 57.0 days D. 32.3 days 87. Deflorio Corporation's inventory at the end of Year 2 was $156,000 and its inventory at the end of Year 1 was $140,000. The company's total assets at the end of Year 2 were $1,416,000 and its total assets at the end of Year 1 were $1,390,000. Sales amounted to $1,320,000 in Year 2. The company's total asset turnover for Year 2 is closest to: A. 0.94 B. 1.06 C. 5.38 D. 0.19 88. Data from Estrin Corporation's most recent balance sheet and income statement appear below: The average sale period for this year is closest to: A. 101 days B. 50 days C. 108 days D. 45 days 89. Shipley Corporation has provided the following data from its most recent balance sheet: The debt-to-equity ratio is closest to: A. 0.29 B. 3.47 C. 0.22 D. 0.78 90. Neelty Corporation has interest expense of $16,000, sales of $600,000, a tax rate of 30%, and after-tax net income of $56,000. The company's times interest earned ratio is closest to: A. 6.0 B. 5.0 C. 4.5 D. 3.5 91. Falmouth Corporation's debt to equity ratio is 0.6. Current liabilities are $120,000, long term liabilities are $360,000, and working capital is $140,000. Total assets of the corporation must be: A. $600,000 B. $1,200,000 C. $800,000 D. $1,280,000 92. Klein Corporation has provided the following data: The company's equity multiplier is closest to: A. 1.24 B. 0.56 C. 1.80 D. 0.81 93. Last year Javer Corporation had a net income of $200,000, income tax expense of $74,000, and interest expense of $20,000. The corporation's times interest earned was closest to: A. 10.0 B. 11.0 C. 5.3 D. 14.7 94. The times interest earned ratio of Whitney Corporation is 3.0. The interest expense for the year is $21,000, and the corporation's tax rate is 40%. The corporation's after-tax net income must be: A. $63,000 B. $25,200 C. $30,000 D. $42,000 95. A portion of Lapore Corporation's Balance Sheet appears below: The company's debt-to-equity ratio at the end of Year 2 is closest to: A. 0.60 B. 0.37 C. 0.39 D. 0.27 96. Wittels Corporation has provided the following data: In Year 2, the company's net operating income was $42,571, its net income before taxes was $21,571, and its net income was $15,100. The company's equity multiplier is closest to: A. 1.14 B. 0.53 C. 0.88 D. 1.87 97. Broch Corporation's income statement appears below: The company's times interest earned is closest to: A. 4.87 B. 1.41 C. 3.16 D. 2.16 98. Cutsinger Corporation has provided the following data from its most recent income statement: The times interest earned ratio is closest to: A. 1.83 B. 0.28 C. 1.28 D. 0.19 99. Karma Corporation has total assets of $190,000 and total liabilities of $90,000. The corporation's debt-to-equity ratio is closest to: A. 0.47 B. 0.90 C. 0.53 D. 0.32 100. Rough Corporation's total assets at the end of Year 2 were $1,247,000 and at the end of Year 1 were $1,270,000. The company's total liabilities at the end of Year 2 were $512,000 and at the end of Year 1 were $550,000. The company's total stockholders' equity at the end of Year 2 was $735,000 and at the end of Year 1 was $720,000. The company's equity multiplier is closest to: A. 1.73 B. 1.44 C. 0.69 D. 0.58 101. Younis Corporation's income statement appears below: The company's net profit margin percentage is closest to: A. 37.1% B. 3.5% C. 2.4% D. 1.7% 102. Crosswhite Corporation's sales last year were $1,270,000, its gross margin was $400,000, its net operating income was $53,769, and its net income was $26,500. The company's net profit margin percentage is closest to: A. 31.5% B. 3.2% C. 4.2% D. 2.1% 103. Mars Corporation has provided the following data for Year 2: The company's total stockholders' equity at the end of Year 2 amounted to $1,095,000 and at the end of Year 1 to $1,060,000. The company's return on equity for Year 2 is closest to: A. 5.91% B. 7.40% C. 3.84% D. 71.20% 104. Sapien Corporation has provided the following data for the most recent year: The company's gross margin percentage is closest to: A. 52.3% B. 1691.2% C. 5.9% D. 34.3% 105. Mormino Corporation's income statement appears below: The company's gross margin percentage is closest to: A. 1888.9% B. 5.3% C. 41.1% D. 69.9% 106. Jester Corporation's most recent income statement appears below: The beginning balance of total assets was $360,000 and the ending balance was $320,000. The return on total assets is closest to: A. 26.5% B. 18.5% C. 22.6% D. 32.4% 107. For Year 2, Etzkorn Corporation's sales were $1,480,000, its gross margin was $580,000, its net operating income was $63,714, its net income before taxes was $42,714, and its net income was $29,900. The company's total stockholders' equity at the end of Year 2 amounted to $829,000 and at the end of Year 1 to $800,000. The company's return on equity for Year 2 is closest to: A. 3.67% B. 60.16% C. 5.24% D. 7.82% 108. Kienle Corporation's Year 2 income statement appears below: The company's total assets at the end of Year 2 amounted to $1,359,000 and at the end of Year 1 to $1,320,000. The company's return on total assets for Year 2 is closest to: A. 2.48% B. 3.14% C. 2.52% D. 3.10% 109. Valdovinos Corporation has provided the following data: The company's net profit margin percentage is closest to: A. 38.3% B. 3.5% C. 1.3% D. 2.0% 110. Braverman Corporation's net income last year was $75,000 and its interest expense was $10,000. Total assets at the beginning of the year were $650,000 and total assets at the end of the year were $610,000. The corporation's income tax rate was 30%. The corporation's return on total assets for the year was closest to: A. 13.5% B. 12.4% C. 13.0% D. 11.9% 111. Grosvenor Corporation's most recent income statement appears below: The gross margin percentage is closest to: A. 80.9% B. 44.7% C. 376.0% D. 26.6% 112. Fongeallaz Corporation's income statement for Year 2 appears below: The company's total stockholders' equity at the end of Year 2 amounted to $841,000 and at the end of Year 1 to $810,000. The company's return on equity for Year 2 is closest to: A. 64.40% B. 8.93% C. 6.75% D. 4.72% 113. Weightman Corporation's net operating income in Year 2 was $76,385, net income before taxes was $55,385, and the net income was $36,000. Total common stock was $200,000 at the end of both Year 2 and Year 1. The par value of common stock is $4 per share. The company's total stockholders' equity at the end of Year 2 amounted to $983,000 and at the end of Year 1 to $950,000. The market price per share at the end of Year 2 was $7.92. The company's price- earnings ratio for Year 2 is closest to: A. 7.14 B. 0.58 C. 5.18 D. 11.00 114. The following information relates to Conejo Corporation for last year: What is Conejo's price-earnings ratio for last year? A. 1.6 B. 2.4 C. 8.0 D. 2.0 115. Goldsmith Corporation has provided the following data: The company's net income in Year 2 was $24,400. The company's book value per share at the end of Year 2 is closest to: A. $8.32 per share B. $4.66 per share C. $14.34 per share D. $0.27 per share 116. Linzey Corporation has provided the following data: The company's net income in Year 2 was $33,000. The company's book value per share at the end of Year 2 is closest to: A. $22.45 per share B. $12.45 per share C. $0.55 per share D. $15.45 per share 117. Tempel Corporation has provided the following data: The market price of common stock at the end of Year 2 was $2.77 per share. The company's price-earnings ratio for Year 2 is closest to: A. 9.23 B. 0.35 C. 4.54 D. 13.40 118. Keyton Corporation's net operating income in Year 2 was $43,714, net income before taxes was $30,714, and the net income was $21,500. Total common stock was $200,000 at the end of both Year 2 and Year 1. The par value of common stock is $4 per share. The company's total stockholders' equity at the end of Year 2 amounted to $1,148,000 and at the end of Year 1 to $1,130,000. The company declared and paid $3,500 dividends on common stock in Year 2. The market price per share was $8.43 at the end of Year 2. The company's dividend payout ratio for Year 2 is closest to: A. 0.8% B. 1.8% C. 16.3% D. 11.4% 119. Rawdon Corporation's net operating income in Year 2 was $52,429, net income before taxes was $34,429, and the net income was $24,100. Total common stock was $360,000 at the end of both Year 2 and Year 1. The par value of common stock is $4 per share. The company's total stockholders' equity at the end of Year 2 amounted to $976,000 and at the end of Year 1 to $960,000. The company's earnings per share for Year 2 is closest to: A. $0.58 per share B. $0.38 per share C. $0.27 per share D. $5.84 per share 120. Leflore Corporation has provided the following data: Dividends on common stock during Year 2 totaled $6,000. The market price of common stock at the end of Year 2 was $1.38 per share. The company's dividend yield ratio for Year 2 is closest to: A. 4.3% B. 1.2% C. 35.0% D. 50.0% 121. Cameron Corporation had 50,000 shares of common stock issued and outstanding that it originally issued for $40 per share. The following information pertains to these shares: The total dividend on common stock for the year was $400,000. Cameron Corporation's dividend yield ratio for the year was: A. 20.00% B. 11.43% C. 9.41% D. 8.89% 122. Hernande Corporation has provided the following data: The company's earnings per share for Year 2 is closest to: A. $4.25 per share B. $0.43 per share C. $0.61 per share D. $0.75 per share 123. Delfavero Corporation has provided the following data: The company's earnings per share for Year 2 is closest to: A. $10.33 per share B. $0.52 per share C. $0.34 per share D. $0.79 per share 124. Groeneweg Corporation has provided the following data: Dividends on common stock during Year 2 totaled $4,500. The market price of common stock at the end of Year 2 was $9.45 per share. The company's dividend payout ratio for Year 2 is closest to: A. 8.7% B. 13.4% C. 4.5% D. 1.0% 125. Spincic Corporation has provided the following data: The market price of common stock at the end of Year 2 was $4.13 per share. The company's price-earnings ratio for Year 2 is closest to: A. 0.52 B. 8.10 C. 6.16 D. 12.52 126. Kovack Corporation's net operating income in Year 2 was $66,571, net income before taxes was $46,571, and the net income was $32,600. Total common stock was $120,000 at the end of both Year 2 and Year 1. The par value of common stock is $2 per share. The company's total stockholders' equity at the end of Year 2 amounted to $962,000 and at the end of Year 1 to $930,000. The company declared and paid $600 dividends on common stock. The market price per share was $4.37. The company's dividend yield ratio for Year 2 is closest to: A. 0.2% B. 1.3% C. 1.9% D. 0.5% 127. Uhri Corporation has provided the following data: Dividends on common stock during Year 2 totaled $4,000. The market price of common stock at the end of Year 2 was $6.08 per share. The company's dividend payout ratio for Year 2 is closest to: A. 7.8% B. 1.3% C. 11.1% D. 0.8% 128. Sabino Corporation's total common stock was $500,000 at the end of both Year 2 and Year 1. The par value of common stock is $5 per share. The company's total stockholders' equity at the end of Year 2 amounted to $1,125,000 and at the end of Year 1 to $1,090,000. The company's total liabilities and stockholders' equity at the end of Year 2 amounted to $1,581,000 and at the end of Year 1 to $1,540,000. The company's retained earnings at the end of Year 2 amounted to $545,000 and at the end of Year 1 to $510,000. The company's net income in Year 2 was $39,000. The company's book value per share at the end of Year 2 is closest to: A. $0.39 per share B. $15.81 per share C. $11.25 per share D. $5.45 per share Nickolls Corporation has provided the following financial data: 129. The company's working capital is: A. $1,215,000 B. $542,000 C. $793,000 D. $709,000 130. The company's current ratio is closest to: A. 0.47 B. 0.40 C. 0.19 D. 4.25 131. The company's acid-test (quick) ratio is closest to: A. 2.47 B. 2.83 C. 3.10 D. 4.25 Macmillan Corporation has provided the following financial data: Dividends on common stock during Year 2 totaled $7,200. The market price of common stock at the end of Year 2 was $3.69 per share. 132. The company's working capital at the end of Year 2 is: A. $732,000 B. $831,000 C. $289,000 D. $590,000 133. The company's current ratio at the end of Year 2 is closest to: A. 0.83 B. 1.96 C. 0.45 D. 0.37 134. The company's acid-test (quick) ratio at the end of Year 2 is closest to: A. 1.96 B. 1.41 C. 1.20 D. 1.48 Mayfield Corporation has provided the following financial data: 135. The company's working capital is: A. $671,000 B. $665,000 C. $418,000 D. $983,000 136. The company's current ratio is closest to: A. 0.26 B. 2.65 C. 0.50 D. 0.53 137. The company's acid-test (quick) ratio is closest to: A. 1.90 B. 1.85 C. 2.65 D. 1.81 Excerpts from Colter Corporation's most recent balance sheet appear below: Sales on account in Year 2 amounted to $1,210 and the cost of goods sold was $720. 138. The working capital at the end of Year 2 is: A. $850 B. $770 C. $400 D. $80 139. The current ratio at the end of Year 2 is closest to: A. 0.32 B. 0.38 C. 1.25 D. 1.20 140. The acid-test ratio at the end of Year 2 is closest to: A. 0.72 B. 0.83 C. 0.59 D. 1.25 141. The accounts receivable turnover for Year 2 is closest to: A. 1.10 B. 0.91 C. 11.52 D. 12.10 142. The inventory turnover for Year 2 is closest to: A. 1.06 B. 0.94 C. 4.36 D. 4.24 Freiman Corporation's most recent balance sheet and income statement appear below: 143. The working capital at the end of Year 2 is: A. $260 thousand B. $680 thousand C. $700 thousand D. $540 thousand 144. The current ratio at the end of Year 2 is closest to: A. 0.45 B. 1.93 C. 0.44 D. 1.04 145. The acid-test ratio at the end of Year 2 is closest to: A. 0.96 B. 1.36 C. 1.50 D. 1.93 146. The accounts receivable turnover for Year 2 is closest to: A. 5.95 B. 5.70 C. 1.09 D. 0.92 147. The average collection period for Year 2 is closest to: A. 64.0 days B. 0.9 days C. 61.3 days D. 1.1 days 148. The inventory turnover for Year 2 is closest to: A. 0.92 B. 6.50 C. 1.08 D. 6.24 149. The average sale period for Year 2 is closest to: A. 58.5 days B. 33.4 days C. 217.3 days D. 56.2 days Data from Dunshee Corporation's most recent balance sheet appear below: Sales on account in Year 2 amounted to $1,170 and the cost of goods sold was $730. 150. The working capital at the end of Year 2 is: A. $270 B. $500 C. $770 D. $740 151. The current ratio at the end of Year 2 is closest to: A. 0.38 B. 2.17 C. 0.94 D. 0.40 152. The acid-test ratio at the end of Year 2 is closest to: A. 2.17 B. 1.78 C. 1.74 D. 1.06 153. The average collection period for Year 2 is closest to: A. 1.1 days B. 0.9 days C. 84.3 days D. 87.3 days 154. The average sale period for Year 2 is closest to: A. 28.1 days B. 45.0 days C. 50.0 days D. 227.7 days Financial statements for Maraby Corporation appear below: 155. Maraby Corporation's working capital (in thousands of dollars) at the end of Year 2 was closest to: A. $260 B. $620 C. $360 D. $990 156. Maraby Corporation's current ratio at the end of Year 2 was closest to: A. 1.34 B. 1.72 C. 0.60 D. 0.44 157. Maraby Corporation's acid-test ratio at the end of Year 2 was closest to: A. 0.51 B. 0.47 C. 1.14 D. 1.95 158. Maraby Corporation's accounts receivable turnover for Year 2 was closest to: A. 13.5 B. 7.8 C. 11.2 D. 9.4 159. Maraby Corporation's average collection period for Year 2 was closest to: A. 38.6 days B. 46.6 days C. 32.6 days D. 27.0 days 160. Maraby Corporation's inventory turnover for Year 2 was closest to: A. 11.2 B. 7.8 C. 9.4 D. 13.5 161. Maraby Corporation's average sale period for Year 2 was closest to: A. 38.8 days B. 32.6 days C. 46.6 days D. 27.0 days Excerpts from Sydner Corporation's most recent balance sheet appear below: Sales on account in Year 2 amounted to $1,390 and the cost of goods sold was $900. 162. The working capital at the end of Year 2 is: A. $600 B. $1,000 C. $880 D. $240 163. The current ratio at the end of Year 2 is closest to: A. 1.67 B. 0.32 C. 0.80 D. 0.41 164. The acid-test ratio at the end of Year 2 is closest to: A. 1.67 B. 1.00 C. 0.97 D. 1.25 165. The accounts receivable turnover for Year 2 is closest to: A. 6.62 B. 1.10 C. 6.32 D. 0.91 166. The average collection period for Year 2 is closest to: A. 55.1 days B. 0.9 days C. 1.1 days D. 57.8 days 167. The inventory turnover for Year 2 is closest to: A. 3.75 B. 1.20 C. 4.09 D. 0.83 168. The average sale period for Year 2 is closest to: A. 63.0 days B. 89.2 days C. 236.3 days D. 97.3 days Ribaudo Corporation has provided the following financial data from its balance sheet and income statement: 169. The company's accounts receivable turnover for Year 2 is closest to: A. 1.06 B. 5.06 C. 5.21 D. 0.94 170. The company's average collection period (age of receivables) for Year 2 is closest to: A. 70.1 days B. 1.1 days C. 72.1 days D. 1.0 days 171. The company's inventory turnover for Year 2 is closest to: A. 3.89 B. 1.04 C. 3.97 D. 4.05 172. The company's average sale period (turnover in days) for Year 2 is closest to: A. 91.9 days B. 48.9 days C. 90.1 days D. 198.1 days 173. The company's operating cycle for Year 2 is closest to: A. 95.9 days B. 75.3 days C. 162.0 days D. 9.2 days 174. The company's total asset turnover for Year 2 is closest to: A. 5.29 B. 0.19 C. 1.04 D. 0.96 Dahn Corporation has provided the following financial data: Dividends on common stock during Year 2 totaled $1,600. The market price of common stock at the end of Year 2 was $2.37 per share. 175. The company's accounts receivable turnover for Year 2 is closest to: A. 0.97 B. 10.38 C. 1.03 D. 10.22 176. The company's average collection period (age of receivables) for Year 2 is closest to: A. 35.7 days B. 1.1 days C. 1.0 days D. 35.2 days 177. The company's inventory turnover for Year 2 is closest to: A. 6.54 B. 5.67 C. 6.07 D. 0.87 178. The company's average sale period (turnover in days) for Year 2 is closest to: A. 226.5 days B. 60.1 days C. 40.0 days D. 64.4 days 179. The company's operating cycle for Year 2 is closest to: A. 66.2 days B. 16.5 days C. 95.3 days D. 45.6 days 180. The company's total asset turnover for Year 2 is closest to: A. 10.17 B. 0.10 C. 1.02 D. 0.98 Guttery Corporation has provided the following financial data from its balance sheet: Sales on account in Year 2 totaled $1,450,000 and cost of goods sold totaled $900,000. 181. The company's accounts receivable turnover for Year 2 is closest to: A. 12.95 B. 1.02 C. 0.98 D. 13.06 182. The company's average collection period (age of receivables) for Year 2 is closest to: A. 1.1 days B. 28.2 days C. 1.0 days D. 27.9 days 183. The company's inventory turnover for Year 2 is closest to: A. 5.17 B. 5.56 C. 6.00 D. 0.86 184. The company's average sale period (turnover in days) for Year 2 is closest to: A. 65.6 days B. 226.6 days C. 43.8 days D. 70.6 days 185. The company's operating cycle for Year 2 is closest to: A. 71.2 days B. 93.5 days C. 18.6 days D. 41.0 days 186. The company's total asset turnover for Year 2 is closest to: A. 1.17 B. 11.04 C. 0.09 D. 0.85 Mahoe Corporation has provided the following financial data: Dividends on common stock during Year 2 totaled $500. The market price of common stock at the end of Year 2 was $8.06 per share. 187. The company's operating cycle for Year 2 is closest to: A. 70.8 days B. 10.0 days C. 87.7 days D. 148.5 days 188. The company's total asset turnover for Year 2 is closest to: A. 1.25 B. 0.80 C. 6.57 D. 0.15 189. The company's equity multiplier at the end of Year 2 is closest to: A. 0.28 B. 1.28 C. 3.53 D. 0.78 Burdick Corporation has provided the following financial data from its balance sheet: Sales (all on account) in Year 2 amounted to $1,410,000 and the cost of goods sold was $860,000. 190. The company's operating cycle for Year 2 is closest to: A. 10.4 days B. 79.5 days C. 141.3 days D. 72.2 days 191. The company's total asset turnover for Year 2 is closest to: A. 0.99 B. 0.19 C. 5.32 D. 1.01 192. The company's equity multiplier at the end of Year 2 is closest to: A. 0.70 B. 1.43 C. 2.34 D. 0.43 Financial statements for Narstad Corporation appear below: 193. Narstad Corporation's times interest earned for Year 2 was closest to: A. 11.0 B. 10.0 C. 18.0 D. 7.0 194. Narstad Corporation's debt-to-equity ratio at the end of Year 2 was closest to: A. 0.50 B. 0.36 C. 0.19 D. 0.17 Lasch Corporation has provided the following financial data from its balance sheet and income statement: 195. The company's times interest earned for Year 2 is closest to: A. 1.43 B. 3.47 C. 2.43 D. 1.00 196. The company's debt-to-equity ratio at the end of Year 2 is closest to: A. 0.30 B. 0.36 C. 0.41 D. 0.60 197. The company's equity multiplier at the end of Year 2 is closest to: A. 1.60 B. 1.68 C. 0.63 D. 0.60 Deacon Corporation has provided the following financial data from its balance sheet and income statement: 198. The company's times interest earned for Year 2 is closest to: A. 2.74 B. 8.02 C. 5.21 D. 4.21 199. The company's debt-to-equity ratio at the end of Year 2 is closest to: A. 0.29 B. 0.38 C. 0.23 D. 0.64 200. The company's equity multiplier at the end of Year 2 is closest to: A. 0.64 B. 1.65 C. 1.57 D. 0.61 Fayer Corporation has provided the following financial data: Dividends on common stock during Year 2 totaled $4,500. The market price of common stock at the end of Year 2 was $10.88 per share. 201. The company's times interest earned for Year 2 is closest to: A. 7.71 B. 2.61 C. 5.01 D. 4.01 202. The company's debt-to-equity ratio at the end of Year 2 is closest to: A. 0.22 B. 0.27 C. 0.45 D. 0.19 203. The company's equity multiplier at the end of Year 2 is closest to: A. 0.69 B. 2.23 C. 0.45 D. 1.45 Tweedle Corporation's most recent balance sheet and income statement appear below: 204. The times interest earned for Year 2 is closest to: A. 6.40 B. 9.16 C. 14.51 D. 10.16 205. The debt-to-equity ratio at the end of Year 2 is closest to: A. 0.43 B. 0.24 C. 0.17 D. 0.54 Data from Lheureux Corporation's most recent balance sheet and the company's income statement appear below: 206. The times interest earned for Year 2 is closest to: A. 2.22 B. 4.17 C. 3.17 D. 5.95 207. The debt-to-equity ratio at the end of Year 2 is closest to: A. 0.38 B. 0.13 C. 0.16 D. 0.43 Neef Corporation has provided the following financial data from its balance sheet and income statement: 208. The company's net profit margin percentage for Year 2 is closest to: A. 37.3% B. 2.6% C. 1.4% D. 0.9% 209. The company's gross margin percentage for Year 2 is closest to: A. 59.6% B. 2.5% C. 37.3% D. 4076.9% 210. The company's return on total assets for Year 2 is closest to: A. 0.99% B. 1.00% C. 1.85% D. 1.83% 211. The company's return on equity for Year 2 is closest to: A. 67.25% B. 2.27% C. 1.47% D. 4.19% Garrott Corporation's total assets were $1,505,000 at the end of Year 2 and $1,520,000 at the end of Year 1. Its total stockholders' equity was $1,197,000 at the end of Year 2 and $1,180,000 at the end of Year 1. 212. The company's net profit margin percentage for Year 2 is closest to: A. 1.9% B. 2.7% C. 3.3% D. 38.1% 213. The company's gross margin percentage for Year 2 is closest to: A. 4.9% B. 61.4% C. 38.1% D. 2031.9% 214. The company's return on total assets for Year 2 is closest to: A. 2.09% B. 2.08% C. 1.67% D. 1.66% 215. The company's return on equity for Year 2 is closest to: A. 3.02% B. 3.77% C. 2.11% D. 79.14% Kearin Corporation has provided the following financial data: Dividends on common stock during Year 2 totaled $8,000. The market price of common stock at the end of Year 2 was $2.02 per share. 216. The company's net profit margin percentage for Year 2 is closest to: A. 3.9% B. 38.5% C. 2.5% D. 1.6% 217. The company's gross margin percentage for Year 2 is closest to: A. 62.5% B. 4.2% C. 38.5% D. 2381.0% 218. The company's return on total assets for Year 2 is closest to: A. 1.38% B. 2.18% C. 1.37% D. 2.19% 219. The company's return on equity for Year 2 is closest to: A. 71.44% B. 4.72% C. 2.97% D. 1.93% Doonan Corporation has provided the following financial data from its balance sheet and income statement: The market price of common stock at the end of Year 2 was $4.79 per share. 220. The company's return on total assets for Year 2 is closest to: A. 1.77% B. 2.46% C. 1.80% D. 2.42% 221. The company's return on equity for Year 2 is closest to: A. 5.60% B. 4.09% C. 2.66% D. 68.28% 222. The company's earnings per share for Year 2 is closest to: A. $6.33 per share B. $0.29 per share C. $0.45 per share D. $0.62 per share 223. The company's price-earnings ratio for Year 2 is closest to: A. 0.76 B. 10.64 C. 16.52 D. 7.73 Settles Corporation has provided the following financial data: Dividends on common stock during Year 2 totaled $5,400. The market price of common stock at the end of Year 2 was $5.89 per share. 224. The company's return on total assets for Year 2 is closest to: A. 2.75% B. 1.64% C. 1.65% D. 2.76% 225. The company's return on equity for Year 2 is closest to: A. 3.31% B. 8.50% C. 5.09% D. 50.52% 226. The company's earnings per share for Year 2 is closest to: A. $0.31 per share B. $0.47 per share C. $0.79 per share D. $3.88 per share 227. The company's price-earnings ratio for Year 2 is closest to: A. 19.00 B. 12.53 C. 7.46 D. 1.52 Recher Corporation's common stock has a par value of $3 per share and has been stable at a total value of $270,000 on the company's balance sheet for several years. The total stockholders' equity at the end of this year was $1,023,000 and at the beginning of the year was $1,010,000. Net income for the year was $17,500. Dividends on common stock during the year totaled $4,500. The market price of common stock at the end of the year was $3.76 per share. 228. The company's earnings per share is closest to: A. $7.37 per share B. $0.45 per share C. $0.30 per share D. $0.19 per share 229. The company's price-earnings ratio is closest to: A. 19.79 B. 0.51 C. 8.36 D. 12.53 230. The company's dividend payout ratio is closest to: A. 1.3% B. 1.7% C. 17.1% D. 26.3% 231. The company's dividend yield ratio is closest to: A. 1.7% B. 17.1% C. 1.3% D. 26.3% 232. The company's book value per share at the end of the year is closest to: A. $11.37 per share B. $7.37 per share C. $0.19 per share D. $16.81 per share Sperle Corporation has provided the following data concerning its stockholders' equity accounts: Net income for Year 2 was $30,400. Dividends on common stock during Year 2 totaled $6,400. The market price of common stock at the end of Year 2 was $3.08 per share. 233. The company's earnings per share for Year 2 is closest to: A. $8.18 per share B. $0.38 per share C. $0.54 per share D. $0.68 per share 234. The company's price-earnings ratio for Year 2 is closest to: A. 0.38 B. 4.53 C. 5.70 D. 8.11 235. The company's dividend payout ratio for Year 2 is closest to: A. 1.6% B. 21.1% C. 2.6% D. 14.7% 236. The company's dividend yield ratio for Year 2 is closest to: A. 21.1% B. 2.6% C. 1.6% D. 14.7% 237. The company's book value per share at the end of Year 2 is closest to: A. $0.38 per share B. $8.18 per share C. $18.08 per share D. $13.93 per share Symons Corporation has provided the following financial data: Dividends on common stock during Year 2 totaled $2,500. The market price of common stock at the end of Year 2 was $2.01 per share. 238. The company's earnings per share for Year 2 is closest to: A. $0.53 per share B. $11.54 per share C. $0.19 per share D. $0.27 per share 239. The company's price-earnings ratio for Year 2 is closest to: A. 3.79 B. 10.58 C. 0.17 D. 7.44 240. The company's dividend payout ratio for Year 2 is closest to: A. 26.3% B. 2.5% C. 18.4% D. 1.0% 241. The company's dividend yield ratio for Year 2 is closest to: A. 1.0% B. 18.4% C. 26.3% D. 2.5% 242. The company's book value per share at the end of Year 2 is closest to: A. $17.94 per share B. $28.26 per share C. $0.19 per share D. $11.54 per share Essay Questions 243. Rubendall Corporation's total current assets are $310,000, its noncurrent assets are $630,000, its total current liabilities are $250,000, its long-term liabilities are $300,000, and its stockholders' equity is $390,000. Required: Compute the company's current ratio. Show your work! 244. Gremel Corporation has provided the following financial data: Required: a. What is the company's working capital? b. What is the company's current ratio? c. What is the company's acid-test (quick) ratio? 245. Steinkraus Corporation has provided the following data: Required: Compute the accounts receivable turnover for this year. Show your work! 246. Arkin Corporation's total current assets are $290,000, its noncurrent assets are $520,000, its total current liabilities are $210,000, its long-term liabilities are $420,000, and its stockholders' equity is $180,000. Required: Compute the company's working capital. Show your work! 247. Wowk Corporation has provided the following financial data: Required: a. What is the company's working capital? b. What is the company's current ratio? c. What is the company's acid-test (quick) ratio? 248. Data from Yochem Corporation's most recent balance sheet appear below: Required: Compute the company's acid-test ratio. Show your work! 249. Excerpts from Candle Corporation's most recent balance sheet (in thousands of dollars) appear below: Sales on account during the year totaled $1,200 thousand. Cost of goods sold was $800 thousand. Required: Compute the following for Year 2: a. Working capital. b. Current ratio. c. Acid-test ratio. d. Accounts receivable turnover. e. Average collection period. f. Inventory turnover. g. Average sale period. 250. Wegener Corporation's most recent balance sheet and income statement appear below: Required: Compute the following for Year 2: a. Working capital. b. Current ratio. c. Acid-test ratio. d. Accounts receivable turnover. e. Average collection period. f. Inventory turnover. g. Average sale period. 251. Abdool Corporation has provided the following financial data: Required: a. What is the company's working capital at the end of Year 2? b. What is the company's current ratio at the end of Year 2? c. What is the company's acid-test (quick) ratio at the end of Year 2? d. What is the company's accounts receivable turnover for Year 2? e. What is the company's average collection period (age of receivables) for Year 2? f. What is the company's inventory turnover for Year 2? g. What is the company's average sale period (turnover in days) for Year 2? h. What is the company's operating cycle for Year 2? i. What is the company's total asset turnover for Year 2? 252. Financial statements for Rardin Corporation appear below: Required: Compute the following for Year 2: a. Current ratio. b. Acid-test ratio. c. Average collection period. d. Inventory turnover. e. Times interest earned. f. Debt-to-equity ratio. 253. Mondok Corporation has provided the following financial data: Required: a. What is the company's working capital at the end of Year 2? b. What is the company's current ratio at the end of Year 2? c. What is the company's acid-test (quick) ratio at the end of Year 2? d. What is the company's accounts receivable turnover for Year 2? e. What is the company's average collection period (age of receivables) for Year 2? f. What is the company's inventory turnover for Year 2? g. What is the company's average sale period (turnover in days) for Year 2? h. What is the company's operating cycle for Year 2? i. What is the company's total asset turnover for Year 2? j. What is the company's times interest earned for Year 2? k. What is the company's debt-to-equity ratio at the end of Year 2? l. What is the company's equity multiplier at the end of Year 2? 254. Two-Rivers Inc. (TRI) manufactures a variety of consumer products. The company's founders have run the company for thirty years and are now interested in retiring. Consequently, they are seeking a purchaser, and a group of investors is looking into the acquisition of TRI. To evaluate its financial stability, TRI was requested to provide its latest financial statements and selected financial ratios. Summary information provided by TRI is presented below. Required: a. Calculate the select financial ratios for the fiscal year Year 2. b. Interpret what each of these financial ratios means in terms of TRI's financial stability and operating efficiency. 255. Financial statements for Praeger Corporation appear below: Dividends during Year 2 totaled $45 thousand. The market price of a share of common stock on December 31, Year 2 was $30. Required: Compute the following for Year 2: a. Return on total assets. b. Working capital. c. Current ratio. d. Acid-test ratio. e. Accounts receivable turnover. f. Average collection period. g. Inventory turnover. h. Average sale period. i. Times interest earned. j. Debt-to-equity ratio. 256. Kaloi Corporation has provided the following financial data: Dividends on common stock during Year 2 totaled $3,500. The market price of common stock at the end of Year 2 was $7.46 per share. Required: a. What is the company's working capital at the end of Year 2? b. What is the company's current ratio at the end of Year 2? c. What is the company's acid-test (quick) ratio at the end of Year 2? d. What is the company's accounts receivable turnover for Year 2? e. What is the company's average collection period (age of receivables) for Year 2? f. What is the company's inventory turnover for Year 2? g. What is the company's average sale period (turnover in days) for Year 2? h. What is the company's operating cycle for Year 2? i. What is the company's total asset turnover for Year 2? j. What is the company's times interest earned for Year 2? k. What is the company's debt-to-equity ratio at the end of Year 2? l. What is the company's equity multiplier at the end of Year 2? m. What is the company's net profit margin percentage for Year 2? n. What is the company's gross margin percentage for Year 2? o. What is the company's return on total assets for Year 2? p. What is the company's return on equity for Year 2? 257. Hyrkas Corporation's most recent balance sheet and income statement appear below: Dividends on common stock during Year 2 totaled $30 thousand. The market price of common stock at the end of Year 2 was $6.90 per share. Required: Compute the following for Year 2: a. Gross margin percentage. b. Earnings per share. c. Price-earnings ratio. d. Dividend payout ratio. e. Dividend yield ratio. f. Return on total assets. g. Return on equity. h. Book value per share. i. Working capital. j. Current ratio. k. Acid-test ratio. l. Accounts receivable turnover. m. Average collection period. n. Inventory turnover. o. Average sale period. p. Times interest earned. q. Debt-to-equity ratio. 258. Kisselburg Corporation has provided the following financial data: Dividends on common stock during Year 2 totaled $4,000. The market price of common stock at the end of Year 2 was $5.75 per share. Required: a. What is the company's working capital at the end of Year 2? b. What is the company's current ratio at the end of Year 2? c. What is the company's acid-test (quick) ratio at the end of Year 2? d. What is the company's accounts receivable turnover for Year 2? e. What is the company's average collection period (age of receivables) for Year 2? f. What is the company's inventory turnover for Year 2? g. What is the company's average sale period (turnover in days) for Year 2? h. What is the company's operating cycle for Year 2? i. What is the company's total asset turnover for Year 2? j. What is the company's times interest earned for Year 2? k. What is the company's debt-to-equity ratio at the end of Year 2? l. What is the company's equity multiplier at the end of Year 2? m. What is the company's net profit margin percentage for Year 2? n. What is the company's gross margin percentage for Year 2? o. What is the company's return on total assets for Year 2? p. What is the company's return on equity for Year 2? q. What is the company's earnings per share for Year 2? r. What is the company's price-earnings ratio for Year 2? s. What is the company's dividend payout ratio for Year 2? t. What is the company's dividend yield ratio for Year 2? u. What is the company's book value per share at the end of Year 2? 259.M. K. Berry is the managing director of CE Ltd. a small, family-owned company which manufactures cutlery. His company belongs to a trade association which publishes a monthly magazine. The latest issue of the magazine contains a very brief article based on the analysis of the accounting statements published by the 40 companies which manufacture this type of product. The article contains the following table: CE Ltd's latest financial statements are as follows: The country in which the company operates has no corporate income tax. No dividends were paid during the year. All sales are on account. Required: a. Calculate each of the ratios listed in the magazine article for this year for CE, and comment briefly on CE Ltd's performance in comparison to the industrial averages. b. Explain why it could be misleading to compare CE Ltd's ratios with those taken from the article. 260. Neiger Corporation has provided the following financial data: Required: a. What is the company's working capital at the end of Year 2? b. What is the company's current ratio at the end of Year 2? c. What is the company's acid-test (quick) ratio at the end of Year 2? d. What is the company's times interest earned for Year 2? e. What is the company's debt-to-equity ratio at the end of Year 2? f. What is the company's equity multiplier at the end of Year 2? 261. Walker Corporation has provided the following financial data: The company's net operating income for Year 2 was $63,615 and its interest expense was $15,000. Required: a. What is the company's working capital at the end of Year 2? b. What is the company's current ratio at the end of Year 2? c. What is the company's acid-test (quick) ratio at the end of Year 2? d. What is the company's times interest earned for Year 2? e. What is the company's debt-to-equity ratio at the end of Year 2? f. What is the company's equity multiplier at the end of Year 2? 262. Data from Ben Corporation's most recent balance sheet and income statement appear below: Required: Compute the average sale period for this year: 263. Dilisio Corporation has provided the following data: Required: Compute the inventory turnover for this year: 264. Hagle Corporation has provided the following financial data: Required: a. What is the company's accounts receivable turnover for Year 2? b. What is the company's average collection period (age of receivables) for Year 2? c. What is the company's inventory turnover for Year 2? d. What is the company's average sale period (turnover in days) for Year 2? e. What is the company's operating cycle for Year 2? f. What is the company's total asset turnover for Year 2? 265. Data from Dalpiaz Corporation's most recent balance sheet and income statement appear below: Required: Compute the average collection period for this year: 266. Kestner Corporation has provided the following financial data: Required: a. What is the company's accounts receivable turnover for Year 2? b. What is the company's average collection period (age of receivables) for Year 2? c. What is the company's inventory turnover for Year 2? d. What is the company's average sale period (turnover in days) for Year 2? e. What is the company's operating cycle for Year 2? f. What is the company's total asset turnover for Year 2? 267. Wyand Corporation's net operating income last year was $212,000; its interest expense was $26,000; its total stockholders' equity was $1,000,000; and its total liabilities were $370,000. Required: Compute the following for Year 2: a. Times interest earned. b. Debt-to-equity ratio. 268. Fraction Corporation has provided the following financial data: Required: a. What is the company's times interest earned for Year 2? b. What is the company's debt-to-equity ratio at the end of Year 2? c. What is the company's equity multiplier at the end of Year 2? 269. Babbitt Corporation has provided the following data from its most recent income statement: Required: Compute the times interest earned ratio. Show your work! 270. Gambino Corporation has provided the following financial data: Required: a. What is the company's times interest earned for Year 2? b. What is the company's debt-to-equity ratio at the end of Year 2? c. What is the company's equity multiplier at the end of Year 2? 271. Sidell Corporation's most recent balance sheet and income statement appear below: Required: Compute the following for Year 2: a. Times interest earned. b. Debt-to-equity ratio. 272. Lindboe Corporation has provided the following financial data: Dividends on common stock during Year 2 totaled $4,800. The market price of common stock at the end of Year 2 was $5.46 per share. Required: a. What is the company's times interest earned for Year 2? b. What is the company's debt-to-equity ratio at the end of Year 2? c. What is the company's equity multiplier at the end of Year 2? d. What is the company's net profit margin percentage for Year 2? e. What is the company's gross margin percentage for Year 2? f. What is the company's return on total assets for Year 2? g. What is the company's return on equity for Year 2? 273. Schepp Corporation has provided the following financial data: Required: a. What is the company's times interest earned for Year 2? b. What is the company's debt-to-equity ratio at the end of Year 2? c. What is the company's equity multiplier at the end of Year 2? d. What is the company's net profit margin percentage for Year 2? e. What is the company's gross margin percentage for Year 2? f. What is the company's return on total assets for Year 2? g. What is the company's return on equity for Year 2? 274. Brill Corporation has provided the following financial data: Dividends on common stock during Year 2 totaled $2,100. The market price of common stock at the end of Year 2 was $2.32 per share. Required: a. What is the company's times interest earned for Year 2? b. What is the company's debt-to-equity ratio at the end of Year 2? c. What is the company's equity multiplier at the end of Year 2? d. What is the company's net profit margin percentage for Year 2? e. What is the company's gross margin percentage for Year 2? f. What is the company's return on total assets for Year 2? g. What is the company's return on equity for Year 2? h. What is the company's earnings per share for Year 2? i. What is the company's price-earnings ratio for Year 2? j. What is the company's dividend payout ratio for Year 2? k. What is the company's dividend yield ratio for Year 2? l. What is the company's book value per share at the end of Year 2? 275. Jaquez Corporation has provided the following financial data: Dividends on common stock during Year 2 totaled $10,000. The market price of common stock at the end of Year 2 was $5.45 per share. Required: a. What is the company's times interest earned for Year 2? b. What is the company's debt-to-equity ratio at the end of Year 2? c. What is the company's equity multiplier at the end of Year 2? d. What is the company's net profit margin percentage for Year 2? e. What is the company's gross margin percentage for Year 2? f. What is the company's return on total assets for Year 2? g. What is the company's return on equity for Year 2? h. What is the company's earnings per share for Year 2? i. What is the company's price-earnings ratio for Year 2? j. What is the company's dividend payout ratio for Year 2? k. What is the company's dividend yield ratio for Year 2? l. What is the company's book value per share at the end of Year 2? 276. Medina Corporation has provided the following financial data: Dividends on common stock during Year 2 totaled $2,000. The market price of common stock at the end of Year 2 was $1.49 per share. Required: a. What is the company's times interest earned for Year 2? b. What is the company's debt-to-equity ratio at the end of Year 2? c. What is the company's equity multiplier at the end of Year 2? d. What is the company's net profit margin percentage for Year 2? e. What is the company's gross margin percentage for Year 2? f. What is the company's return on total assets for Year 2? g. What is the company's return on equity for Year 2? h. What is the company's earnings per share for Year 2? i. What is the company's price-earnings ratio for Year 2? j. What is the company's dividend payout ratio for Year 2? k. What is the company's dividend yield ratio for Year 2? l. What is the company's book value per share at the end of Year 2? 277. Tobia Corporation has provided the following financial data: Dividends on common stock during Year 2 totaled $6,300. The market price of common stock at the end of Year 2 was $1.78 per share. Required: a. What is the company's times interest earned for Year 2? b. What is the company's debt-to-equity ratio at the end of Year 2? c. What is the company's equity multiplier at the end of Year 2? d. What is the company's earnings per share for Year 2? e. What is the company's price-earnings ratio for Year 2? f. What is the company's dividend payout ratio for Year 2? g. What is the company's dividend yield ratio for Year 2? h. What is the company's book value per share at the end of Year 2? 278. Vogelsberg Corporation has provided the following financial data: The company's net operating income in Year 2 was $62,308; its interest expense was $12,000; and its net income was $32,700. Dividends on common stock during Year 2 totaled $2,700. The market price of common stock at the end of Year 2 was $6.37 per share. Required: a. What is the company's times interest earned for Year 2? b. What is the company's debt-to-equity ratio at the end of Year 2? c. What is the company's equity multiplier at the end of Year 2? d. What is the company's earnings per share for Year 2? e. What is the company's price-earnings ratio for Year 2? f. What is the company's dividend payout ratio for Year 2? g. What is the company's dividend yield ratio for Year 2? h. What is the company's book value per share at the end of Year 2? 279. Remley Corporation has provided the following financial data: Dividends on common stock during Year 2 totaled $3,000. The market price of common stock at the end of Year 2 was $2.70 per share. Required: a. What is the company's times interest earned for Year 2? b. What is the company's debt-to-equity ratio at the end of Year 2? c. What is the company's equity multiplier at the end of Year 2? d. What is the company's earnings per share for Year 2? e. What is the company's price-earnings ratio for Year 2? f. What is the company's dividend payout ratio for Year 2? g. What is the company's dividend yield ratio for Year 2? h. What is the company's book value per share at the end of Year 2? 280. Pribyl Corporation has provided the following financial data: Required: a. What is the company's net profit margin percentage for Year 2? b. What is the company's gross margin percentage for Year 2? c. What is the company's return on total assets for Year 2? d. What is the company's return on equity for Year 2? 281. Perrett Corporation has provided the following financial data: Required: a. What is the company's net profit margin percentage for Year 2? b. What is the company's gross margin percentage for Year 2? c. What is the company's return on total assets for Year 2? d. What is the company's return on equity for Year 2? 282. Jepson Corporation's most recent income statement appears below: Required: Compute the gross margin percentage. 283. Gehlhausen Corporation has provided the following financial data: Dividends on common stock during Year 2 totaled $5,600. The market price of common stock at the end of Year 2 was $5.60 per share. Required: a. What is the company's net profit margin percentage for Year 2? b. What is the company's gross margin percentage for Year 2? c. What is the company's return on total assets for Year 2? d. What is the company's return on equity for Year 2? 284. Degollado Corporation's most recent income statement appears below: The beginning balance of total assets was $200,000 and the ending balance was $220,000. Required: Compute the return on total assets. Show your work! 285. Marovich Corporation has provided the following financial data: Dividends on common stock during Year 2 totaled $4,000. The market price of common stock at the end of Year 2 was $6.41 per share. Required: a. What is the company's net profit margin percentage for Year 2? b. What is the company's gross margin percentage for Year 2? c. What is the company's return on total assets for Year 2? d. What is the company's return on equity for Year 2? e. What is the company's earnings per share for Year 2? f. What is the company's price-earnings ratio for Year 2? g. What is the company's dividend payout ratio for Year 2? h. What is the company's dividend yield ratio for Year 2? i. What is the company's book value per share at the end of Year 2? 286. Straton Corporation has provided the following financial data: Dividends on common stock during Year 2 totaled $2,100. The market price of common stock at the end of Year 2 was $5.56 per share. Required: a. What is the company's net profit margin percentage for Year 2? b. What is the company's gross margin percentage for Year 2? c. What is the company's return on total assets for Year 2? d. What is the company's return on equity for Year 2? e. What is the company's earnings per share for Year 2? f. What is the company's price-earnings ratio for Year 2? g. What is the company's dividend payout ratio for Year 2? h. What is the company's dividend yield ratio for Year 2? i. What is the company's book value per share at the end of Year 2? 287. Moselle Corporation has provided the following financial data: Dividends on common stock during Year 2 totaled $4,200. The market price of common stock at the end of Year 2 was $9.72 per share. Required: a. What is the company's earnings per share for Year 2? b. What is the company's price-earnings ratio for Year 2? c. What is the company's dividend payout ratio for Year 2? d. What is the company's dividend yield ratio for Year 2? e. What is the company's book value per share at the end of Year 2? 288. Mihok Corporation has provided the following financial data: Dividends on common stock during Year 2 totaled $5,000. The market price of common stock at the end of Year 2 was $0.97 per share. Required: a. What is the company's earnings per share for Year 2? b. What is the company's price-earnings ratio for Year 2? c. What is the company's dividend payout ratio for Year 2? d. What is the company's dividend yield ratio for Year 2? e. What is the company's book value per share at the end of Year 2? 289. Sehrt Corporation has provided the following financial data: The company's net income for Year 2 was $44,000. Dividends on common stock during Year 2 totaled $11,000. The market price of common stock at the end of Year 2 was $6.29 per share. Required: a. What is the company's earnings per share for Year 2? b. What is the company's price-earnings ratio for Year 2? c. What is the company's dividend payout ratio for Year 2? d. What is the company's dividend yield ratio for Year 2? e. What is the company's book value per share at the end of Year 2? Chapter 15 Financial Statement Analysis Answer Key [Show More]
Last updated: 1 year ago
Preview 1 out of 475 pages
Buy this document to get the full access instantly
Instant Download Access after purchase
Add to cartInstant download
We Accept:

Reviews( 0 )
$10.00
Document information
Connected school, study & course
About the document
Uploaded On
Jun 07, 2020
Number of pages
475
Written in

Additional information
This document has been written for:
Uploaded
Jun 07, 2020
Downloads
0
Views
2033


.png)