Statistics > SOPHIA Milestone > SOPHIA Milestone Introduction to Statistics Unit 4 Milestone 4| Exam (All)
SOPHIA Milestone Introduction to Statistics Unit 4 Milestone 4| Exam
Document Content and Description Below
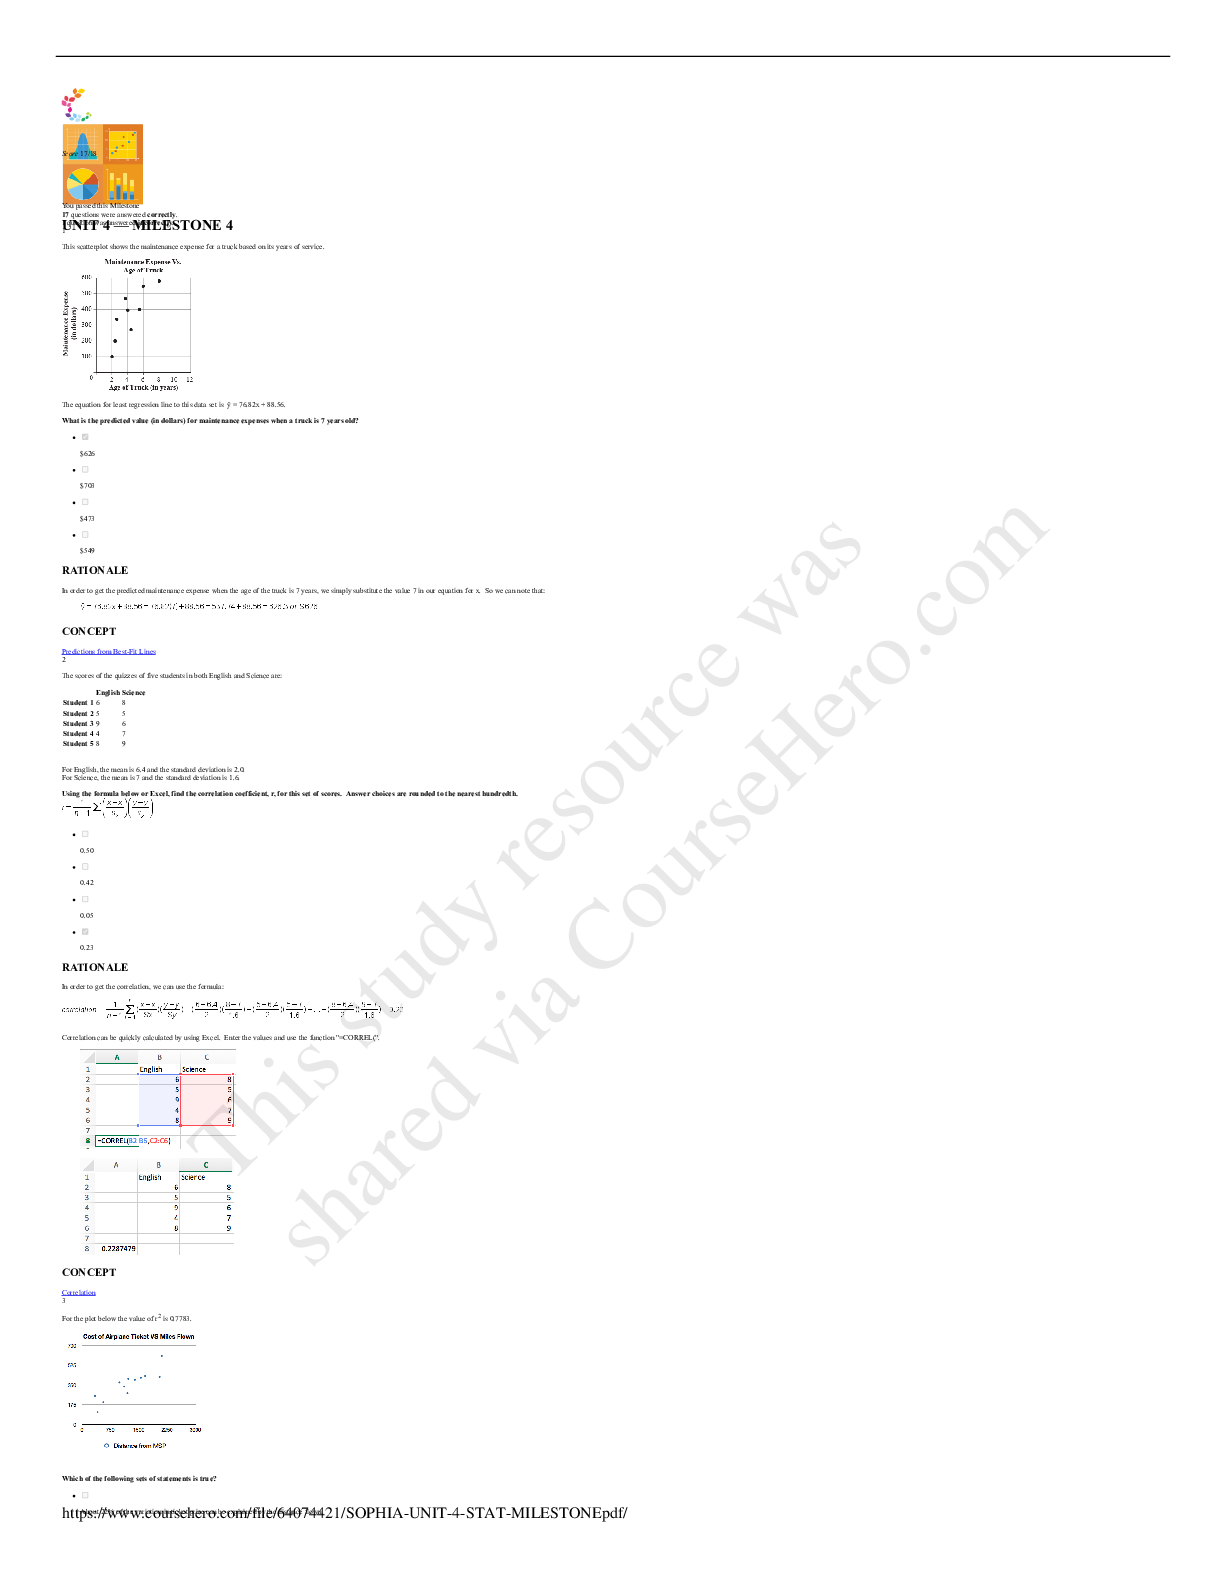
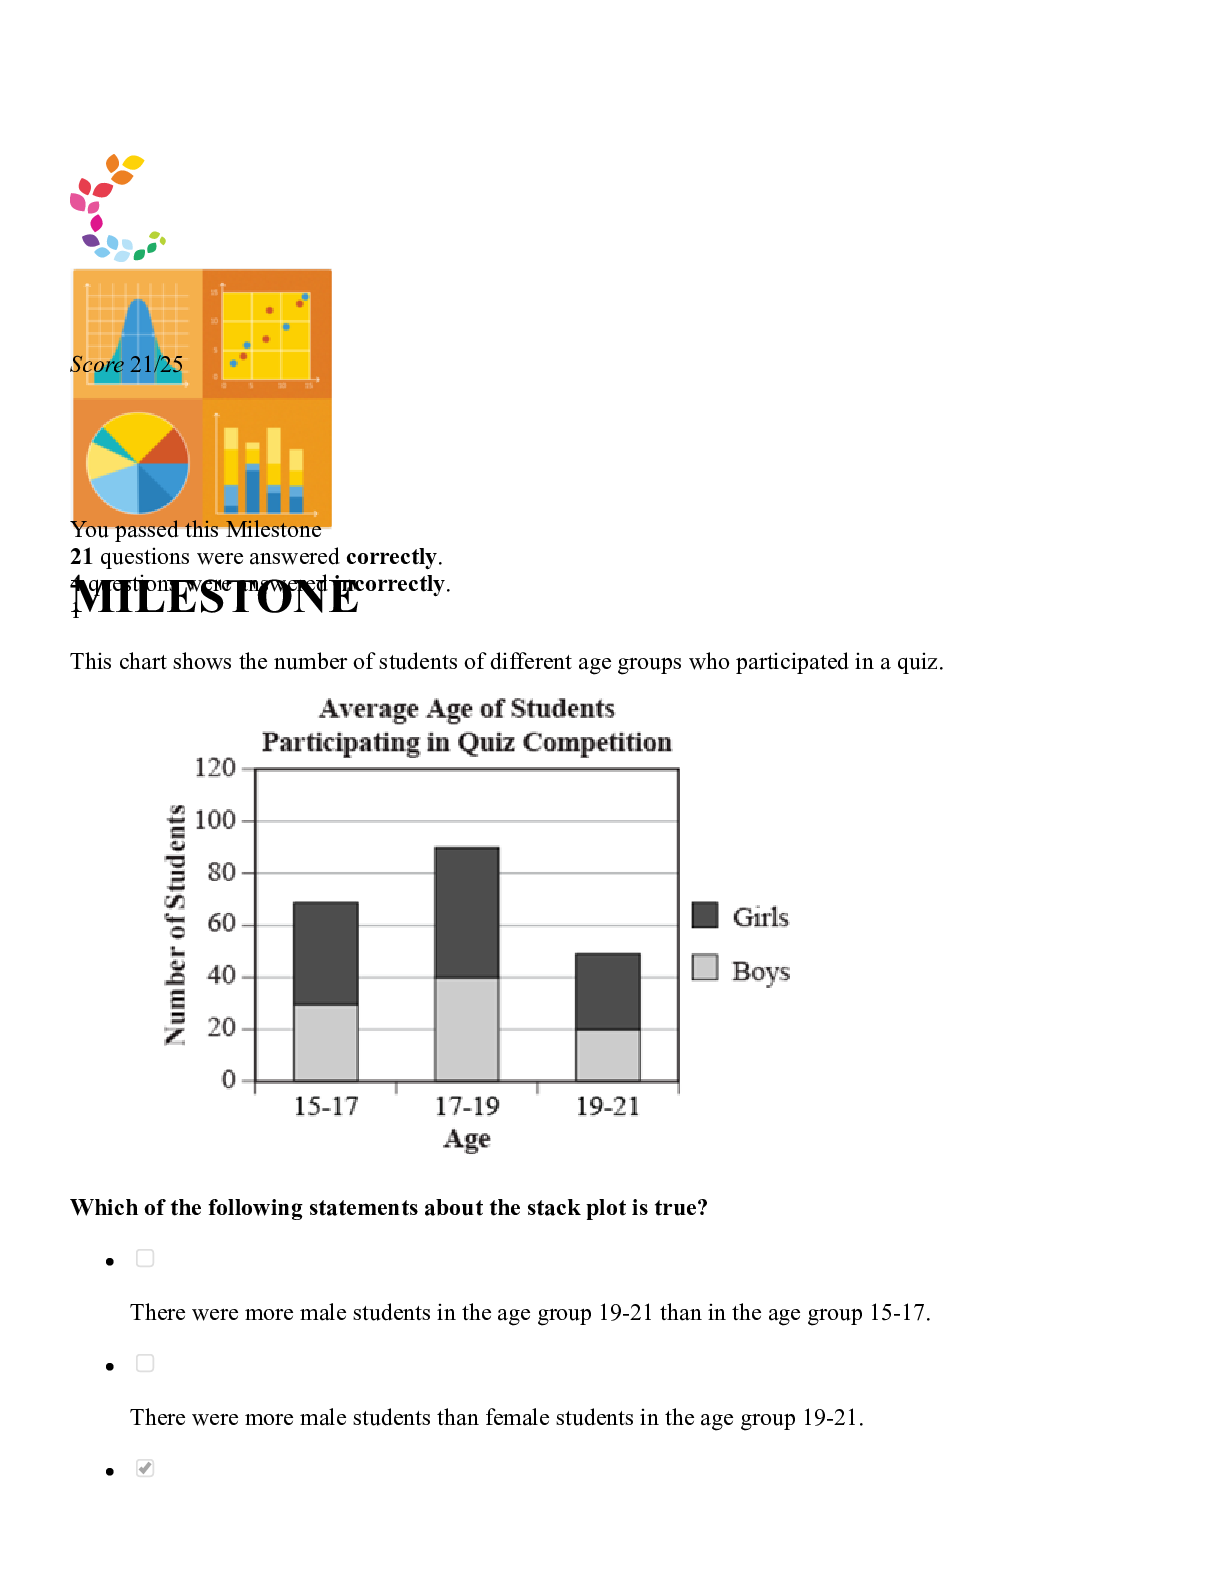
UNIT 4 MILESTONE 4 You passed this Milestone 16 questions were answered correctly. 2 were answered incorrectly For ten students, a teacher records the following scores of two assessments, Quiz 1... and Test. Quiz 1 (x) Test (y) 15 20 12 15 10 12 14 18 10 10 8 13 6 12 15 10 16 18 13 15 Mean 11.9 14.3 Standard Deviation 3.3 3.5 The correlation of Quiz 1 and Test is 0.568. Given the information below, what is the slope and y-intercept for the least-squares line of the Quiz 1 scores and Test scores? Answer choices are rounded to the hundredths place. [Show More]
Last updated: 1 year ago
Preview 1 out of 24 pages

Reviews( 0 )
Document information
Connected school, study & course
About the document
Uploaded On
May 05, 2021
Number of pages
24
Written in

Additional information
This document has been written for:
Uploaded
May 05, 2021
Downloads
0
Views
224