Statistics > SOPHIA Milestone > SOPHIA_INTRO TO STATISTICS_FINAL_MILESTONE.pdf. LATEST MASTERPIECE. RATIONALE ANSWERS PROVIDED. RATE (All)
SOPHIA_INTRO TO STATISTICS_FINAL_MILESTONE.pdf. LATEST MASTERPIECE. RATIONALE ANSWERS PROVIDED. RATED A+
Document Content and Description Below
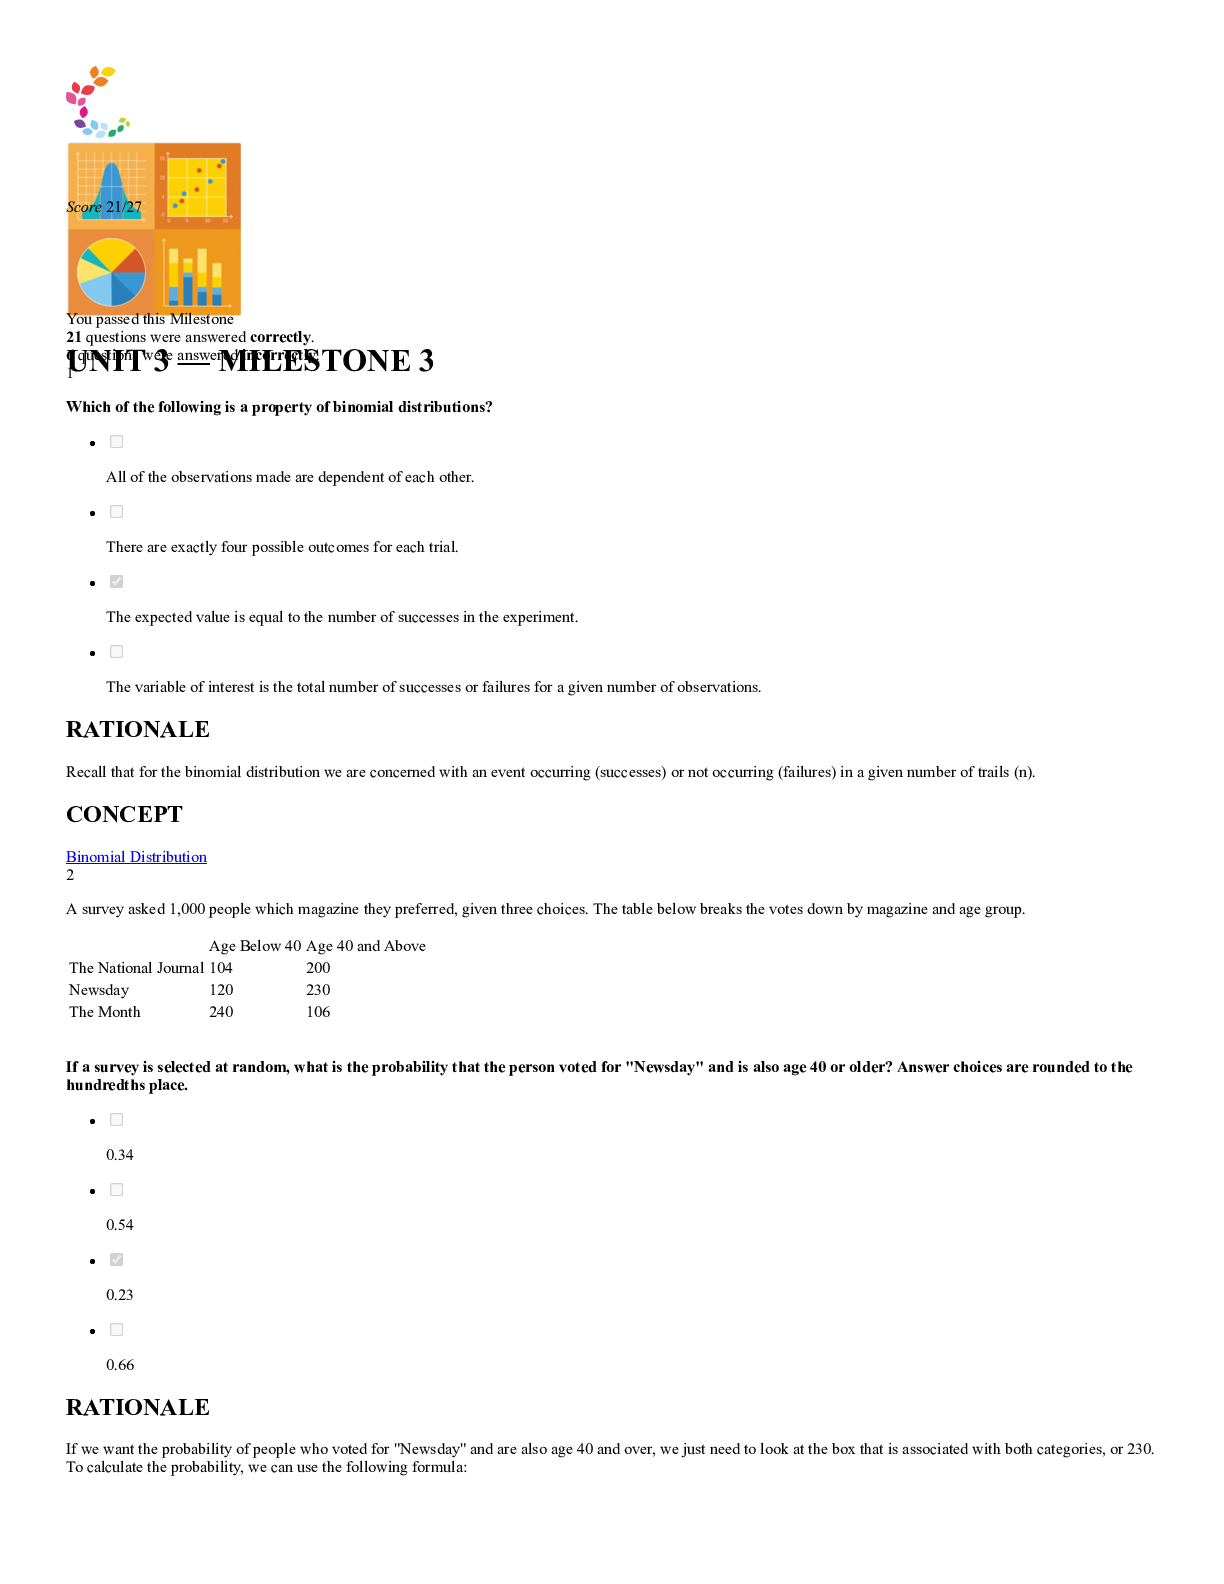
MILESTONE Score 25/25 You passed this Milestone 25 questions were answered correctly. 1 Choose the statement that accurately describes how a city government could apply systematic random sampling... . Every individual over the age of 18 is selected to participate in a survey about city services. Every resident in five neighborhoods is selected to participate in a survey about city services. Every fifth person in a population is selected to participate in a survey about city services. Every resident is divided into groups, and 1,000 people are randomly selected to participate in a survey about city services. RATIONALE A systematic sample is when every nth element is chosen from the population. In this case, by choosing every 5th household, this makes is a systematic sample. CONCEPT Simple Random and Systematic Random Sampling 2 This scatterplot shows the maintenance expense for a truck based on its years of service. 9/6/2021 Sophia :: Welcome https://app.sophia.org/spcc/introduction-to-statistics-2/milestone_take_feedbacks/10644399 2/13 The equation for least regression line to this data set is ŷ = 76.82x + 88.56. What is the predicted value (in dollars) for maintenance expenses when a truck is 7 years old? $703 $549 $473 $626 RATIONALE In order to get the predicted maintenance expense when the age of the truck is 7 years, we simply substitute the value 7 in our equation for x. So we can note that: 9/6/2021 Sophia :: Welcome https://app.sophia.org/spcc/introduction-to-statistics-2/milestone_take_feedbacks/10644399 3/13 CONCEPT Predictions from Best-Fit Lines 3 A superintendent of a school district conducted a survey to find out the level of job satisfaction among teachers. Out of 53 teachers who replied to the survey, 13 claim they are satisfied with their job. The superintendent wishes to construct a significance test for her data. She finds that the proportion of satisfied teachers nationally is 18.4%. What is the z-statistic for this data? Answer choices are rounded to the hundredths place. 1.24 2.90 0.61 1.15 RATIONALE To make things a little easier, let's first note the denominator We can now note that Finally, subbing all in we find CONCEPT Z-Test for Population Proportions 4 Zhi and her friends moved on to the card tables at the casino. Zhi wanted to figure out the probability of drawing a face card or an Ace. Choose the correct probability of drawing a face card or an Ace. Answer choices are in the form of a percentage, rounded to the nearest whole number. 4% 8% 25% 31% RATIONALE Since the two events, drawing a face card and drawing an ace card, are non-overlapping, we can use the following formula [Show More]
Last updated: 1 year ago
Preview 1 out of 13 pages
Instant download
Buy this document to get the full access instantly
Instant Download Access after purchase
Add to cartInstant download
Reviews( 0 )
Document information
Connected school, study & course
About the document
Uploaded On
Mar 30, 2022
Number of pages
13
Written in

Additional information
This document has been written for:
Uploaded
Mar 30, 2022
Downloads
1
Views
100