Computer Science > QUESTIONS & ANSWERS > Weekly Quiz 1: DATA VISUALIZATION IN TABLEAU (All)
Weekly Quiz 1: DATA VISUALIZATION IN TABLEAU
Document Content and Description Below
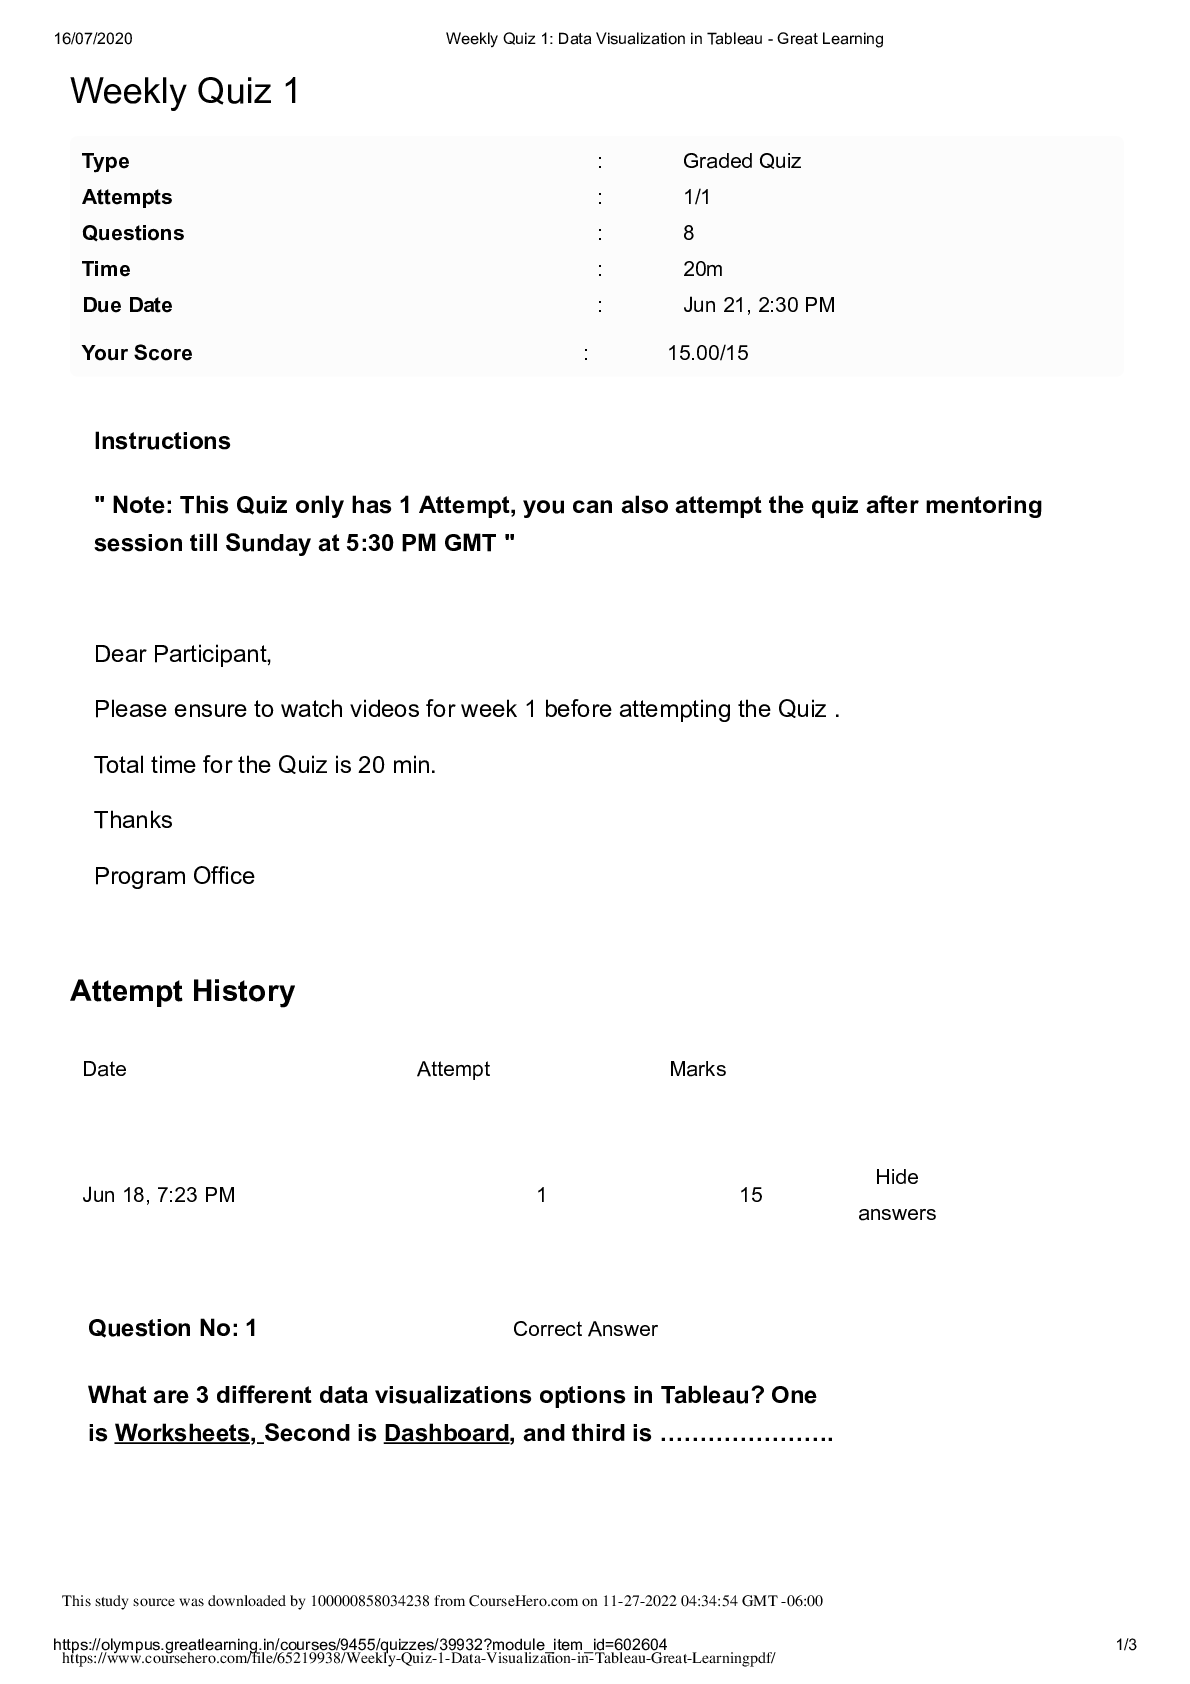
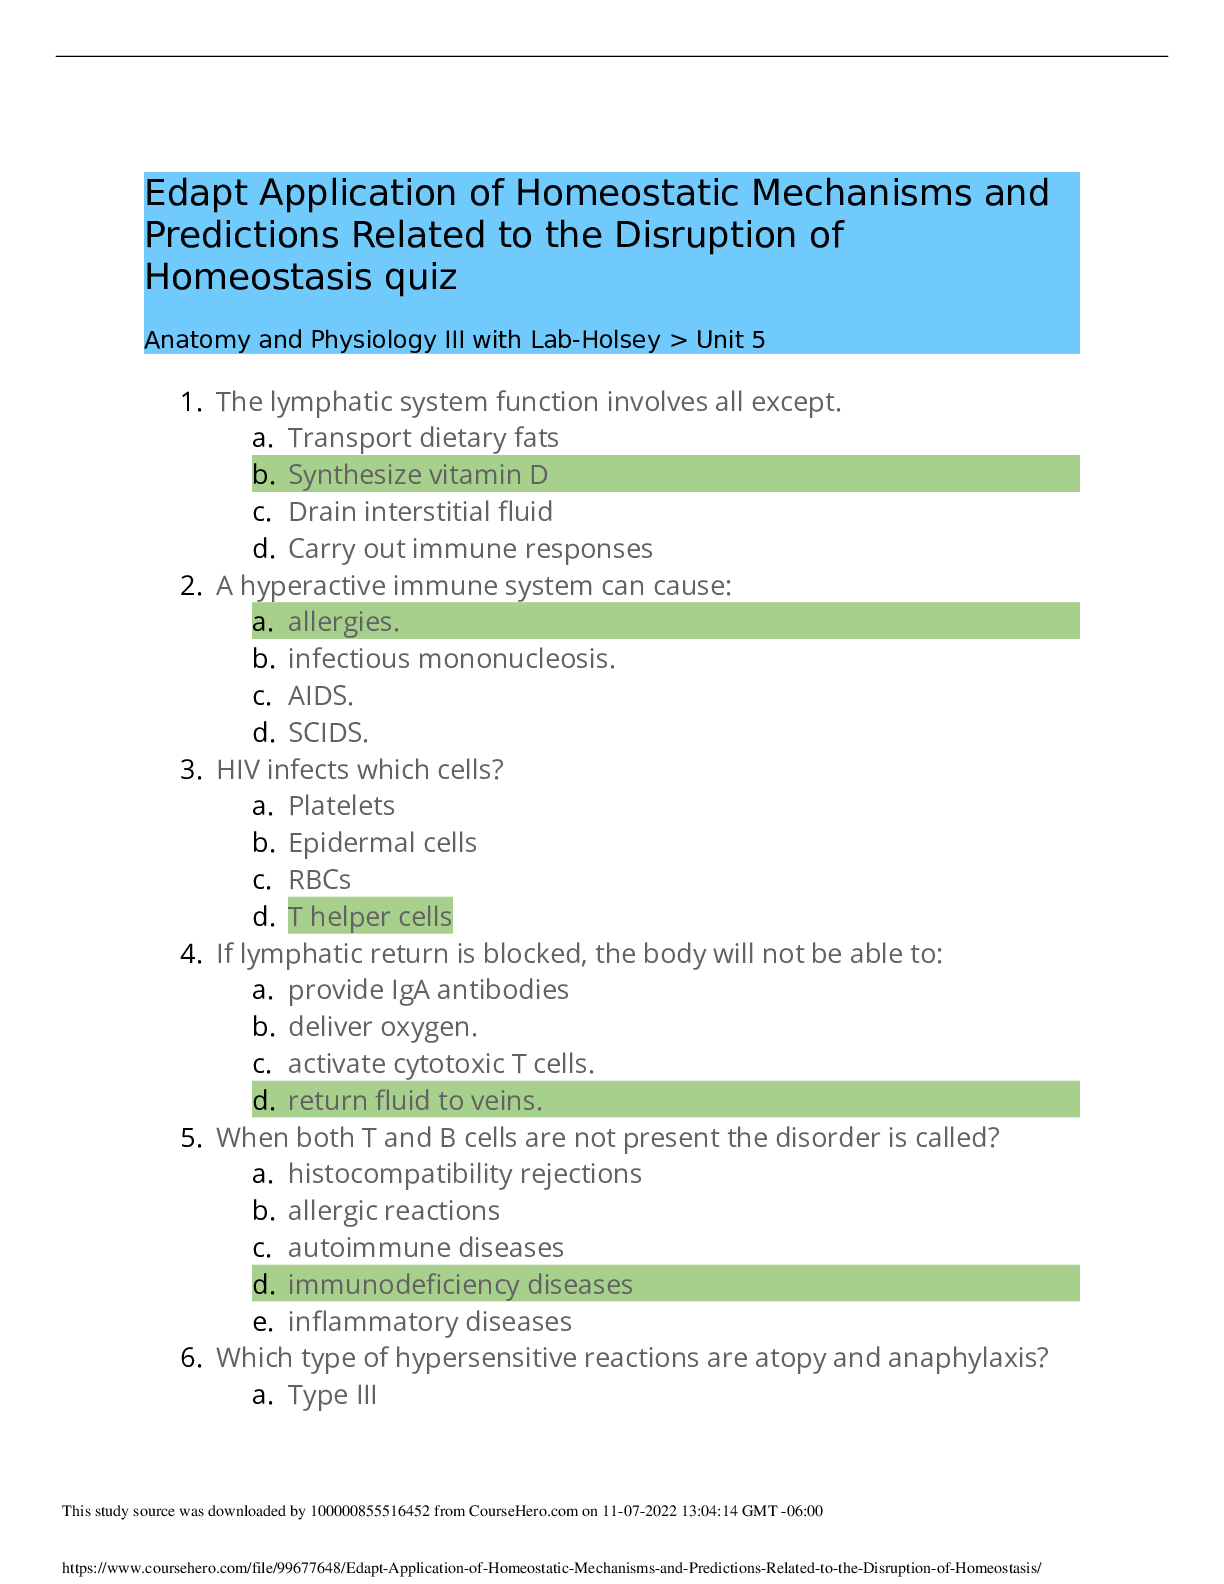
Question No: 1 Correct Answer What are 3 different data visualizations options in Tableau? One is Worksheets, Second is Dashboard, and third is …………………. Question No: 2 Correct Answer ... What is another metric apart from “Measures” in Tableau which corresponds to string data? Question No: 3 Correct Answer Can we create multiple dashboards in Tableau? Question No: 4 Correct Answer What is another metric apart from “Dimension” in Tableau which corresponds to numeric data? Question No: 5 Correct Answer Can we connect Tableau to multiple data sources? Question No: 6 Correct Answer Name two different containers in dashboard that are used to merge worksheets? Question No: 7 Correct Answer Can we convert dimensions to measures and vice versa? Question No: 8 Correct Answer Can we track Website browsing data using Tableau? [Show More]
Last updated: 1 year ago
Preview 1 out of 3 pages
Instant download
Instant download
Reviews( 0 )
Document information
Connected school, study & course
About the document
Uploaded On
Feb 08, 2023
Number of pages
3
Written in

Additional information
This document has been written for:
Uploaded
Feb 08, 2023
Downloads
0
Views
92


.png)
