Statistics > QUESTIONS & ANSWERS > WGU Data Driven Decision Making - C207 Complete Solutions (All)
WGU Data Driven Decision Making - C207 Complete Solutions
Document Content and Description Below
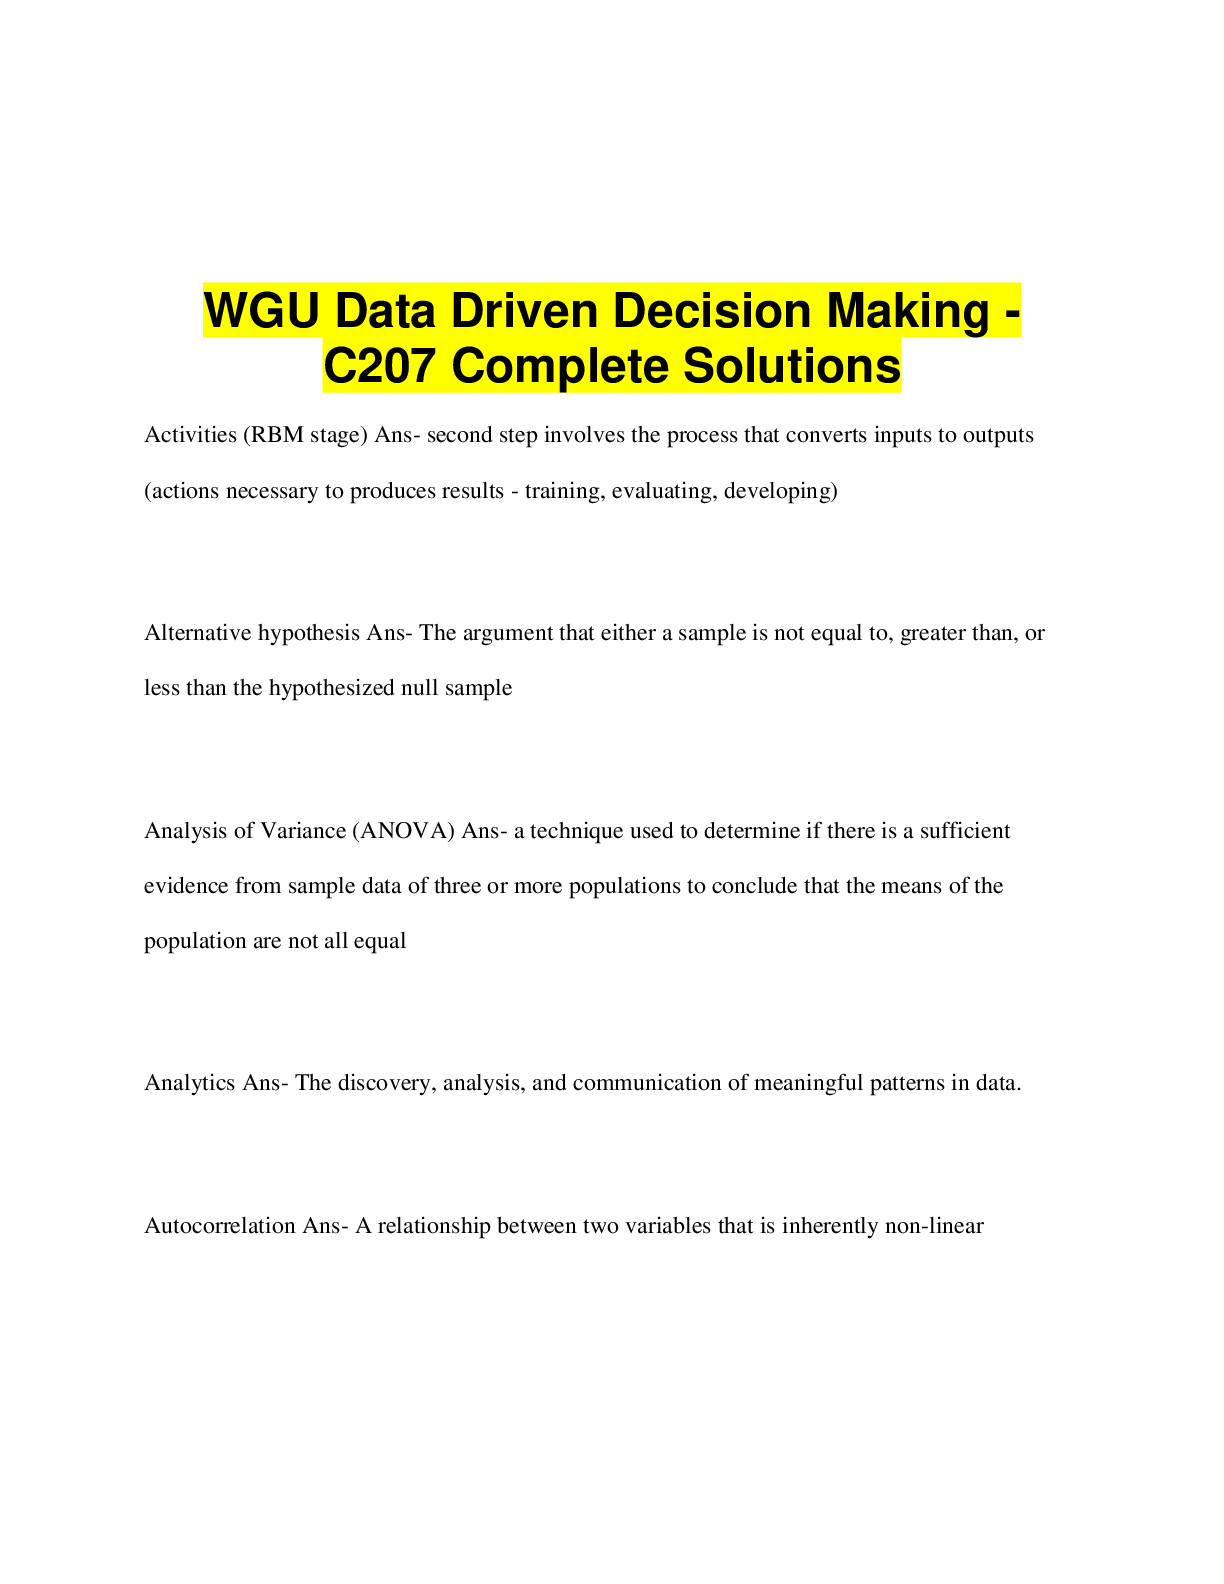
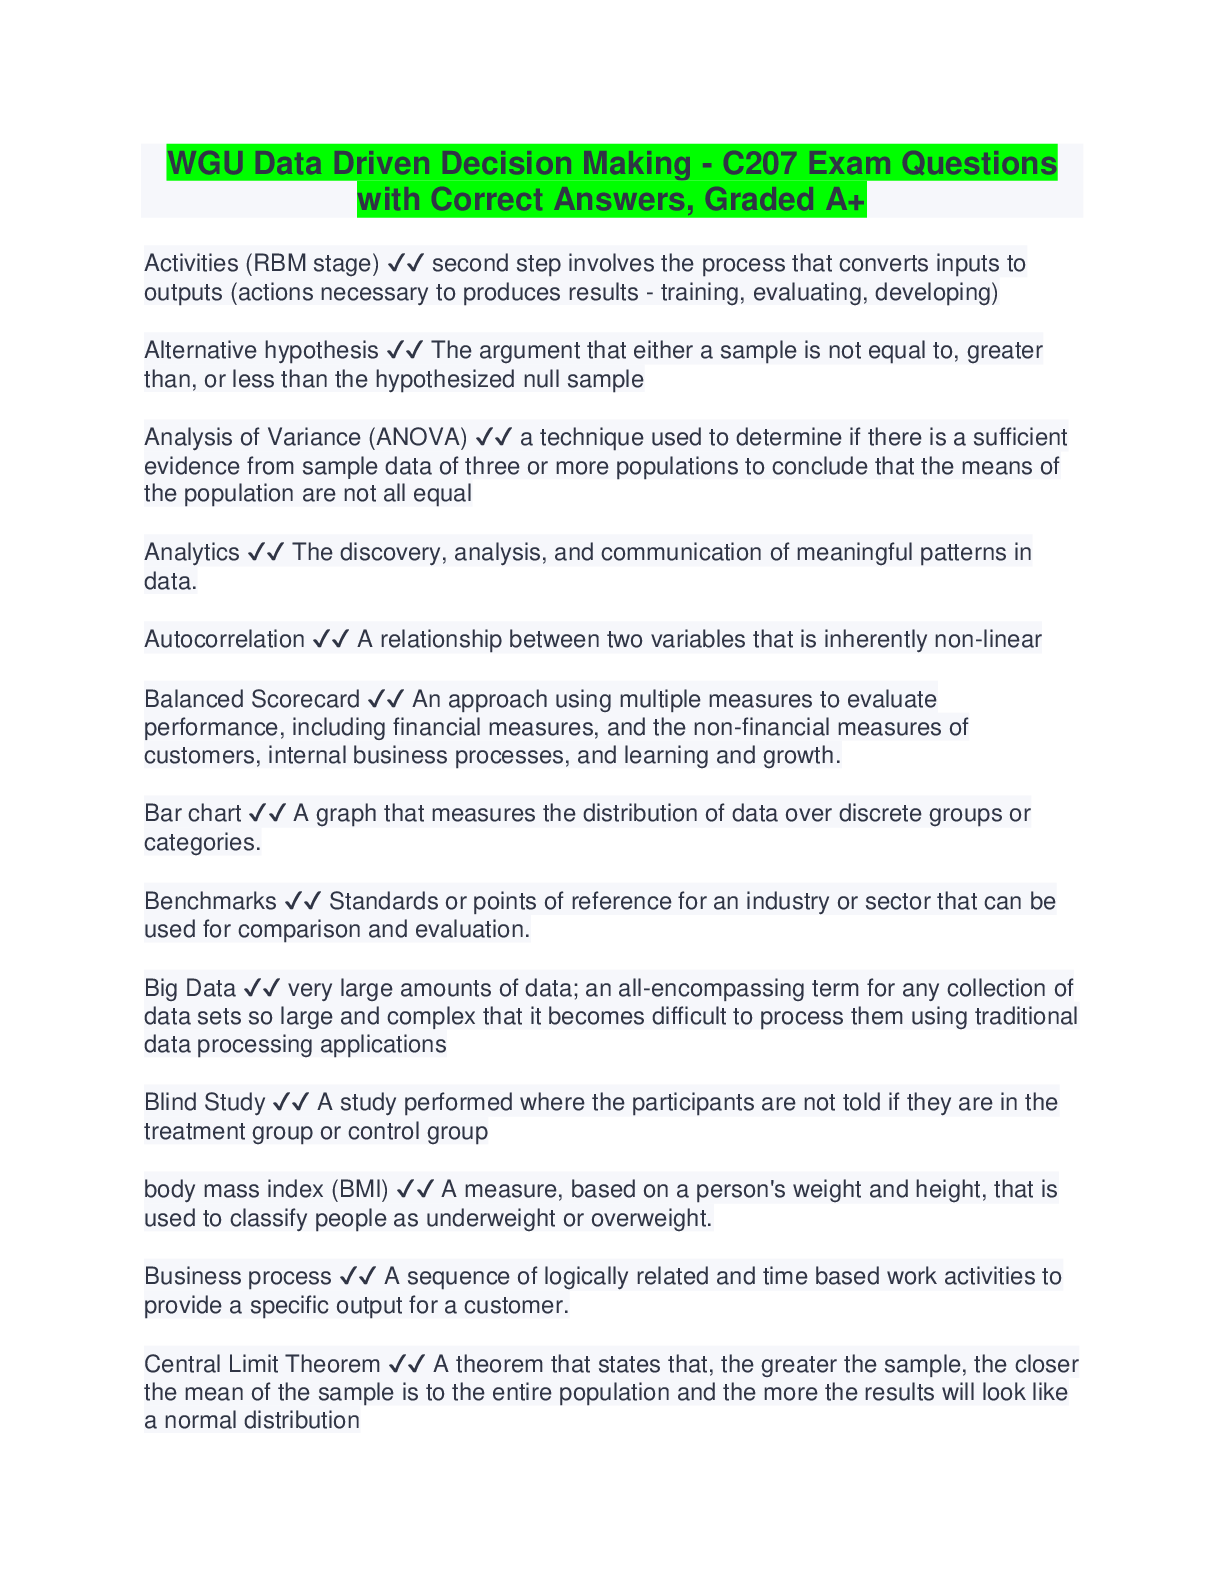
WGU Data Driven Decision Making - C207 Complete Solutions Activities (RBM stage) Ans- second step involves the process that converts inputs to outputs (actions necessary to produces results - trai... ning, evaluating, developing) Alternative hypothesis Ans- The argument that either a sample is not equal to, greater than, or less than the hypothesized null sample Analysis of Variance (ANOVA) Ans- a technique used to determine if there is a sufficient evidence from sample data of three or more populations to conclude that the means of the population are not all equal Analytics Ans- The discovery, analysis, and communication of meaningful patterns in data. Autocorrelation Ans- A relationship between two variables that is inherently non-linear Balanced Scorecard Ans- An approach using multiple measures to evaluate performance, including financial measures, and the non-financial measures of customers, internal business processes, and learning and growth. Bar chart Ans- A graph that measures the distribution of data over discrete groups or categories. Benchmarks Ans- Standards or points of reference for an industry or sector that can be used for comparison and evaluation. Big Data Ans- very large amounts of data; an all-encompassing term for any collection of data sets so large and complex that it becomes difficult to process them using traditional data processing applications Blind Study Ans- A study performed where the participants are not told if they are in the treatment group or control group body mass index (BMI) Ans- A measure, based on a person's weight and height, that is used to classify people as underweight or overweight. Business process Ans- A sequence of logically related and time based work activities to provide a specific output for a customer. Central Limit Theorem Ans- A theorem that states that, the greater the sample, the closer the mean of the sample is to the entire population and the more the results will look like a normal distribution Cluster Analysis Ans- The process of arranging terms or values based on different variables into "natural" groups Cointegration Ans- Occurs when two time series are moving with a common pattern due to a connection between the two time series [Show More]
Last updated: 1 year ago
Preview 1 out of 23 pages
Reviews( 0 )
Document information
Connected school, study & course
About the document
Uploaded On
Feb 11, 2023
Number of pages
23
Written in

Additional information
This document has been written for:
Uploaded
Feb 11, 2023
Downloads
0
Views
63


.png)
.png)
.png)
.png)
.png)
.png)
.png)
.png)
.png)
.png)
.png)
