Geography > QUESTION PAPER (QP) > OCR Oxford Cambridge and RSA Monday 23 May 2022 - Morning GCSE (9—1) Geography B (Geography for En (All)
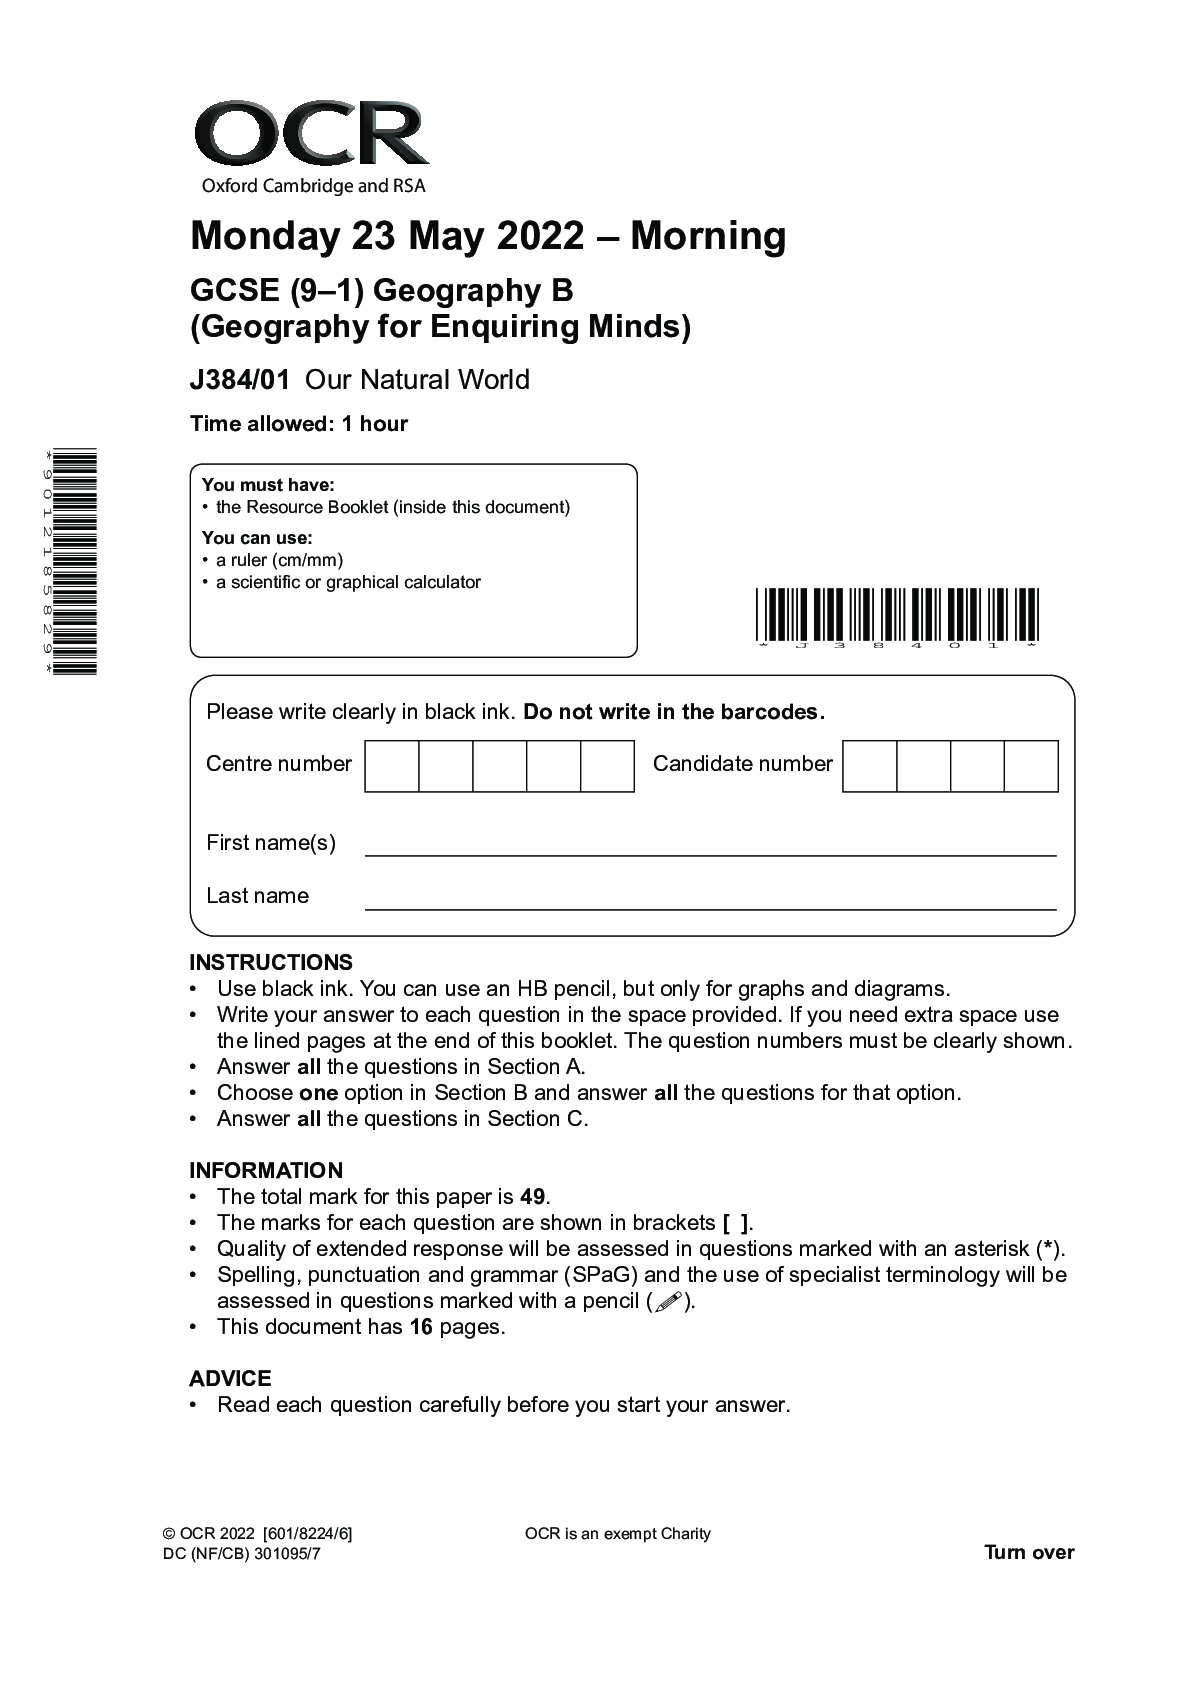
OCR Oxford Cambridge and RSA Monday 23 May 2022 - Morning GCSE (9—1) Geography B (Geography for Enquiring Minds) J384/01 Our Natural World Time allowed: 1 hour
Document Content and Description Below
SECTION A Answer all the questions. Changing Climate 1 (a) Study Fig. 1 in the separate Resource Booklet, which shows global temperature trends over time. (i) Identify the region with the large... st decrease in temperature. ..................................................................................................................................... [1] (ii) What is the most common temperature change shown for the UK? ..................................................................................................................................... [1] (iii) Give one region that experienced a temperature increase of 0.4–0.5 °C. ..................................................................................................................................... [1] (iv) Suggest one change to Fig. 1 to improve it. ..................................................................................................................................... [1] 3 © OCR 2022 Turn over (b) The graph below shows sunspot cycles between 1970 and 2017. 0 100 200 300 Year Sunspot numbers index 1970 1980 1990 2000 2010 2020 (i) In 2000 there were 150 sunspots. Use this information to complete the graph. [2] (ii) Use the graph to identify the average timing of one sunspot cycle. A 1 year B 11 years C 17 years D 20 years Write the correct letter in the box. [1] 4 © OCR 2022 (c) Explain the possible social impacts of climate change within the UK. ................................................................................................................................................... ................................................................................................................................................... ................................................................................................................................................... ................................................................................................................................................... ................................................................................................................................................... ................................................................................................................................................... ................................................................................................................................................... ................................................................................................................................................... ................................................................................................................................................... ................................................................................................................................................... ................................................................................................................................................... ............................................................................................................................................. [6] 5 © OCR 2022 Turn over BLANK PAGE PLEASE DO NOT WRITE ON THIS PAGE Turn over for the next question 6 © OCR 2022 Distinctive Landscapes 2 (a) Over time, waterfalls retreat upstream forming a gorge. The data in the table below gives the amount of retreat of a waterfall over time. Year 2011 2012 2013 2014 2015 2016 2017 2018 2019 2020 Retreat (cm) 6.5 2.0 4.0 0.5 9.0 7.0 4.5 3.0 2.0 10.0 Use the data in the table to calculate the mean rate of retreat of the waterfall over time. Show your working. ............................................ cm / year [2] (b) Explain the formation of a v-shaped valley. ................................................................................................................................................... ................................................................................................................................................... ................................................................................................................................................... ................................................................................................................................................... ................................................................................................................................................... ............................................................................................................................................. [3] 7 © OCR 2022 Turn over (c)* CASE STUDY – the landscape of a UK river basin Name of UK river basin ............................................................................................................ To what extent has management of your chosen river basin been successful? ................................................................................................................................................... ................................................................................................................................................... ................................................................................................................................................... ................................................................................................................................................... ................................................................................................................................................... ................................................................................................................................................... ................................................................................................................................................... ................................................................................................................................................... ................................................................................................................................................... ................................................................................................................................................... ................................................................................................................................................... ................................................................................................................................................... ................................................................................................................................................... ................................................................................................................................................... ................................................................................................................................................... ............................................................................................................................................. [8] ! Spelling, punctuation and grammar and the use of specialist terminology [3] 8 © OCR 2022 SECTION B Choose one option and answer all the questions for that option. Option A – Global Hazards 3 (a) Study the graph below showing the global number of extreme storm events between 1985 and 2015. 1985 100 120 140 160 180 200 220 240 1990 1995 2000 Year Number of extreme storm events 2005 2010 2015 (i) Use the data in the table to complete the graph. Year Number of extreme storm events 2000 182 [1] (ii) Add a trend line to the graph. [1] (iii) Identify the correct description of the relationship shown by the graph. A negative correlation B no correlation C strong positive correlation D weak positive correlation Write the correct letter in the box. [1] (iv) Identify the lowest number of global extreme events to occur in one year between 1995 and 2000. ..................................................................................................................................... [1] 9 © OCR 2022 Turn over (b) Explain one way in which global atmospheric circulation creates a climatic zone. ................................................................................................................................................... ................................................................................................................................................... ................................................................................................................................................... ................................................................................................................................................... ................................................................................................................................................... ............................................................................................................................................. [3] (c) CASE STUDY – a tectonic event that has been hazardous for people. Name of tectonic event ............................................................................................................. Assess the causes of the tectonic event. ................................................................................................................................................... ................................................................................................................................................... ................................................................................................................................................... ................................................................................................................................................... ................................................................................................................................................... ................................................................................................................................................... ................................................................................................................................................... ................................................................................................................................................... ................................................................................................................................................... ................................................................................................................................................... ................................................................................................................................................... ................................................................................................................................................... ................................................................................................................................................... ............................................................................................................................................. [6] 10 © OCR 2022 Option B – Sustaining Ecosystems 4 (a) Study Fig. 2 in the separate Resource Booklet, which shows the Trans-Alaska oil pipeline in North America. Using Fig. 2, identify one environmental impact of resource extraction in Arctic Polar regions. ................................................................................................................................................... ............................................................................................................................................. [1] (b) Study Fig. 3 in the separate Resource Booklet, which shows a climate graph for a polar region location. (i) Select the correct temperature range shown on the graph. A –31 °C B 3 °C C 34 °C D 68 °C Write the correct letter in the box. [1] (ii) Calculate the total annual precipitation for this p [Show More]
Last updated: 1 year ago
Preview 1 out of 16 pages
Instant download
Buy this document to get the full access instantly
Instant Download Access after purchase
Add to cartInstant download
Reviews( 0 )
Document information
Connected school, study & course
About the document
Uploaded On
Apr 02, 2023
Number of pages
16
Written in
Additional information
This document has been written for:
Uploaded
Apr 02, 2023
Downloads
0
Views
90

