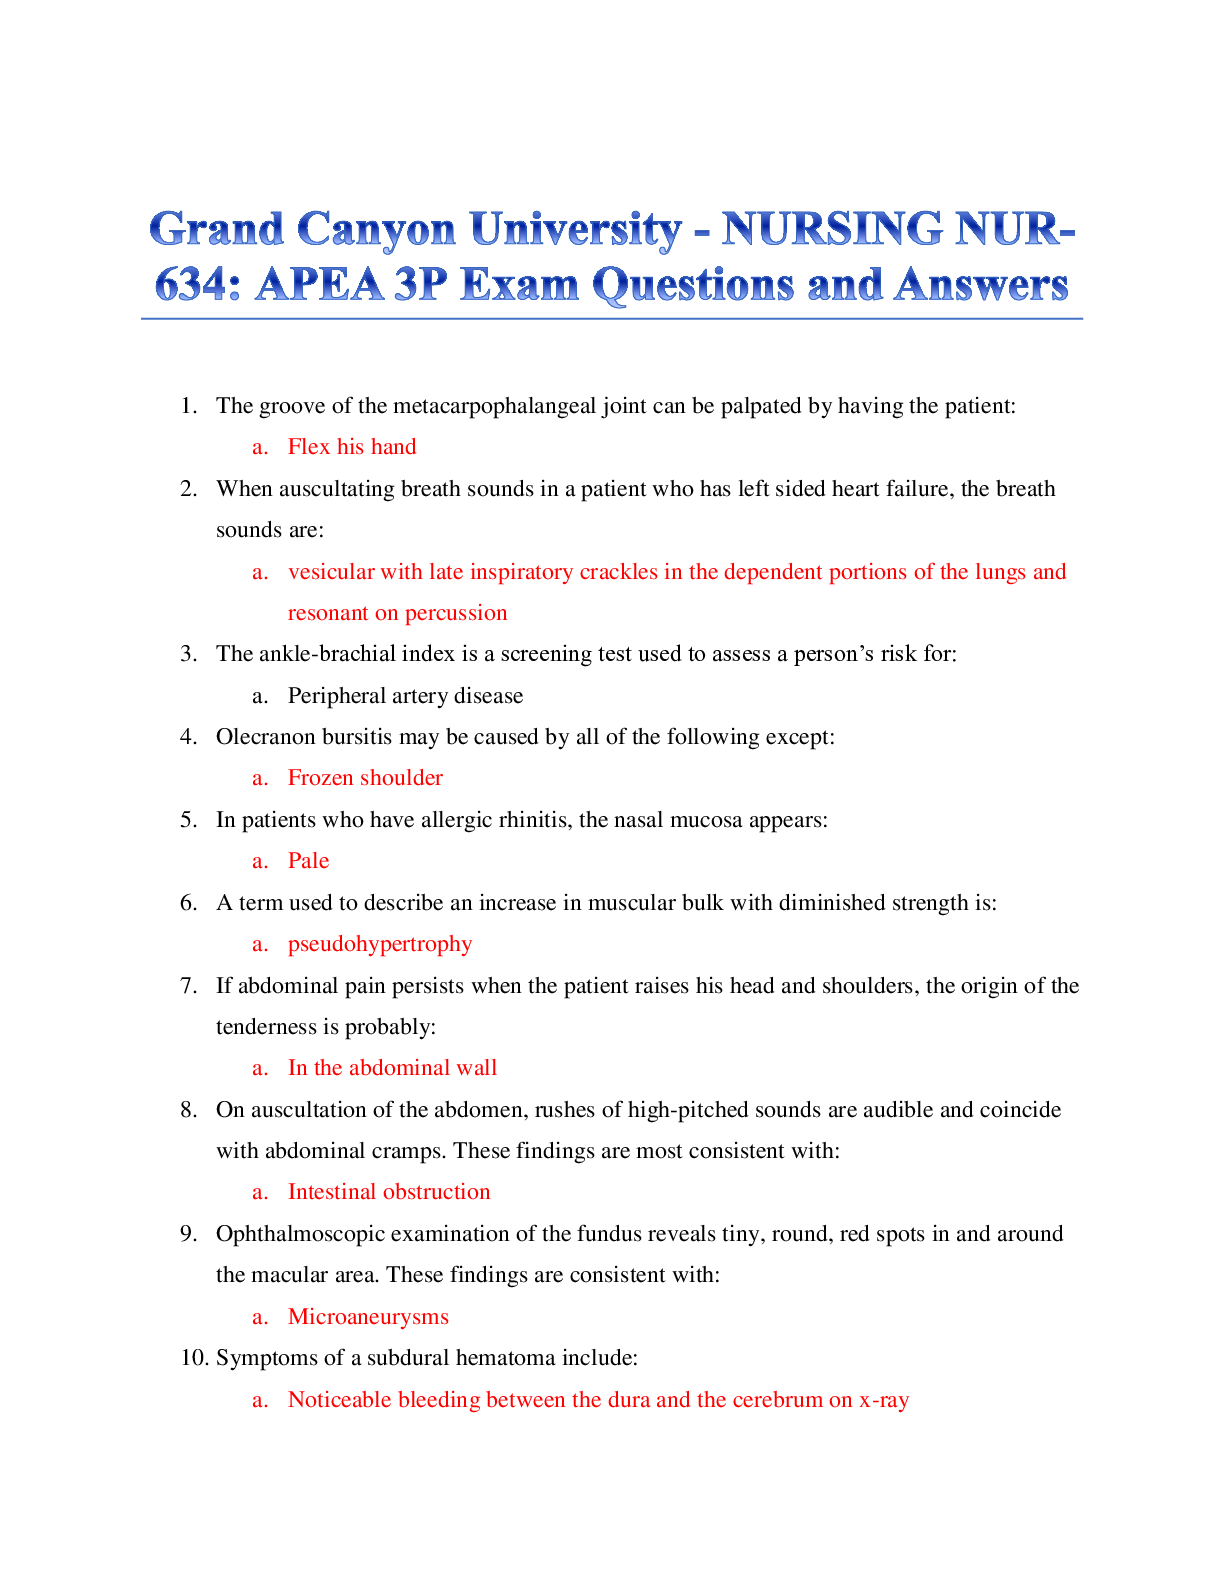
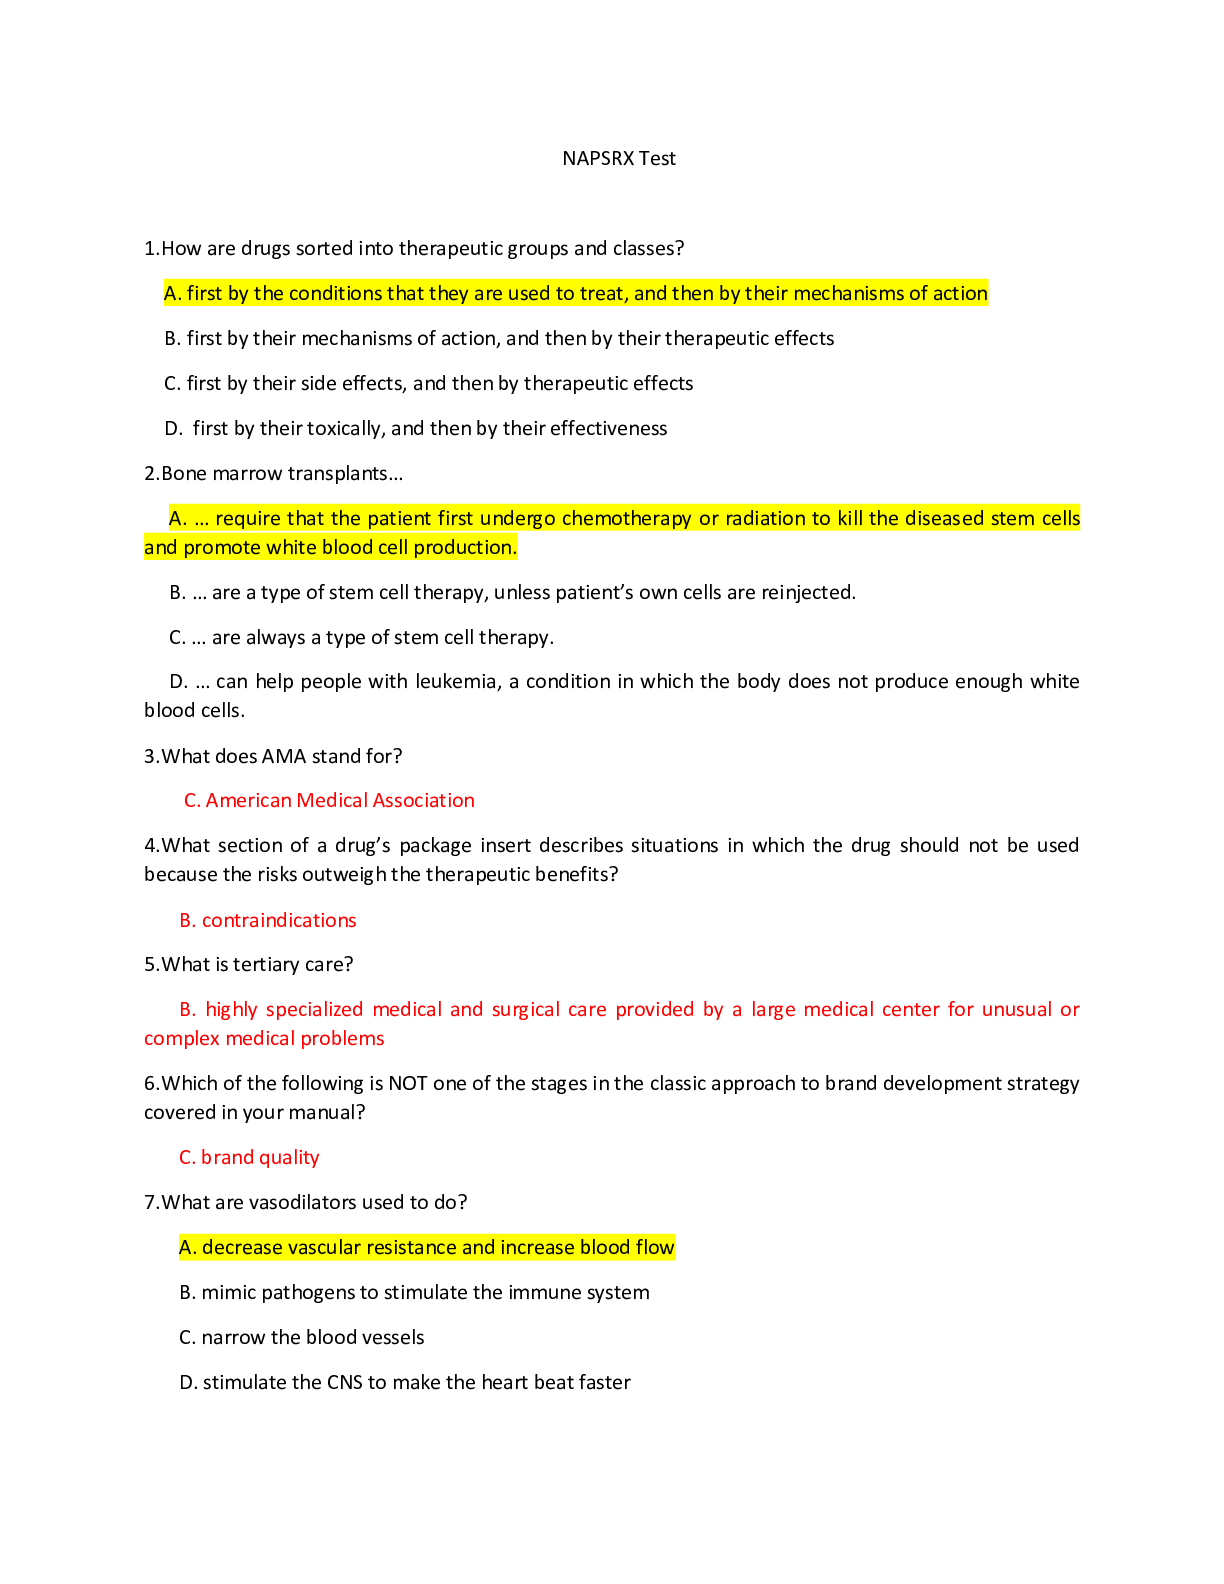
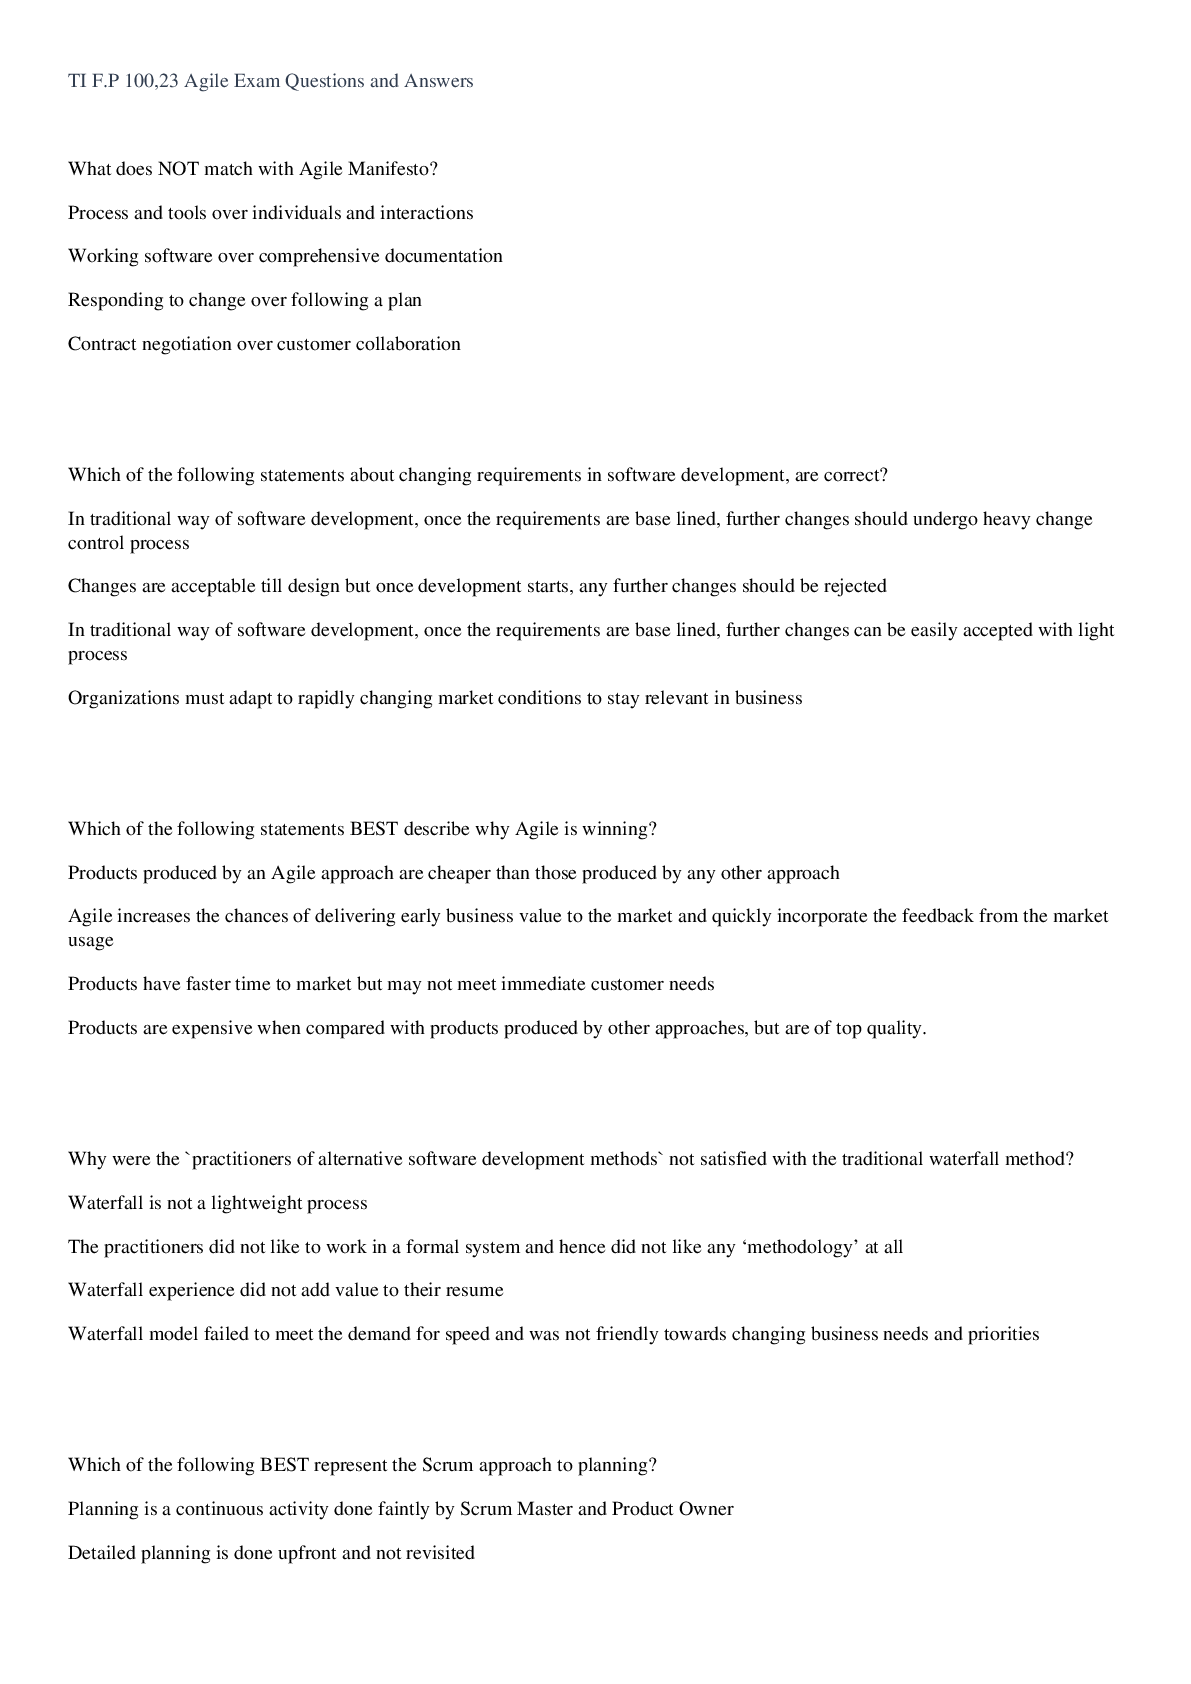
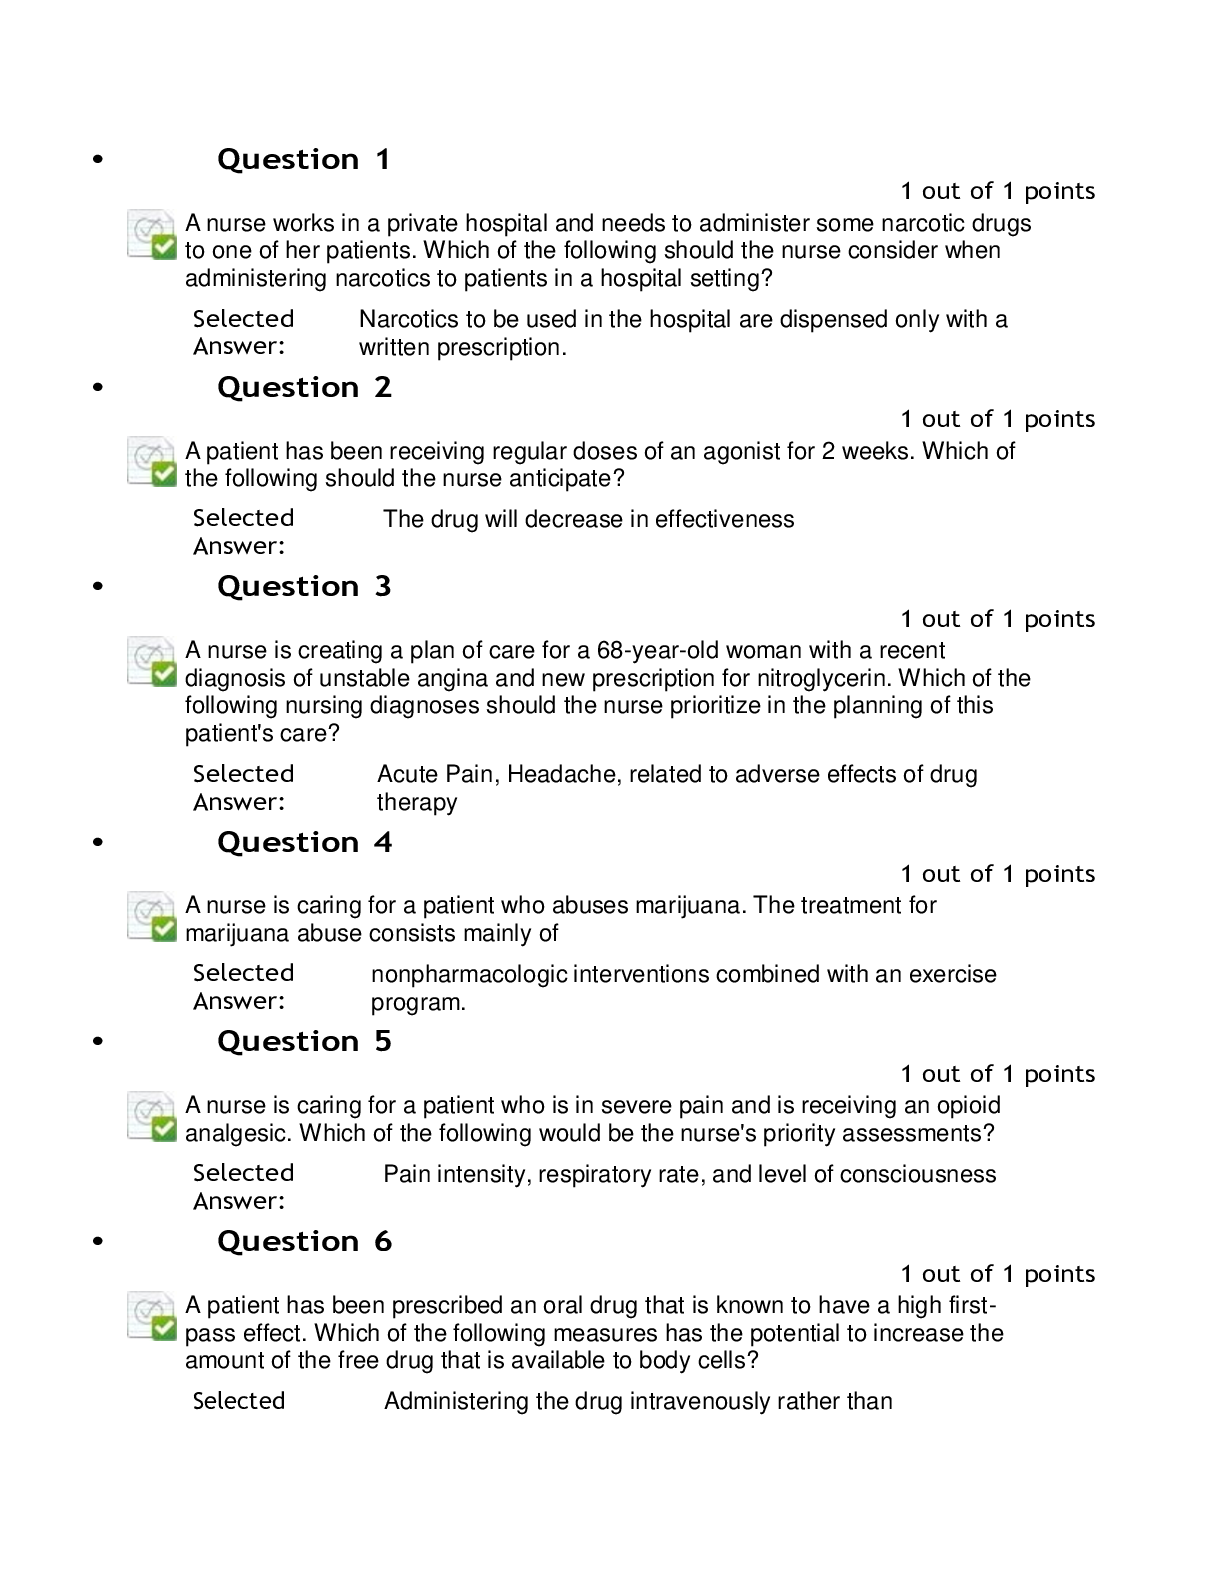
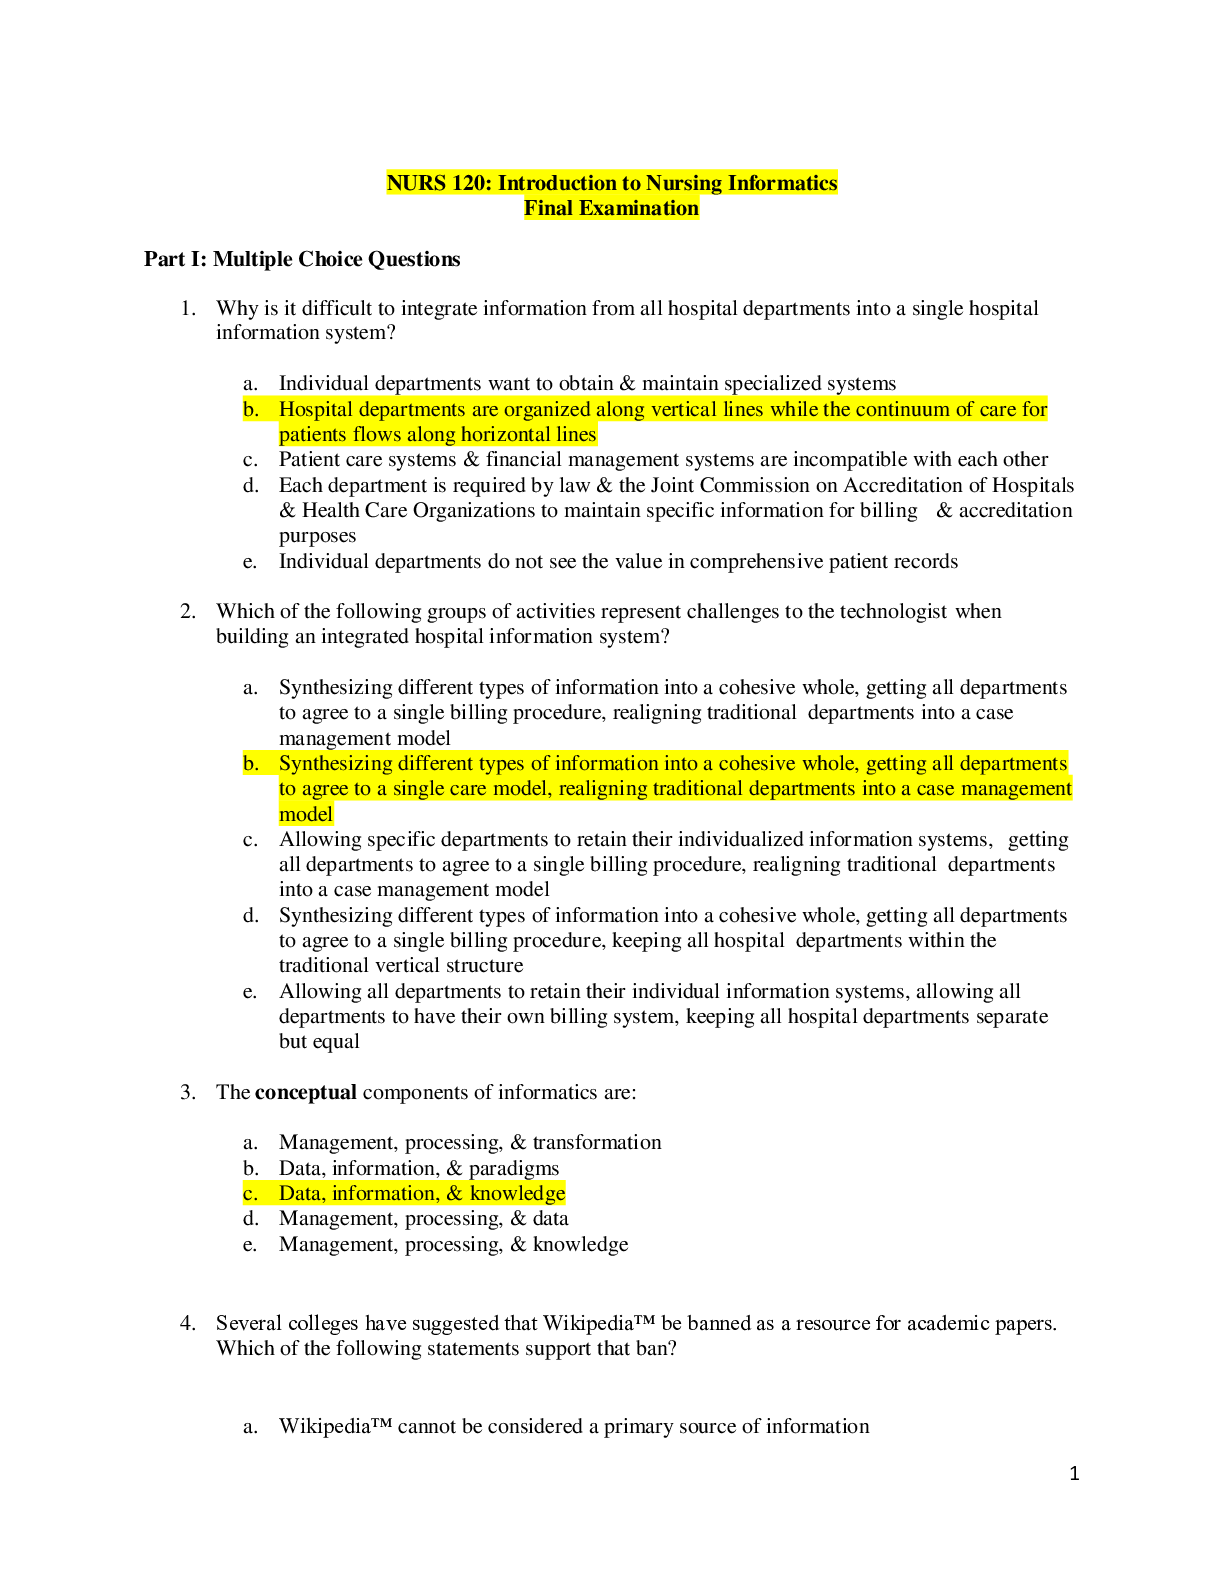
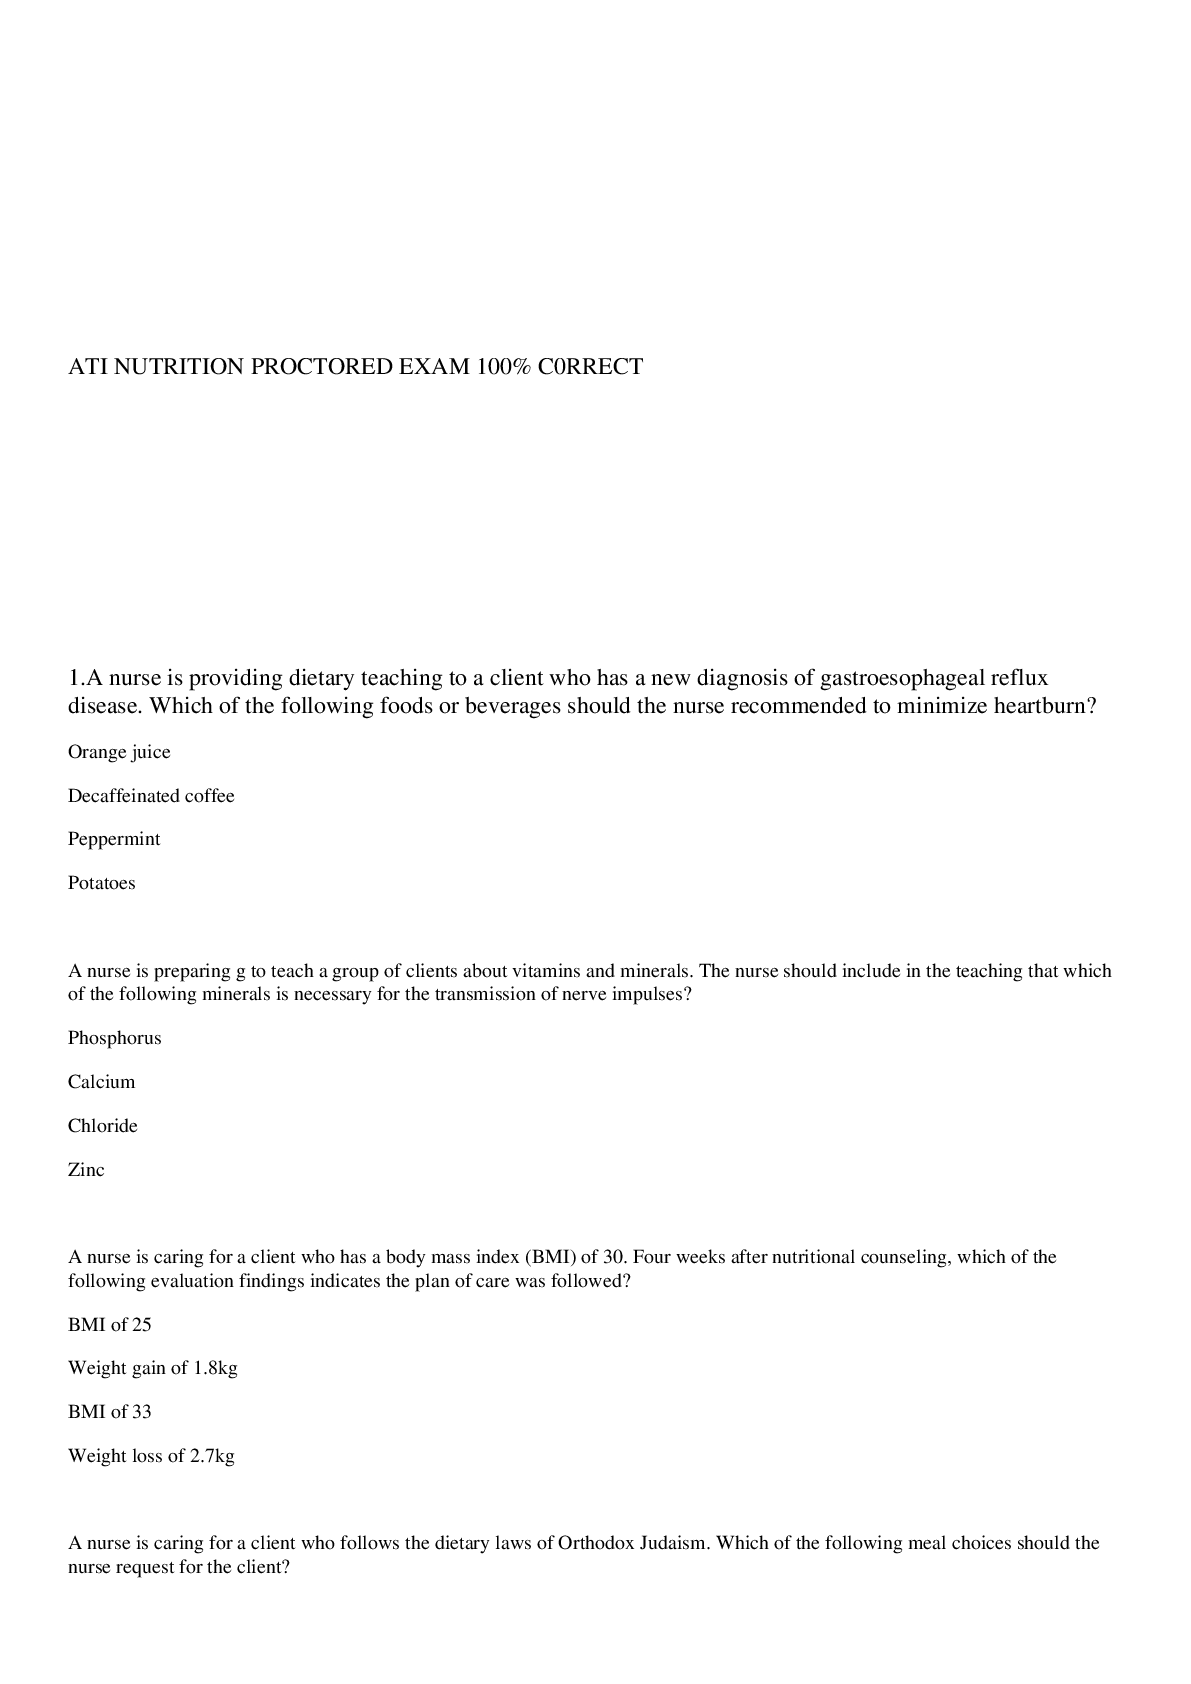
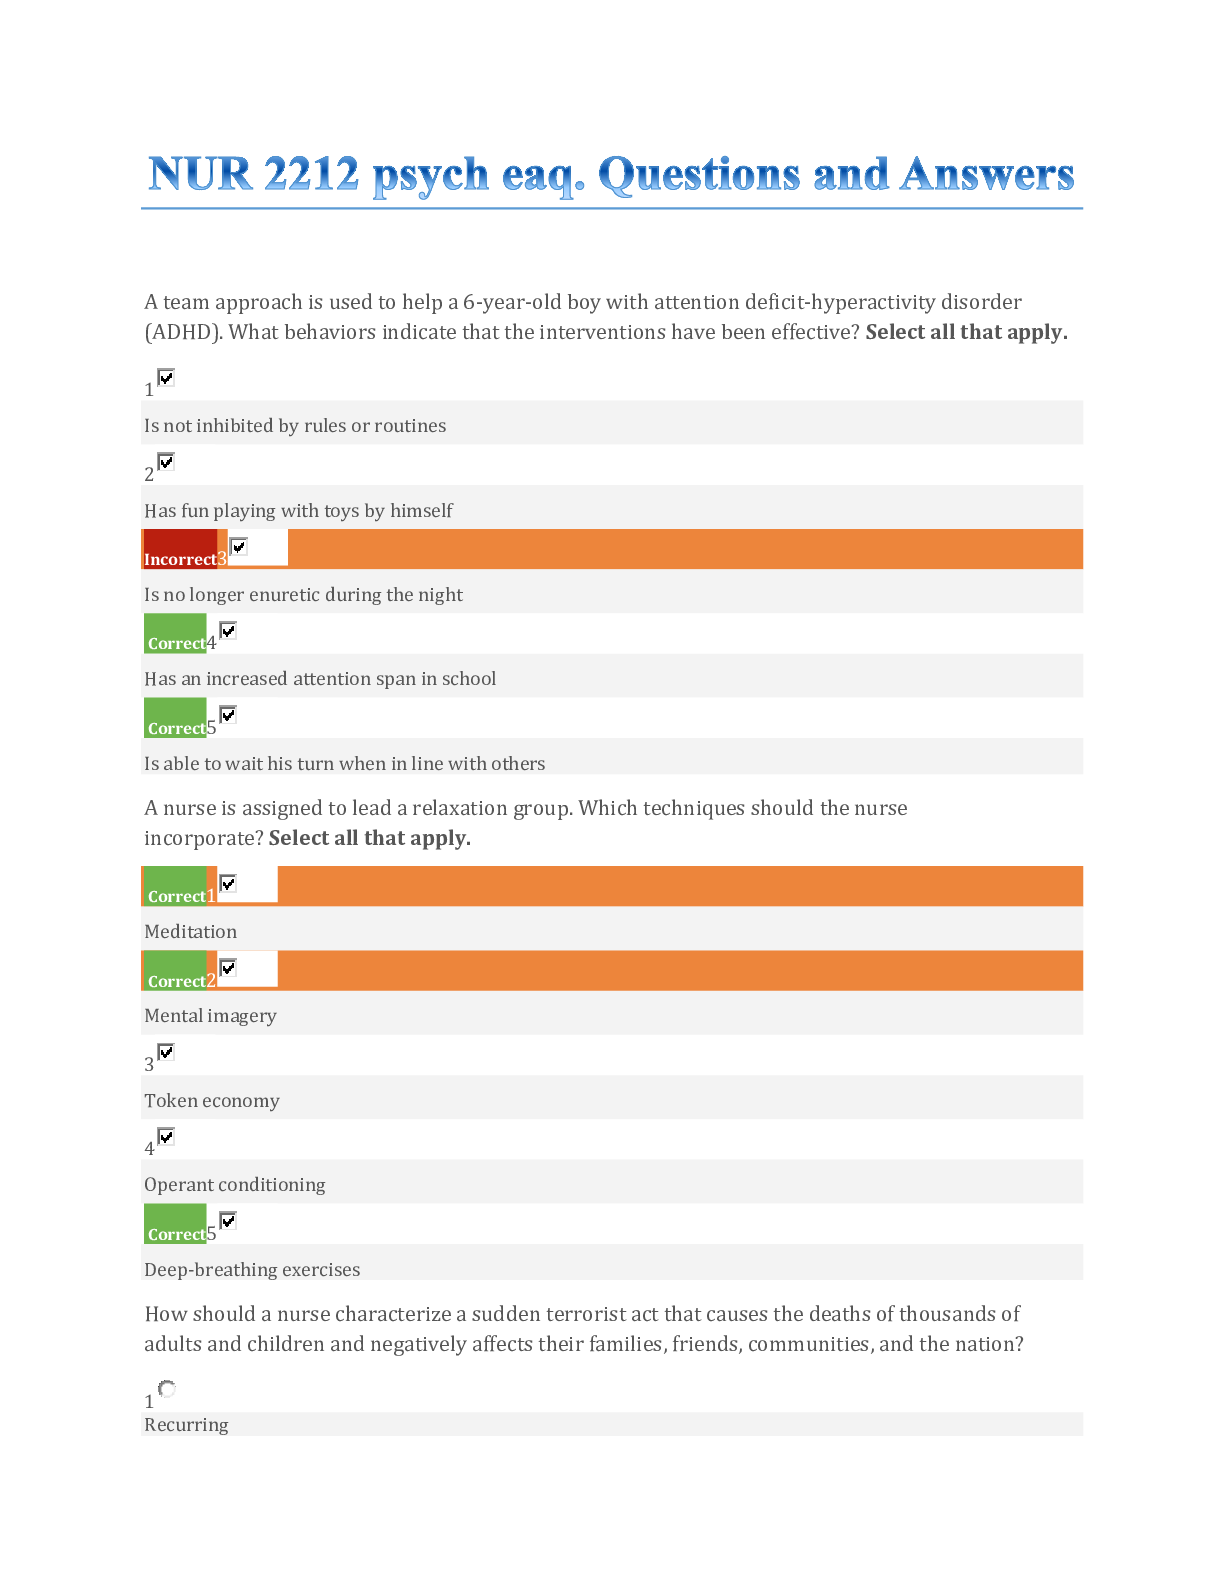
Mathematics > EXAM > MATH 225N Week 7 Hypothesis Testing (Summer 2022/2023) Questions and Answers. (All)
MATH 225N Week 7 Hypothesis Testing (Summer 2022/2023) Questions and Answers.
Document Content and Description Below
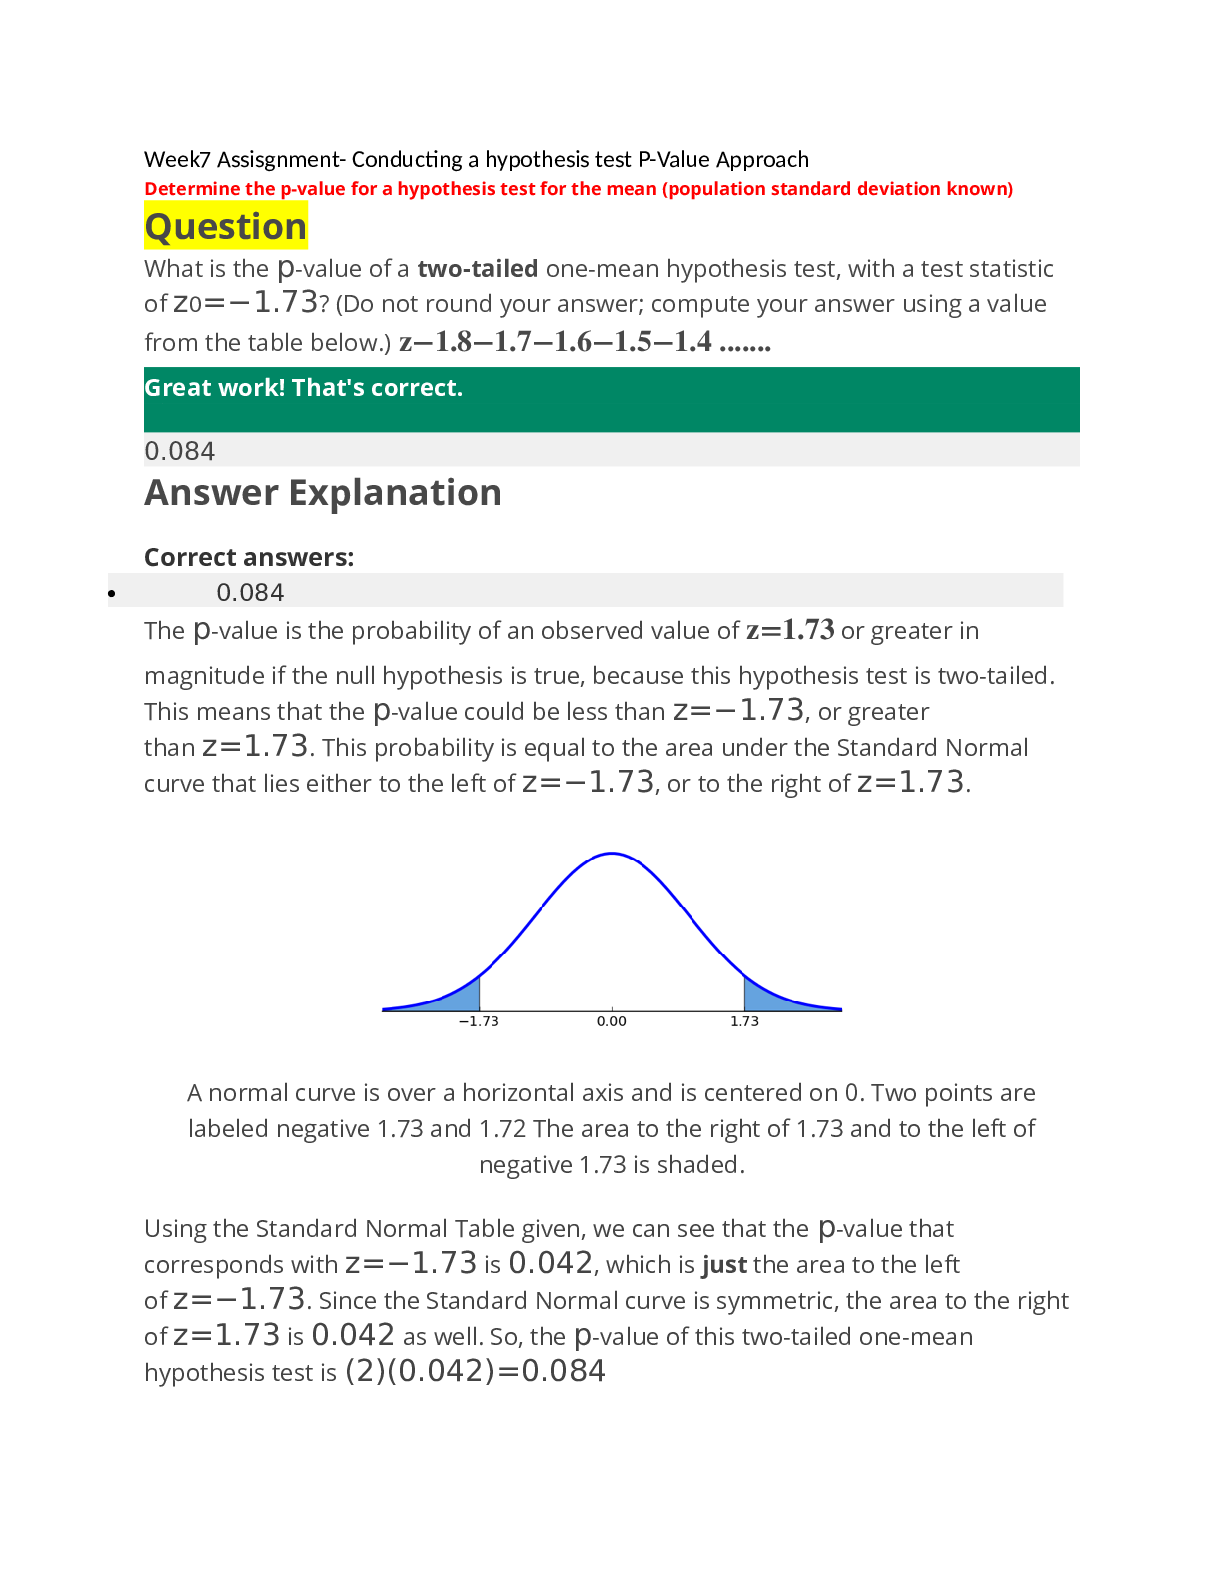
MATH 225N Week 7 Hypothesis Testing Questions and Answers MATH 225N Week 7 Hypothesis Testing Questions and Answers Steve listens to his favorite streaming music service when he works out. He wonders ... whether the service algorithm does a good job of finding random songs that he will like more often than not. To test this, he listens to 50 songs chosen by the service at random and finds that he likes 32 of them. A magazine regularly tested products and gave the reviews to its customers. In one of its reviews, it tested 2 types of batteries and claimed that the batteries from company A outperformed batteries from company B in 108 of the tests. There were 200 tests. Company B decided to sue the magazine, claiming that the results were not significantly different from 50% and that the magazine was slandering its good name. A candidate in an election lost by 5.8% of the vote. The candidate sued the state and said that more than 5.8% of the ballots were defective and not counted by the voting machine, so a full recount would need to be done. His opponent wanted to ask for the case to be dismissed, so she had a government official from the state randomly select 500 ballots and count how many were defective. The official found 21 defective ballots. A researcher claims that the incidence of a certain type of cancer is < 5%. To test this claim, a random sample of 4000 people are checked and 170 are found to have the cancer. A researcher is investigating a government claim that the unemployment rate is < 5%. TO test this claim, a random sample of 1500 people is taken and it is determined that 61 people were unemployed. An economist claims that the proportion of people that plan to purchase a fully electric vehicle as their next car is greater than 65%. Colton makes the claim to his classmates that < 50% of newborn babies born this year in his state are boys. To prove this claim, he selects a random sample of 344 birth records in his state from this year. Colton found that 176 of the newborns were boys. What are the null and alternative hypothesis for this hypothesis test. An Airline company claims that in its recent advertisement that at least 94% of passenger luggage that is lost is recovered and reunited with their customer within 1 day. Hunter is a graduate student studying statistics. For a research project, Hunter wants to find out whether there is sufficient evidence in support of the airline company’s claim. He randomly selects 315 passengers whose luggage was lost by the airlines and found out that 276 of those passengers were reunited with their luggage within 1 day. Are all of the conditions for his hypotheses test met, and if so, what are the Ho and Ha for this hypothesis test? A college administrator claims that the proportion of students who are nursing majors is > 40%. To test this claim, a group of 400 students are randomly selected and its determined that 190 are nursing majors. The following is the set up for the hypothesis test: Ho: p = .40 and Ha: p = >.40 A hospital administrator claims that the proportion of knee surgeries that are successful are 87%. To test this claim, a random sample of 450 patients who underwent knee surgery is taken and it is determined that 371 patients had a successful knee surgery operation. Ho: p = 0.87 Ha: p ≠0.87 (two sided tail) Jose, a competitor in cup stacking, has a sample stacking time mean of 7.5 seconds from 13 trials. Jose still claims that his average stacking time is 8.5 seconds, and the low average can be contributed to chance. At the 2% significant level, does the data provide sufficient evidence to conclude that Jose’s mean stacking time is less than 8.5 seconds? Given the sample data below, select or reject the hypothesis. (If p=value is < alpha value, we would automatically reject the hypothesis) Marty, a typist, claims his average typing speed is 72 wpm. During a practice session, Marty has a sample typing speed mean of 84 wpm based on 12 trials. At the 5% significance level, does the data provide sufficient evidence to conclude that his mean typing speed is >72 wpm? Accept or reject the hypothesis given the data below. What is the p-value of a right-tailed one mean hypothesis test, with a test statistic of Zo = 2.1? (Do not round your answer. Compute your answer using a value from the table. (Value in table was 0.982) What is the p-value of a two-tailed one mean hypothesis test, with a test statistic of Zo = 0.27? (Do not round your answer. Compute your answer using a value from the table. (Value in table was 0.606) Raymond, a typist, claims his average typing speed is 89 wmp. During a practice session, Raymond has a sample typing speed mean of 95.5 wmp based on 15 trials. At the 1% significance level, does the data provide sufficient evidence to conclude that his mean typing speed is > 89 wmp? Accept or reject the hypothesis given the sample data below: Kurtis is a statistician who claims that the average salary of an employee in the city of Yarmouth is no more than $55,000 per year. Gina, his colleague, believes this to be incorrect, so she randomly selects 61 employees who work in Yarmouth and record their annual salary. Gina calculates the sample mean income to be $56.500 per year with a sample standard deviation of $3750. Using the alternative hypothesis, Ha = μ= >$55,000, find the test statistic τ and the p-value for the appropriate hypothesis test. Round the τ to 2 decimal places and the p-value to 3 decimal places. A college administrator claims that the proportion of students that are nursing majors is less than 40%. To test this claim, a group of 400 students are randomly selected and its determined that 149 are nursing majors. A researcher claims that the incidence of a certain type of cancer is less than 5%. To test this claim, the a random sample of 4000 people are checked and 170 are determined to have the cancer. A police office claims that the proportion of people wearing seat belts is less than 65%. To test this claim, a random sample of 200 drivers is taken and its determined that 126 people are wearing seat belts. A police officer claims that the proportion of accidents that occur in the daytime (versus nighttime) at a certain intersection is 35%. To test this claim, a random sample of 500 accidents at this intersection was examined from police records it is determined that 156 accidents occurred in the daytime. A teacher claims that the proportion of students expected to pass an exam is greater than 80%. To test this claim, the teacher administers the test to 200 random students and determines that 151 students pass the exam. A researcher claims that the proportion of smokers in a certain city is less than 20%. To test this claim, a random sample of 700 people is taken in the city and 150 people indicate they are smokers. A researcher claims that the proportion of people who are right-handed is 70%. To test this claim, a random sample of 600 people is taken and its determined that 397 people are right handed. Kathryn, a golfer, has a sample driving distance mean of 187.3 yards from 13 drives. Kathryn still claims that her average driving distance is 207 yards, and the low average can be attributed to chance. At the 1% significance level, does the data provide sufficient evidence to conclude that Kathryn's mean driving distance is less than 207 yards? Given the sample data below, accept or reject the hypothesis. Mary, a javelin thrower, claims that her average throw is 61 meters. During a practice session, Mary has a sample throw mean of 55.5 meters based on 12 throws. At the 1% significance level, does the data provide sufficient evidence to conclude that Mary's mean throw is less than 61 meters? Accept or reject the hypothesis given the sample data below. Elizabeth claims that her average typing speed is at least 87 words per minute Shawn, a competitor in cup stacking, has a sample stacking time mean of 9.2 seconds from 13 trials. Shawn still claims that her average stacking time is 8.5 seconds, and the high average can be attributed to chance. At the 4% significance level, does the data provide sufficient evidence to conclude that Shawn's mean stacking time is greater than 8.5 seconds? Given the sample data below, accept or reject the hypothesis. Ruby, a bowler, has a sample game score mean of 125.8 from 25 games. Ruby still claims that her average game score is 140, and the low average can be attributed to chance. At the 5% significance level, does the data provide sufficient evidence to conclude that Ruby's mean game score is less than 140? Given the sample data below, accept or reject the hypothesis. Timothy, a bowler, has a sample game score mean of 202.1 from 11 games. Timothy still claims that his average game score is 182, and the high average can be attributed to chance. At the 5% significance level, does the data provide sufficient evidence to conclude that Timothy's mean game score is greater than 182? Given the sample data below, accept or reject the hypothesis. What is the p-value of a two-tailed one-mean hypothesis test, with a test statistic of z0=−1.59? (Do not round your answer; compute your answer using a value from the table below.) 31. What is the p-value of a right-tailed one-mean hypothesis test, with a test statistic of z0=2.05? (Do not round your answer; compute your answer using a value from the table below.) The number on the table was .980 What is the p-value of a left-tailed one-mean hypothesis test, with a test statistic of z0=−1.19? What is the p-value of a left-tailed one-mean hypothesis test, with a test statistic of z0=−0.65? (Do not round your answer; compute your answer using a value from the table below. What is the p-value of a right-tailed one-mean hypothesis test, with a test statistic of z0=0.36? (Do not round your answer; compute your answer using a value from the table below.) What is the p-value of a right-tailed one-mean hypothesis test, with a test statistic of z0=1.82? (Do not round your answer; compute your answer using a value from the table below.) Number in table was 0.966. So 1-.966 = 0.034 What is the p-value of a two-tailed one-mean hypothesis test, with a test statistic of z0=−1.73? (Do not round your answer; compute your answer using a value from the table below.) Table # was 0.042 so 0.042 * 2 = 0.084 A CEO wondered if her company received either more or less complaints from its workers on Monday than any other day. She figured that if it were truly random, 20% of the complaints should have been filed on Monday. She randomly selected 50 complaints and checked the day that they were submitted. In those complaints 13 were submitted on a Monday. 37. A CEO wondered if her company received either more or less complaints from its workers on Monday than any other day. She figured that if it were truly random, 20% of the complaints should have been filed on Monday. She randomly selected 50 complaints and checked the day that they were submitted. In those complaints 13 were submitted on a Monday. The CEO conducts a one-proportion hypothesis test at the 5% significance level, to test whether the true proportion of complaints submitted on a Monday is different from 20%. A CEO wondered if her company received either more or less complaints from its workers on Monday than any other day. She figured that if it were truly random, 20% of the complaints should have been filed on Monday. She randomly selected 50 complaints and checked the day that they were submitted. In those complaints 13 were submitted on a Monday. A business owner claims that the proportion of take out orders is greater than 25%. To test this claim, the owner checks the next 250 orders and determines that 60 orders are take out orders. The following is the setup for this hypothesis test: {H0:p=0.25Ha:p>0.25 Find the test statistic for this hypothesis test for a proportion. Round your answer to 2 decimal places. Colton makes the claim to his classmates that less than 50% of newborn babies born this year in his state are boys. To prove this claim, he selects a random sample of 344 birth records in his state from this year. Colton found that 176 of the newborns are boys. What are the null and alternative hypotheses for this hypothesis test? ________________________________________ Kylie works for a large nursery and is investigating whether to use a new brand of seeds. The new brand of seeds advertises that 93% of the seeds germinate, which is higher than the germination rate of the seeds she is currently using. She will change over to this new brand unless the actual germination rate is less than what is advertised. Kylie conducts an experiment by randomly selecting 76 seeds of the new brand and plants them. She finds that 70 of those seeds germinated. What are the null and alternative hypotheses for this hypothesis test? ________________________________________ The owners of a supermarket chain are looking into the effectiveness of the supermarket's loyalty card program. Specifically, they would like to know if the percentage of shoppers in their stores who use the loyalty card has changed from 63% in 2014. Chloe works in the marketing department of the chain and is assigned to answer the owners' inquiry. She randomly selects 196 customers from various stores in the chain and finds that 114 use the loyalty card. What are the null and alternative hypotheses for this hypothesis test? Select the correct answer below: H0:p=0.63 Ha:p>0.63 H0:p=0.63 Ha:p<0.63 H0:p≠0.63 Ha:p=0.63 H0:p=0.63 Ha:p≠0.63 A researcher claims that the proportion of college students who plan to participate in community service after graduation is greater than 35%. To test this claim, a survey asked 500 randomly selected college students if they planned to perform community service after graduation. Of those students, 195 indicated they planned to perform community service. The following is the setup for the hypothesis test: H0:p=0.35 Ha:p>0.35 Find the test statistic for this hypothesis test for a proportion. Round your answer to 2 decimal places. A researcher claims that the proportion of people over 65 years of age in a certain city is greater than 11%. To test this claim, a sample of 1000 people are taken and its determine that 126 people are over 65 years of age. The following is the setup for this hypothesis test: Find the test statistic for this hypothesis test for a proportion. Round your answer to 2 decimal places. Rosetta, a pitcher, claims that her pitch speed is more than 57 miles per hour, on average. Several of her teammates do not believe her, so she decides to do a hypothesis test, at a 1% significance level, to persuade them. She throws 10 pitches. The mean speed of the sample pitches is 64 miles per hour. Rosetta knows from experience that the standard deviation for her pitch speed is 4 miles per hour. What is the test statistic (z-score) of this one-mean hypothesis test, rounded to two decimal places? ________________________________________ Which of the following results in a null hypothesis p≤0.61 and alternative hypothesis p>0.61? Select the correct answer below: A study says that at least 61% of students study less than 5 hours per week. A researcher thinks this is incorrect, and wants to show that fewer than 61% of students study less than 5 hours per week. A study says that more than 61% of students study less than 5 hours per week. A researcher thinks this is incorrect, and wants to show that at least 61% of students study less than 5 hours per week. A study says that at most 61% of students study less than 5 hours per week. A researcher thinks this is incorrect, and wants to show that more than 61% of students study less than 5 hours per week. A study says that less than 61% of students study less than 5 hours per week. A researcher thinks this is incorrect, and wants to show that more than 61% of students study less than 5 hours per week. Suppose the null hypothesis, H0, is: a weightlifting bar can withstand weights of 800 pounds and less. What is α, the probability of a Type I error in this scenario? the probability that you think the weightlifting bar can withstand weights of 800 pounds and less when, in fact, it cannot the probability that you think the weightlifting bar can withstand weights of 800 pounds and less when, in fact, it can the probability that you think the weightlifting bar cannot withstand weights of 800 pounds and less when, in fact, it can the probability that you think the weightlifting bar cannot withstand weights of 800 pounds and less when, in fact, it cannot Suppose a pitcher claims that his pitch speed is less than 43 miles per hour, on average. Several of his teammates do not believe him, so the pitcher decides to do a hypothesis test, at a 10% significance level, to persuade them. He throws 19pitches. The mean speed of the sample pitches is 35 miles per hour. The pitcher knows from experience that the standard deviation for his pitch speed is 6 miles per hour. Which graph below corresponds to the following hypothesis test? H0:X≤10.7, Ha:X>10.7 Suppose the null hypothesis, H0, is: a sporting goods store claims that at least 70% of its customers do not shop at any other sporting goods stores. What is the Type I error in this scenario? Select the correct answer below: The sporting goods store thinks that less than 70% of its customers do not shop at any other sporting goods stores when, in fact, less than 70% of its customers do not shop at any other sporting goods stores. The sporting goods store thinks that at least 70% of its customers do not shop at any other sporting goods stores when, in fact, at least 70% of its customers do not shop at any other sporting goods stores. The sporting goods store thinks that less than 70% of its customers do not shop at any other sporting goods stores when, in fact, at least 70% of its customers do not shop at any other sporting goods stores. The sporting goods store thinks that at least 70% of its customers do not shop at any other sporting goods stores when, in fact, less than 70% of its customers do not shop at any other sporting goods store Which of the following results in a null hypothesis p≥0.44 and alternative hypothesis p<0.44? An online article is trying to show that less than 44% of internet users participate in social media, contrary to an established figure saying that at least 44% of internet users participate in social media. Which graph below corresponds to the following hypothesis test? Select the correct answer below: Determine the Type I error if the null hypothesis, H0, is: an electrician claims that no more than 10% of homes in the city are not up to the current electric codes. ________________________________________ Select the correct answer below: ________________________________________ The electrician thinks that no more than 10% of homes in the city are not up to the current electrical codes when, in fact, there really are no more than 10% that are not up to the current electric codes. The electrician thinks that more than 10% of the homes in the city are not up to the current electrical codes when, in fact, there really are more than 10% of the homes that do not meet the current electric codes. The electrician thinks that more than 10% of the homes in the city are not up to the current electrical codes when, in fact, at most 10% of the homes in the city are not up to the current electric codes. The electrician thinks that no more than 10% of homes in the city are not up to the current electrical codes when, in fact, more than 10% of the homes are not up to the current electric codes. Suppose the null hypothesis, H0, is: the mean age of the horses on a ranch is 6 years. What is the Type I error in this scenario? ________________________________________ Select the correct answer below: ________________________________________ You think the mean age of the horses on a ranch is 6 years when, in fact, it is. You think the mean age of the horses on a ranch is 6 years when, in fact, it is not. You think the mean age of the horses is not 6 years when, in fact, it is. You think the mean age of the horses is not 6 years when, in fact, it is not. What is β, the probability of a Type II error if the null hypothesis, H0, is: an electrician claims that no more than 10% of homes in the city are not up to the current electric codes. ________________________________________ Select the correct answer below: ________________________________________ the probability that the electrician thinks that no more than 10% of homes in the city are not up to the current electrical codes when, in fact, there really are no more than 10% that are not up to the current electric codes the probability that the electrician thinks that more than 10% of the homes in the city are not up to the current electrical codes when, in fact, there really are more than 10% of the homes that do not meet the current electric codes the probability that the electrician thinks that more than 10% of the homes in the city are not up to the current electrical codes when, in fact, at most 10% of the homes in the city are not up to the current electric codes the probability that the electrician thinks that no more than 10% of homes in the city are not up to the current electrical codes when, in fact, more than 10% of the homes are not up to the current electric codes A consumer protection company is testing a towel rack to see how much force it can hold. The null hypothesis, H0, is that the rack can hold at least 100 pounds of force. The alternative hypothesis, Ha, is that the rack can hold less than 100pounds of force. What is a Type I error in this scenario? ________________________________________ Select the correct answer below: ________________________________________ The researchers conclude that the rack holds at least 100 pounds of force, but the rack actually holds less than 100 pounds. The researchers conclude that the rack holds less than 100 pounds of force, but the rack actually holds more than 100 pounds. The researchers conclude that the rack holds less than 100 pounds of force, and the rack actually holds less than 100 pounds. The researchers conclude that the rack holds more than 100 pounds of force, and the rack actually holds more than 100 pounds. Suppose the null hypothesis, H0, is: the mean age of the horses on a ranch is 6 years. What is the Type II error in this scenario? You think the mean age of the horses on a ranch is 6 years when, in fact, it is. You think the mean age of the horses on a ranch is 6 years when, in fact, it is not. You think the mean age of the horses is not 6 years when, in fact, it is. You think the mean age of the horses is not 6 years when, in fact, it is not. Determine the Type I error if the null hypothesis, H0, is: a wooden ladder can withstand weights of 250 pounds and less. ________________________________________ Select the correct answer below: ________________________________________ You think the ladder can withstand weight of 250 pounds and less when, in fact, it cannot. You think the ladder cannot withstand weight of 250 pounds and less when, in fact, it really can. You think the ladder can withstand weight of 250 pounds and less when, in fact, it can. You think the ladder cannot withstand weight of 250 pounds and less when, in fact, it cannot. Which of the following answers give valid null and alternative hypotheses for a hypothesis test? Select all correct answers. H0: μ>15; Ha: μ≤15 H0: μ≥15; Ha: μ<15 H0: μ=15; Ha: μ≠15 H0: μ≠15; Ha: μ=15 A mattress store advertises that their beds last at least 5 years, on average. A consumer group thinks that they do not last that long and wants to set up a hypothesis test. If μ denotes the average time, in years, that the mattresses last, what are the null and alternative hypotheses in this situation? ________________________________________ Select the correct answer below: ________________________________________ H0: μ≥5; Ha: μ<5 H0: μ≤5; Ha: μ>5 H0: μ>5; Ha: μ≤5 H0: μ≥5; Ha: μ≤5 H0: μ≤5; Ha: μ≥5 A mechanic wants to show that more than 44% of car owners do not follow a normal maintenance schedule. Identify the null hypothesis, H0, and the alternative hypothesis, Ha, in terms of the parameter p. ________________________________________ Select the correct answer below: ________________________________________ H0: p≤0.44; Ha: p>0.44 H0: p<0.44; Ha: p≥0.44 H0: p>0.44; Ha: p≤0.44 H0: p≥0.44; Ha: p<0.44 Which of the following results in a null hypothesis p≤0.69 and alternative hypothesis p>0.69? ________________________________________ Select the correct answer below: ________________________________________ A mechanic wants to show that the percentage of car owners that follow a normal maintenance schedule is not 69%, contrary to a study that found that the percentage was 69%. A mechanic wants to show that more than 69% of car owners follow a normal maintenance schedule, contrary to a study that found that the percentage was at most 69%. A mechanic wants to show that at most 69% of car owners follow a normal maintenance schedule, contrary to a study that found that the percentage was more than 69%. A mechanic wants to show that less than 69% of car owners follow a normal maintenance schedule, contrary to a study that found that the percentage was at least 69%. A city wants to show that the mean number of public transportation users per day is more than 5,575. Identify the null hypothesis, H0, and the alternative hypothesis, Ha, in terms of the parameter μ. ________________________________________ In 2015, the CDC analyzed whether American adults were eating enough fruits and vegetables. Let the mean cups of vegetables adults eat in a day be μ. If the analysts wanted to know if adults were eating, on average, at least the recommended 2 cups of vegetables a day, what are the null and alternative hypothesis? ________________________________________ Which of the following results in a null hypothesis p≤0.47 and alternative hypothesis p>0.47? A hospital claims that the mean wait time for emergency room patients is at least 55 minutes. A group of researchers believe that this is not accurate, and want to show that the mean wait time is less than 55 minutes. Identify the group's null hypothesis, H0, and the alternative hypothesis, Ha, in terms of the parameter μ. Which graph below corresponds to the following hypothesis test? H0:μ≤16.9, Ha:μ>16.9 Is the test below left-, right-, or two-tailed? Which type of test is used in the following scenario: A manufacturer claims that the mean lifetime of a new cutting blade is 2 years. Fourteen blades are randomly selected and their lifetime is measured. Assume the population follows a normal distributions with known standard deviation. Suppose the null hypothesis, H0, is: doctors believe that a surgical procedure is successful at least 80% of the time. Which of the following gives β, the probability of a Type II error? ________________________________________ Determine the Type I error if the null hypothesis, H0, is: researchers claim that 65% of college students will graduate with debt. Suppose the null hypothesis, H0, is: a sporting goods store claims that at least 70% of its customers do not shop at any other sporting goods stores. What is β, the probability of a Type II error in this scenario? Determine the Type II error if the null hypothesis, H0, is: the mean price of a loaf of bread is $1.67. ________________________________________ Which of the following results in a null hypothesis μ≥31 and alternative hypothesis μ<31? ________________________________________ Which of the following results in a null hypothesis μ≤7 and alternative hypothesis μ>7? ________________________________________ A commonly cited study says that 49% of students study less than 5 hours per week. A researcher does not think this is accurate and wants to show that the percentage of students that study less than 5 hours per week is not equal to 49%. Horace, a golfer, claims that his drive distance is less than 225 meters, on average. Several of his friends do not believe him, so he decides to do a hypothesis test, at a 10% significance level, to persuade them. He hits 23 drives. The mean distance of the sample drives is 210 meters. Horace knows from experience that the standard deviation for his drive distance is 14meters. [Show More]
Last updated: 1 year ago
Preview 1 out of 10 pages
Reviews( 0 )
Document information
Connected school, study & course
About the document
Uploaded On
Apr 28, 2023
Number of pages
10
Written in

Additional information
This document has been written for:
Uploaded
Apr 28, 2023
Downloads
0
Views
38


.png)