Business > QUESTIONS & ANSWERS > BUS 375 Exam 2 Questions and Answers Graded A (All)
BUS 375 Exam 2 Questions and Answers Graded A
Document Content and Description Below
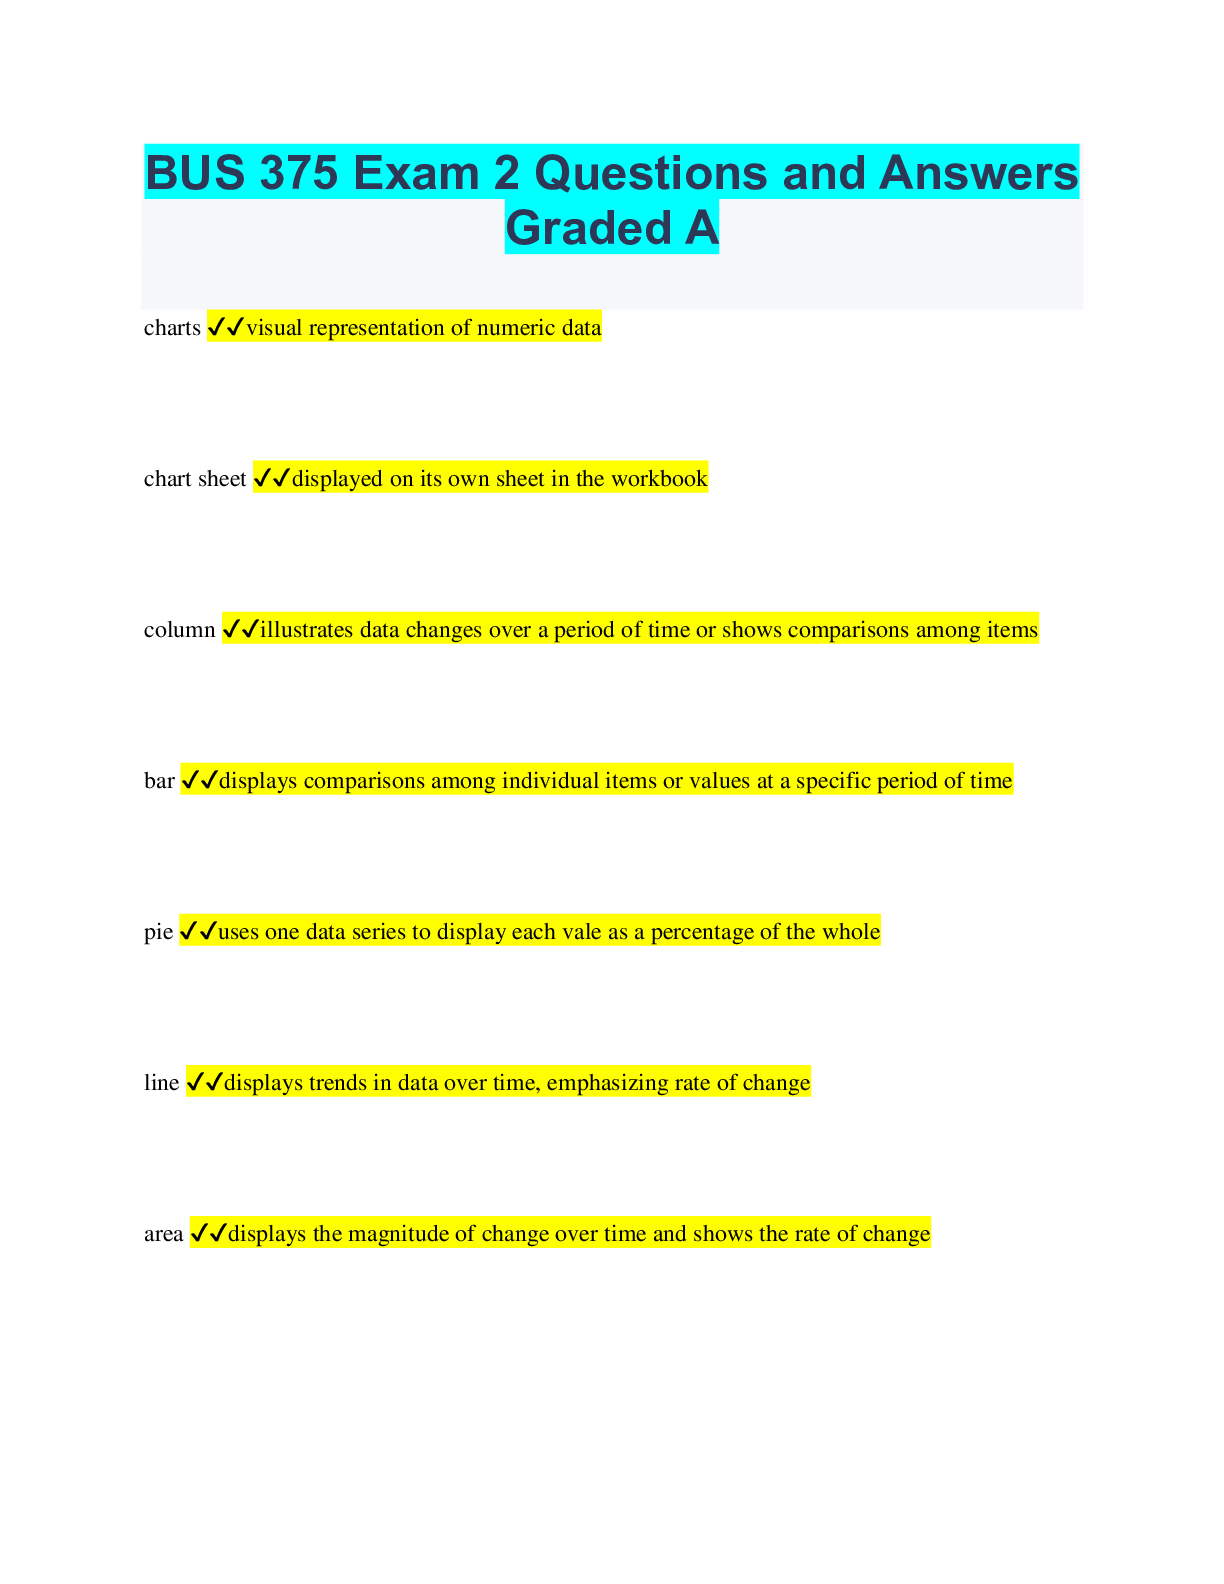
BUS 375 Exam 2 Questions and Answers Graded A charts ✔✔visual representation of numeric data chart sheet ✔✔displayed on its own sheet in the workbook column ✔✔illustrates data changes ... over a period of time or shows comparisons among items bar ✔✔displays comparisons among individual items or values at a specific period of time pie ✔✔uses one data series to display each vale as a percentage of the whole line ✔✔displays trends in data over time, emphasizing rate of change area ✔✔displays the magnitude of change over time and shows the rate of change XY scatter or Bubble ✔✔displays relationships among numeric values in two or more data series; these charts do not have a category stock ✔✔displays three series of data to show fluctuations in stock prices from high to low to close surface ✔✔displays optimum combinations or two sets of data on a surface radar ✔✔displays the frequency of multiple data series relative to a center point. there is an axis for each category treemap ✔✔displays a hierarchical view of data with different sized and colored rectangles and sub-rectangles to compare the sizes of groups sunburst ✔✔displays a hierarchical view of data with concentric rings. the top hierarchy is the inner ring and each outer ring is related to its adjacent inner ring histogram ✔✔column-style chart that shows frequencies within a distribution [Show More]
Last updated: 10 months ago
Preview 1 out of 11 pages
Reviews( 0 )
Document information
Connected school, study & course
About the document
Uploaded On
Jun 05, 2023
Number of pages
11
Written in

Additional information
This document has been written for:
Uploaded
Jun 05, 2023
Downloads
0
Views
55
.png)
.png)
.png)
.png)
.png)
.png)


.png)
.png)
.png)
 (1).png)