Geography > Lab Report > Lab Exploring the Topography of the Earth’s Surface Bathymetry_(answer_sheet_2020) (All)
Lab Exploring the Topography of the Earth’s Surface Bathymetry_(answer_sheet_2020)
Document Content and Description Below
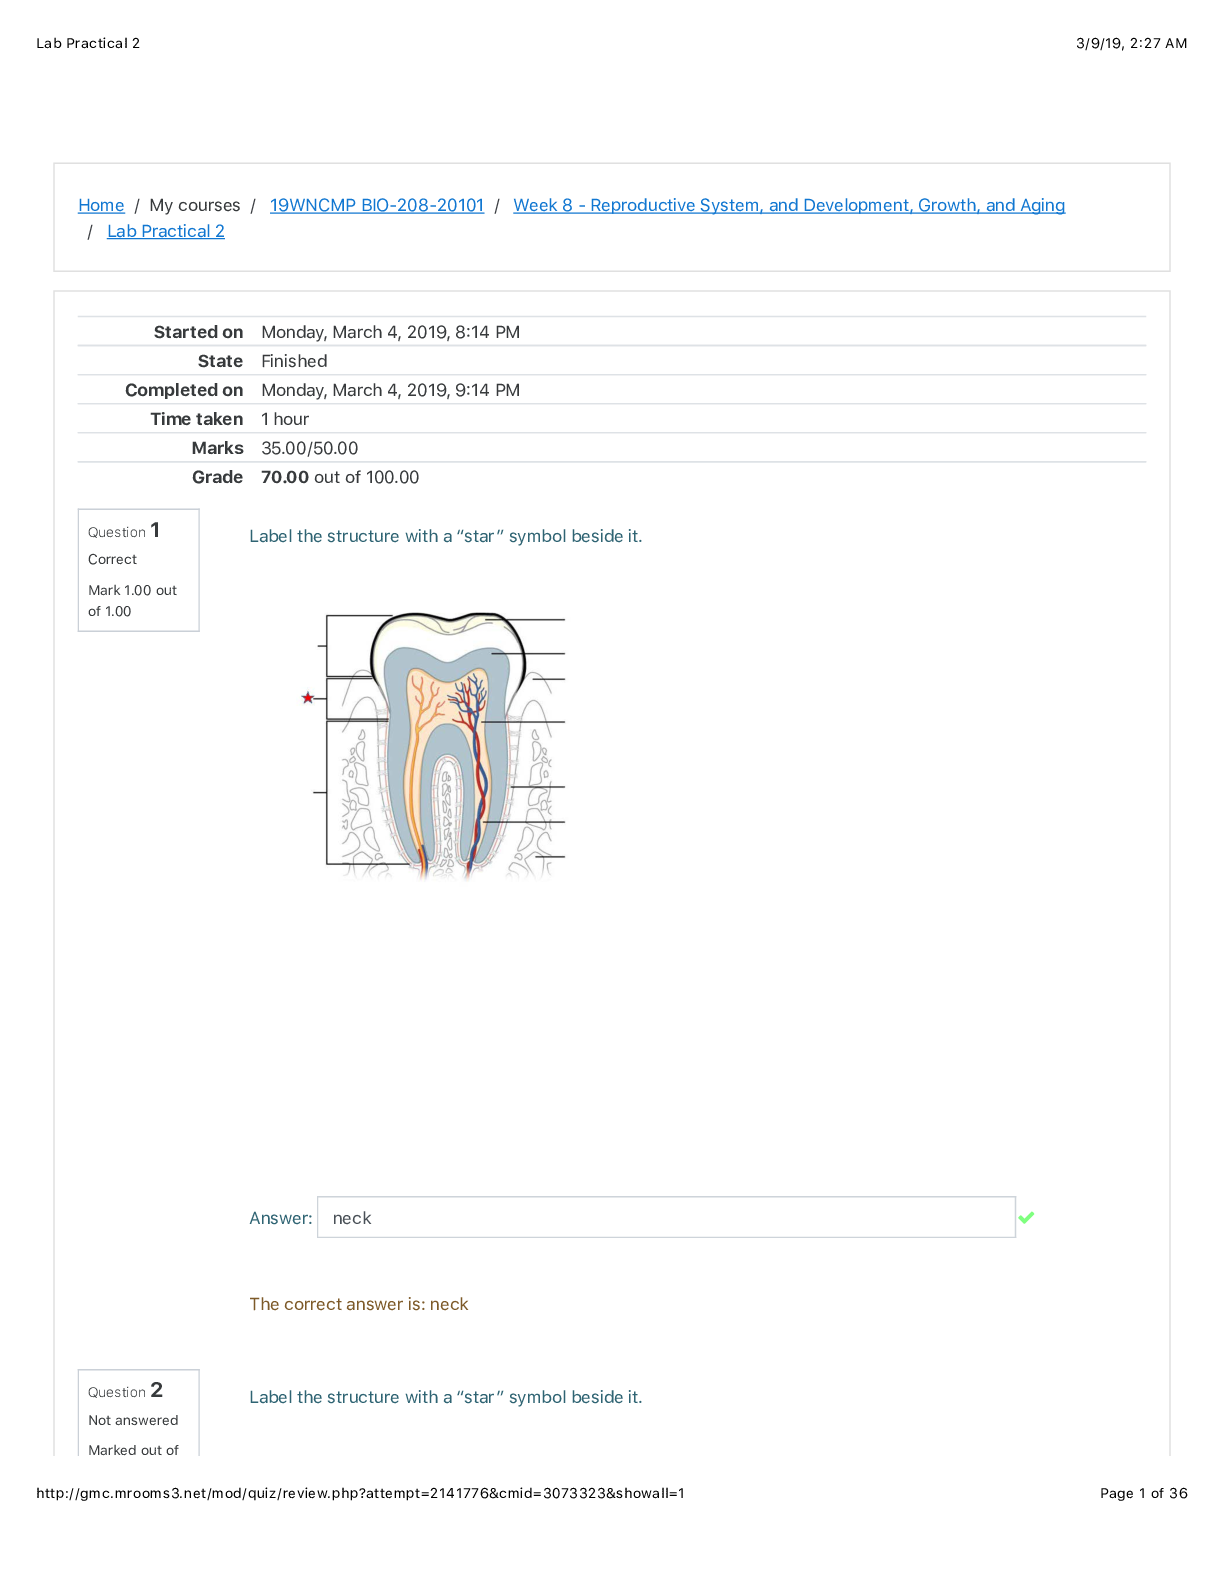
Lab 2 – Exploring the Topography of the Earth’s Surface Part 1: The water depth data in this figure are in meters (m) below sea level. You will often see this abbreviated as mbsl. Use a contour... interval of 100 m starting with 100 m. Finally, ignore the “t” you see after 535 (lower left side). Note: The x- and y-axes for this map are both 5 km. Also, the water depth data in this figure are in meters below sea level (mbsl). 1 of 7OC 201e – Introduction to Oceanography Questions: 1. Draw the contour lines on the plot above as per the instructions. (5 pts) 2. What region of the ocean is this a plot of? (0.5 pts) - Looks to be off of a coast line 3. What are three major features found on this plot? Label them on the plot as well. Hint – This bathymetric map is very similar to what we see off the northern Oregon coast. (3 pts) - 4. Could there be features on this plot that we did not map? Explain? (2 pts) - Yes, there could always be depths that were not measured in between thus creating new contour lines. 5. On this plot where would you expect to find the most neritic sediment in the offshore region? Mark this on the plot. How did this neritic sediment get here? (2 pts) - The most neritic sediment would be found in the shallower parts of this contour map. These sediment deposits get here primarily by land erosion and are carried here from other water sources. 6. What is strange about this depth profile? Where would you expect to find this sort of depth profile? (Note – think about this in regards to the depth range)? (1 pt) - The depth jumps in this profile are strange. Depths in close proximity were sometimes 100’s of meter apart in depth meaning very large drop offs. You could find this sort of depth profile in the mesopelagic zone of the ocean where the depth ranges from 200- 1000m. 2 of 7OC 201e – Introduction to Oceanography Part 2: 1. Click on the “bookmarks” menu and select “zoom to specific region” and enter N: 36, E: -20, S: 16, W: -65, then click zoom. This takes you to area #1 in the North Atlantic Ocean. The shallow (white & orange colors) feature running down the middle of the basin is known as the “Mid-Atlantic Ridge”. Note that your curser’s lat long is displayed at the top of the window. Coordinates should ALWAYS be listed as Lat Long (never Long Lat) – otherwise confusion leads to running aground or sampling in the wrong place. Click on the “distance/profile tool” (i.e., the bottom immediately to the left of the “X-Y-Z” button) and make a profile of the seafloor from around 29°N, 53°W to the southeast perpendicular to the ridge, ending at around 24°N, 33°W. Save the profile as profile1.jpg and then import it into the space below. (0.5 pts) [Show More]
Last updated: 1 year ago
Preview 1 out of 10 pages

Reviews( 0 )
Document information
Connected school, study & course
About the document
Uploaded On
Aug 14, 2021
Number of pages
10
Written in

Additional information
This document has been written for:
Uploaded
Aug 14, 2021
Downloads
0
Views
63


 (1).png)


.png)
.png)
