Statistics > SOPHIA PATHWAY > Sophia_Statistics_Unit_2_Milestone 2020 - Metropolitan Community College | Sophia_Statistics_Unit_2_ (All)
Sophia_Statistics_Unit_2_Milestone 2020 - Metropolitan Community College | Sophia_Statistics_Unit_2_Milestone 2020 - (ANSWERS AND RATIONALE)
Document Content and Description Below
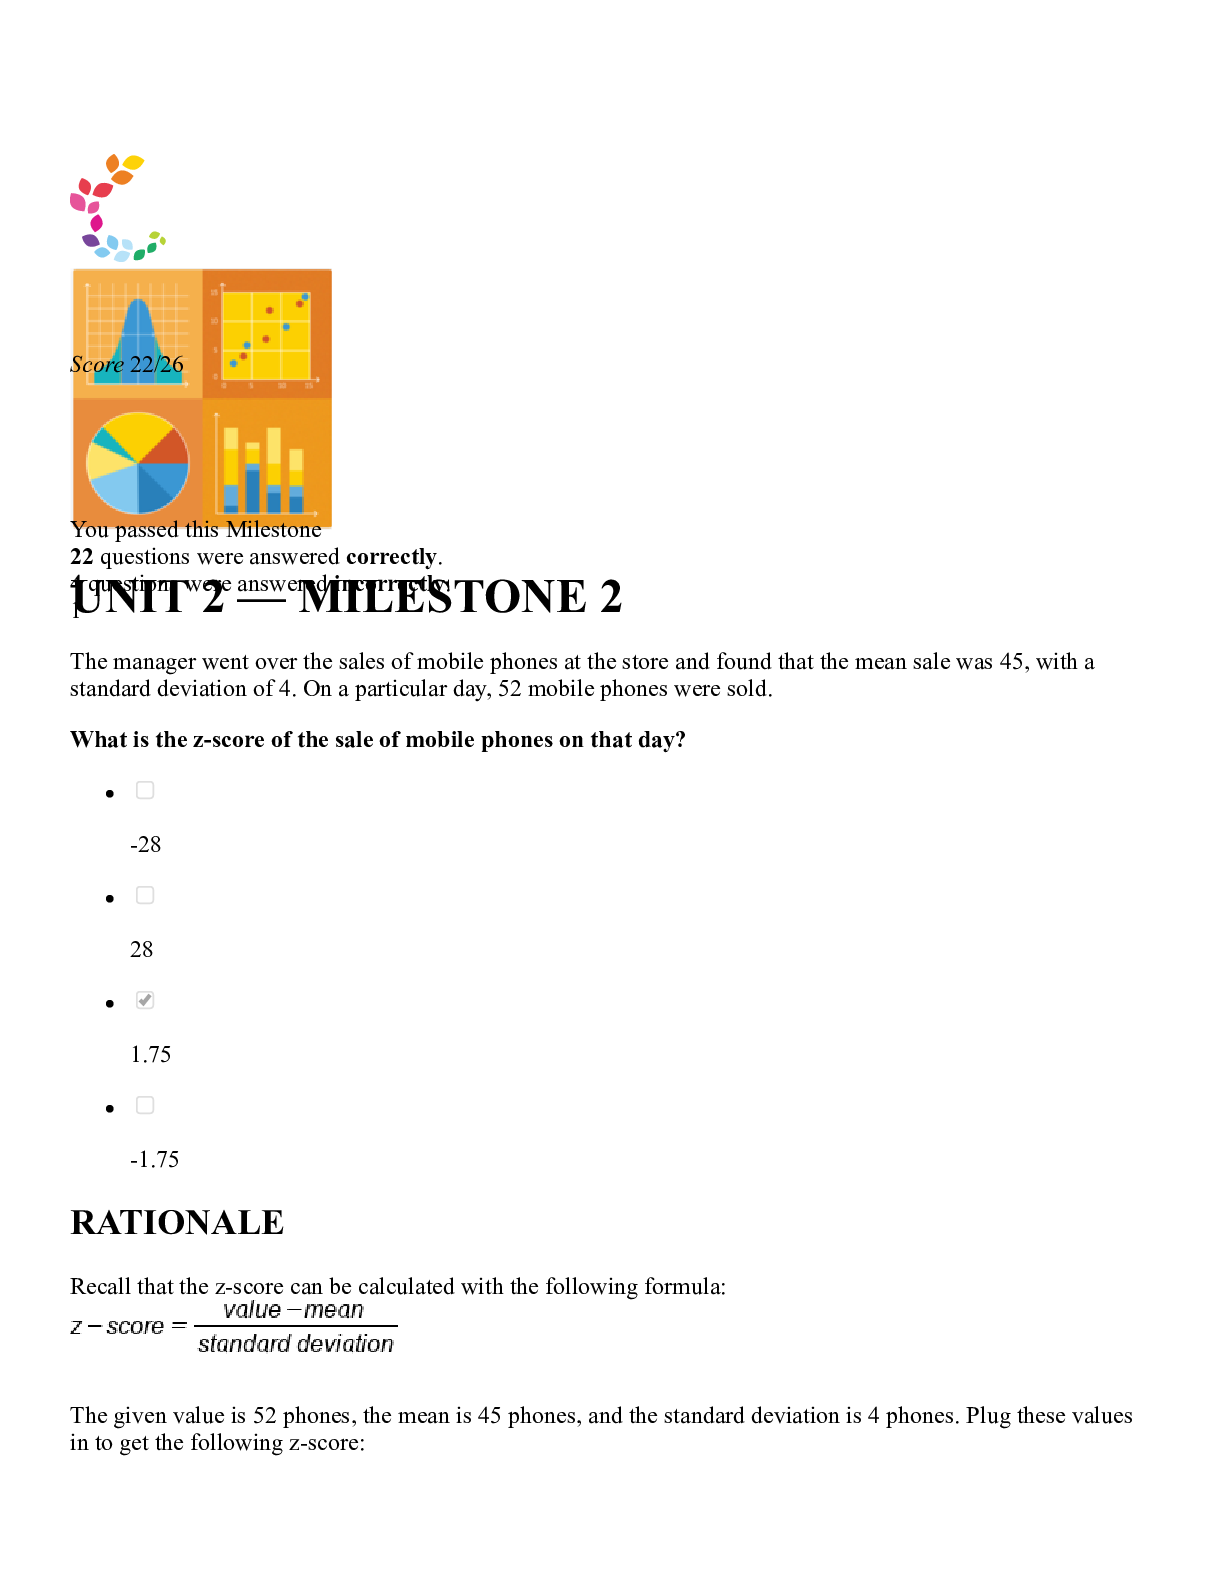
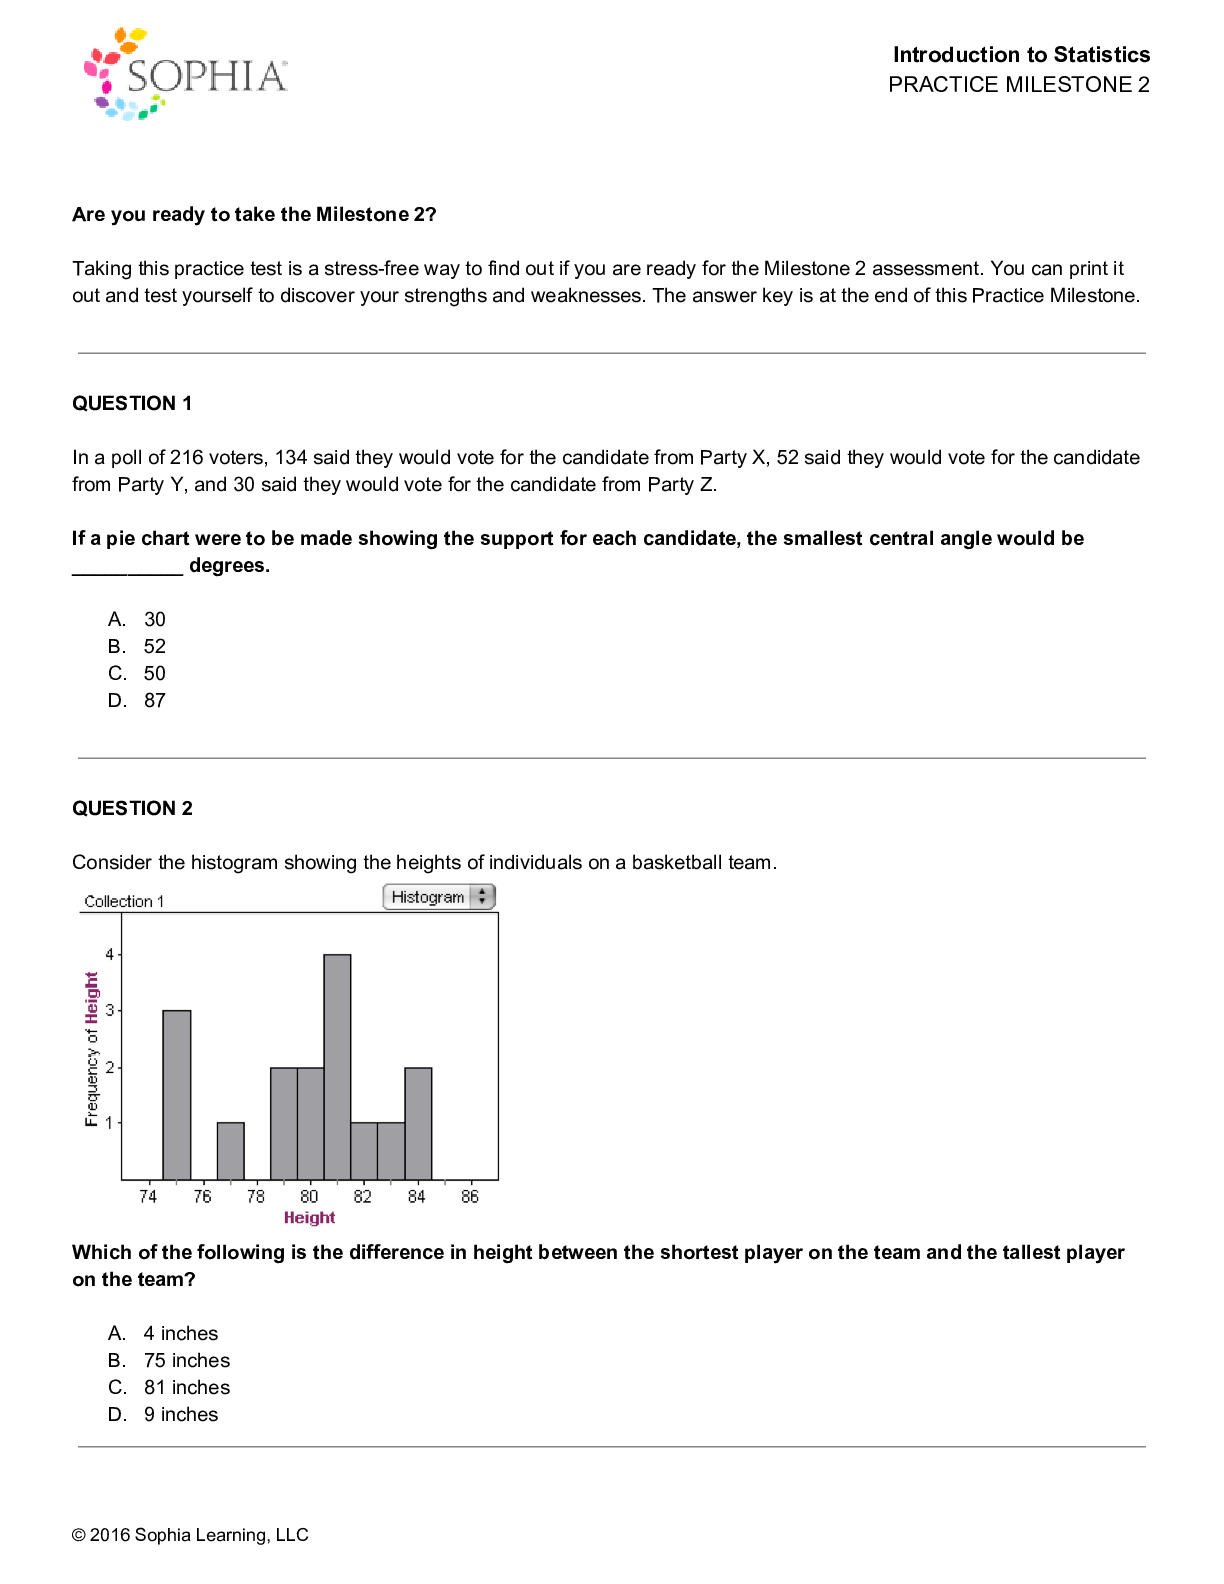
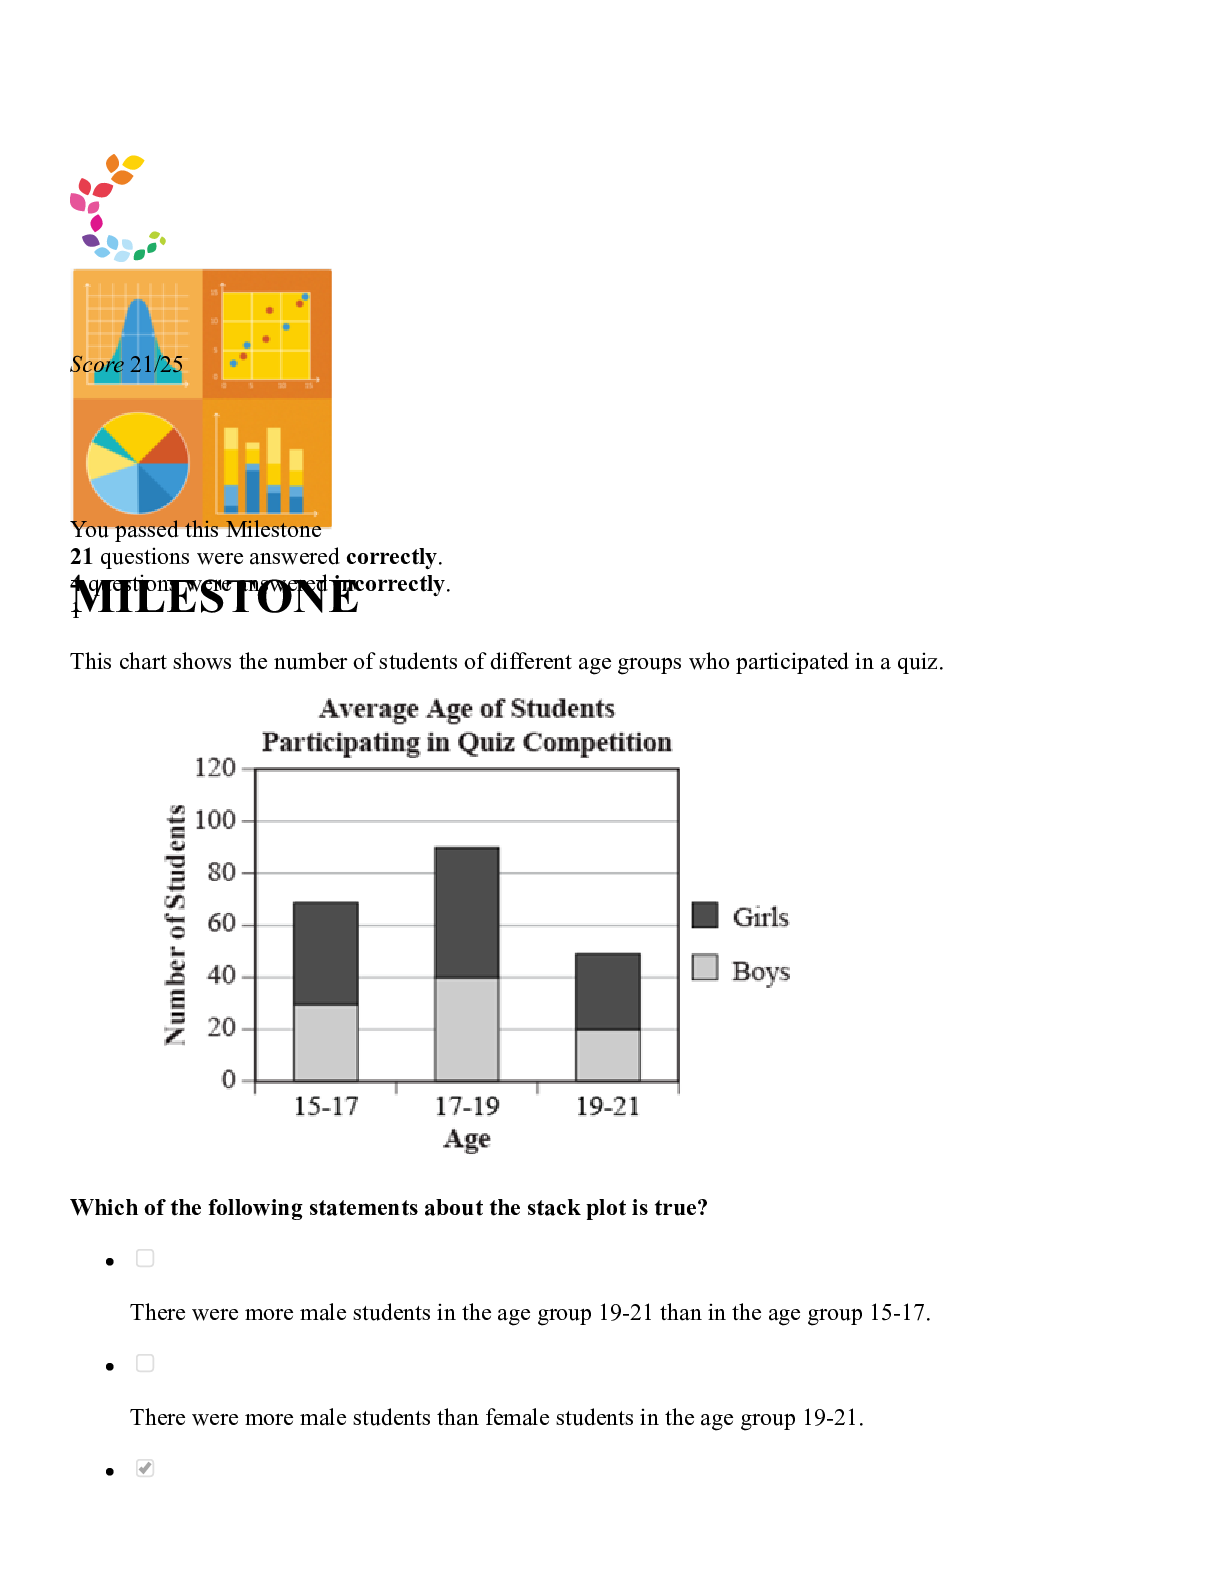
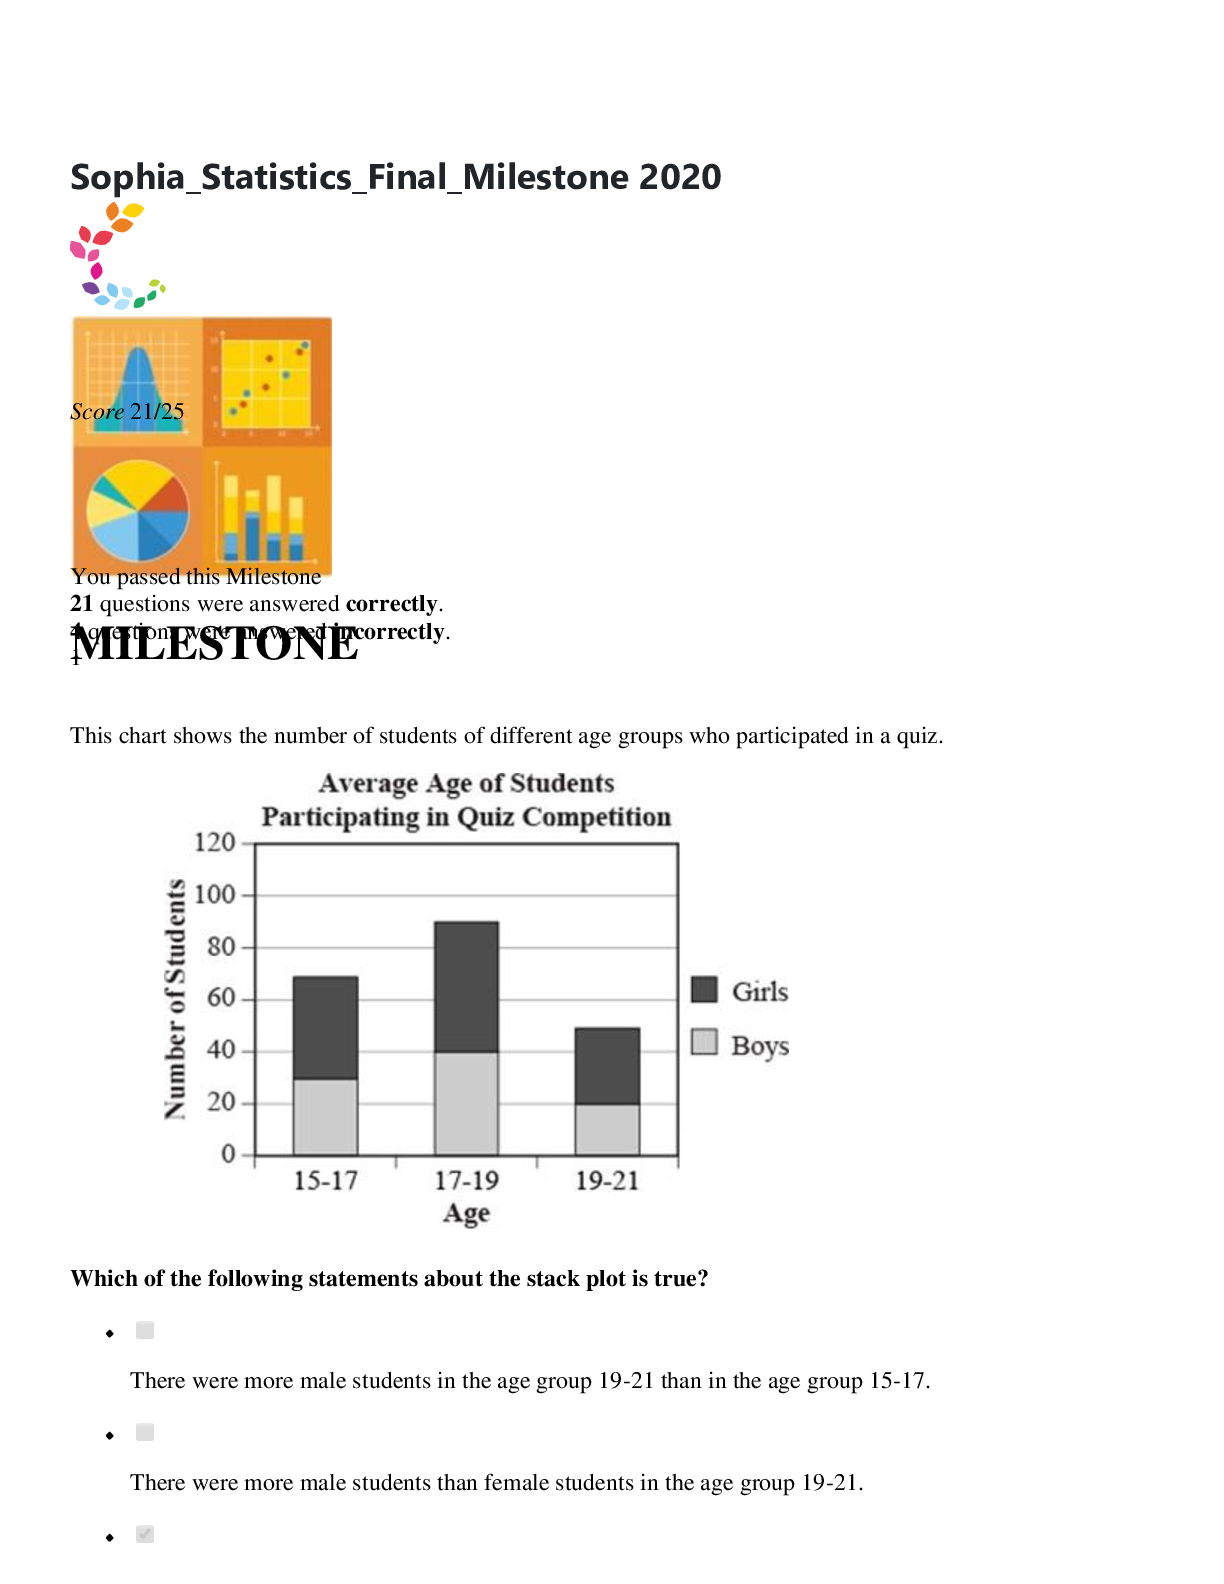
Sophia_Statistics_Unit_2_Milestone 2020 - Metropolitan Community College | Sophia_Statistics_Unit_2_Milestone 2020 - (ANSWERS AND RATIONALE) UNIT 2 — MILESTONE 2 Score 22/26 You passed this Miles... tone 22 questions were answered correctly. 4 questions were answered incorrectly. 1 The manager went over the sales of mobile phones at the store and found that the mean sale was 45, with a standard deviation of 4. On a particular day, 52 mobile phones were sold. What is the z-score of the sale of mobile phones on that day? -28 28 1.75 -1.75 RATIONALE Recall that the z-score can be calculated with the following formula: The given value is 52 phones, the mean is 45 phones, and the standard deviation is 4 phones. Plug these values in to get the following z-score:This also tells us that 52 is 1.75 z-scores or standard deviations above the mean. CONCEPT Standard Scores and Z-Scores I need help with this question 2 In a poll of 300 preschoolers, 125 said they preferred chocolate ice cream, 71 said they preferred vanilla, 100 said they preferred cookies & cream, and 4 said they had never eaten ice cream. If a pie chart were to be made showing the preference for each flavor, the central angle for the chocolate ice cream sector would be __________. 41° 5° 150° 124° RATIONALE Recall that to get the angle for something in a pie chart we use the following formula: So in this case, the central angle for the chocolate ice cream sector would be: CONCEPT Bar Graphs and Pie Charts I need help with this question 3 open parentheses fraction numerator v a l u e over denominator t o t a l space v a l u e end fraction close parentheses times 360 degreeThe first quartile (Q1) value from the above box plot is __________. 47 40 65 54 RATIONALE Note the value for Q1 is the left edge of the box, which is 47. CONCEPT Five Number Summary and Boxplots I need help with this question 4 Select the statement that accurately describes unimodal distribution. A distribution in which two distinct values are more frequent than the other values. A distribution in which the values are distributed uniformly.A distribution in which one value is more frequent than other values. A distribution in which numerous values are more frequent than other values. RATIONALE Recall the mode is the most frequently occurring value. If a distribution is unimodal, it simply means there is one value that occurs most frequently. CONCEPT Shapes of Distribution I need help with this question 5 Choose the statement that correctly describes a normal distribution. Approximately 68% of the values are greater than the mean value. The approximate percent of values lying within three standard deviations of the mean is 49.85%. Approximately 68% of the values lie within one standard deviation of the mean. The approximate percent of values lying within two standard deviations of the mean is 47.5%. RATIONALE The normal distribution follows the empirical rule. This tells us that within one standard deviation of the mean, we should find roughly 68% of the data. CONCEPT Normal Distribution I need help with this question 6 Sara wonders what percentage of her students answered at least half of the quiz questions incorrectly.The relative cumulative frequency of students who earned a score of 20 or lower on the quiz is __________ . 68% 28% 34% 14% RATIONALE To get the relative frequency of 20 or lower, we need to find the cumulative number of 20 or less. We simply add up any bin that has the number 20 or less, such as the bin that shows scores of 1-5, 6-10, 11-15, and 16-20. This would be:To get relative frequency, we will take this cumulative number and divide it by the total number of students. CONCEPT Cumulative Frequency I need help with this question 7 Dave drives to work. While driving the car over nine days, he observes his daily average speed and lists it in the table below. Day Average Speed (MPH) 1 45 2 62 3 44 4 70 5 59 6 66 7 54 8 63 9 67 The median speed at which Dave drove to work was __________. 62 miles per hour 58.89 miles per hour 59 miles per hour 63 miles per hour RATIONALE To get the median we first order the data and take the middle value. The ordered values are:Since there are an odd number (n=9) of values we simply take the middle, which is 62 mph. CONCEPT Mean, Median, and Mode I need help with this question 8 Which of the following statements is true? For a large enough sample size, the Central Limit Theorem states that the sample medians of repeated samples of a population are normally distributed. For the Central Limit Theorem to be true, you must have a large sample, the underlying population must be normally distributed, and the standard deviation should not be finite. Even with a very large sample size, the Central Limit Theorem states that the sample means of repeated samples of a population cannot be normally distributed. For a large enough sample size, the Central Limit Theorem states that the sample means of repeated samples of a population are normally distributed. RATIONALE The Central Limit Theorem gives us information about the properties' sampling distributions of statistics to have given that the sample size is large enough. It tells us the sampling distribution's mean should be equal to the true population mean. CONCEPT Shape of a Sampling Distribution I need help with this question 9 The weekly salaries of full-time and part-time employees at a company are listed on the table.What does the circled section represent? Sixty-eight full-time employees earn $34 per week. Two full-time employees earn more than $680 per week. Thirty-four part-time employees earn more than $680 per week. Two part-time employees earn between $680 and $690 per week. RATIONALE If we recall that the stem and leaf can give us the actual values in the data set, then the circle corresponds to $683 and $684. We can then note that there are two part-time workers who make between $680 and $690. CONCEPTStem-and-Leaf Plots I need help with this question 10 In a survey to rate the customer service department of a company, 300 persons rated their agreement with the statement, "The staff is helpful and courteous." The information was put into a table. Rating Frequency Strongly Agree 32 Agree 50 Neutral 97 Disagree 53 Strongly Disagree 68 The relative frequency of people who strongly disagree with the statement is __________. 22.7% 10.7% 40.3% 68% RATIONALE To get the relative frequency, we take the frequency of the value and divide it by the total number. So in this case for strongly disagree, the relative frequency would be: CONCEPT Frequency Tables I need help with this question 11 The difference between the standard deviation and the variance of a standard normal distribution is __________.0 1 0.5 2 RATIONALE Recall the variance and standard deviation of a standard normal are both 1, so the difference is 0. CONCEPT Standard Normal Distribution I need help with this question 12 The percent-change graph in the figure shows the change in Gross Domestic Product (GDP) from 2008-2012. Which segment of the graph indicates the greatest increase in GDP growth? D CA B RATIONALE Since the graph shows growth rate, the greatest growth rate will be the segment with the greatest slope that is positive. This is at segment B, where the growth rate increases from -0.5 to 2. CONCEPT Line Charts and Time-Series Diagrams I need help with this question 13 Select the statement that is FALSE. The interquartile range is the difference between the highest and lowest values in the middle of a data set. The range is the difference between the largest and smallest values of a data set. The range is never greater than the greatest value of a data set. The mean is never greater than the greatest value of a data set. RATIONALE If we recall, the range is the maximum value minus the minimum value. Suppose in a given dataset, the maximum value is 20 and the minimum value is -5. Then the range is equal to: The range of 25 is larger than the maximum value of 20, so the range can certainly be larger than the max value. CONCEPT Range and Interquartile Range (IQR) I need help with this question 14Let x stand for the percentage of an individual student's math test score. 64 students were sampled at a time. The population mean is 78 percent and the population standard deviation is 14 percent. What is the standard deviation of the sampling distribution of sample means? 14 1.75 64 0.22 RATIONALE The standard deviation of the sampling distribution, , is equal to the standard deviation of the original population, , divided by the square root of the sample size, . If the standard deviation of the population is 14 and the sample size is 64, then the standard deviation of the sampling distribution is: CONCEPT Center and Variation of a Sampling Distribution I need help with this question 15 The school paper published the results of a survey among grade eight students with regards to their favorite subject.Which of the following statements about the stack plot is true? More girls than boys chose English as their favorite subject. Most of the students chose English as their favorite subject. More than half the girls chose science as their favorite subject. More boys chose math as their favorite subject than science. RATIONALE When examining English, we can see that the darker area (girls) is much larger than the boys. So it is true that more girls choose English as their favorite subject. In fact, in all subjects it appears that there are more girls relative to boys. CONCEPT Stack Plots I need help with this question 16 Jerry graded seven standardized tests with the following scores: 60, 74, 41, 87, 94, 79, 57 Which standardized test score represents the 50th percentile?74 41 79 57 RATIONALE The 50th percentile will be the median, or middle number. Make sure to first order the data. The middle number is the 4th value, or 74. CONCEPT Percentiles I need help with this question 17 The dotplot below shows the number of text messages received by a group of students in a day. How many students received less than 15 messages? 20 154 9 RATIONALE If we sum up the X's that represent an individual receiving less than 15 messages, we need to include the number of students who received 14 messages, 13 messages, 12 messages, etc. This looks like: So there are 15 students who received less than 15 messages. CONCEPT Dot Plots I need help with this question 18 Which of the following is NOT a step used in calculating standard deviation? Dividing the sum of each value by the total number of values plus 1. Squaring the difference of x - u. Calculating the mean of the data set. Subtracting the value of each data set from the mean. RATIONALE Recall the standard deviation . So there is no addition of 1 to any values. CONCEPT Standard Deviation I need help with this question19 In which of these cases should mode be used? When the data is qualitative and we talk about the most frequent category When the data is represented using ratio scale When the data is represented using interval scale When the data has extreme values RATIONALE If the data is qualitative, it is only descriptive. In this case, the mode is a good measure since the mode examines the most frequently occurring value. The data can be non-numeric. CONCEPT Measures of Center I need help with this question 20 Consider this histogram showing the number of students in grade five who have one or more pets. What is the difference in the number of students with the most and least numbers of pets?10 2 4 9 RATIONALE The most number of pets is 10 and there is 1 person who has this many pets. The least number of pets is 1 and there are 5 people with 1 pet. So the difference in the number of people would be: CONCEPT Histograms I need help with this question 21 Ralph records the time it takes for each of his classmates to run around the track one time. As he analyzes the data on the graph, he locates the mean and median time. Which component of data analysis is Ralph utilizing? An outlier in the data set The center of the data set The overall shape of the data The overall spread of the data RATIONALE Recall that the mean and median are measures of center. So by examining this, Ralph is looking at the center of the data.CONCEPT Data Analysis I need help with this question 22 At Brent's school, the final grade for his U.S. History course is weighted as follows: Tests: 30% Quizzes: 50% Homework: 20% Brent has an average of 82% on his tests, 94% on his quizzes, and 50% on his homework. What is Brent's weighted average? 74.8% 69.6% 81.6% 75.3% RATIONALE In order to get the weighted average we use the following formula: CONCEPT Weighted Mean I need help with this question 23 The quality control inspector of a factory manufacturing screws found that the samples of screws are normally distributed with a mean length of 5.5 cm and a standard deviation of 0.1 cm. If the distribution is normal, what percent of data lies between 5.3 centimeters and 5.7 centimeters?95% 68% 34% 99.7% RATIONALE Recall that if the data is normal, then the 68-95-99.7 rule applies which states that 68% of all data points fall within one standard deviation of the mean, 95% of all data points fall within two standard deviations of the mean, and 99.7% of all data points fall within three standard deviations of the mean. 5.3 cm and 5.7 cm are both 0.2 cm from the mean of 5.5 cm, which is the same as two standard deviations (0.1cm * 2) in either direction. This tells us that 95% of the data should lie between 5.3 cm to 5.7 cm. CONCEPT 68-95-99.7 Rule I need help with this question 24 Which of the following statements is true for an outlier? It is a data point that is below or above Q3 ± 1.5 x IQR. It is a data point that is below Q1 - 1.5 x IQR or above Q3 + 1.5 x IQR. It is a data point that is below or above Q1 ± 1.5 x IQR. It is a data point that is between Q1 + 1.5 x IQR and Q3 - 1.5 x IQR. RATIONALE To find an outlier we note the lower bound and upper bound for outliers are Q1 - 1.5IQR and Q3 + 1.5IQR respectively.CONCEPT Outliers and Modified Boxplots I need help with this question 25 The formula for the standard deviation of a sample is: Select the true statement for the following data set that has a mean of 6.75: 4, 6, 7, 10 Answer choices are rounded to the hundredths place. The variance is 6.75 and the standard deviation is 6.25. The variance is 6.25 and the standard deviation is 2.50. The variance is 2.50 and the standard deviation is 6.50. The variance is 4.71 and the standard deviation is 2.17. RATIONALE We can first calculate the variance of the data, , by using the part of the formula under the square root: Next, we can find the standard deviation, , by simply taking the square root of the variance: We can also use the statistical functions in Excel to quickly find the variance and standard deviation. CONCEPTStandard Deviation I need help with this question 26 For a class reading competition, the students were asked to read a book. Mike, Jack, and Rayon discussed the numbers of pages they read on the first day. One of them made a graph to represent the data. Who made the graph, and why? Rayon, because he wanted to make the amount read by each person appear very different. Mike, because he wanted to make the amount read by each person appear reasonably close. Mike, because he wanted to accurately show the amount read by each person. Jack, because he wanted to make it look like he read significantly more than the others. RATIONALE Since there was a competition, the person who most likely made this graph would want to represent themselves favorably. Since Jack has the most pages, it would probably be him. CONCEPT Misleading Graphical Displays I need help with this question © 2020 SOPHIA Learning, LLC. SOPHIA is a registered trademark of SOPHIA Learning, LLC.About Contact Us Privacy Policy Terms of Use [Show More]
Last updated: 1 year ago
Preview 1 out of 22 pages
Reviews( 0 )
Document information
Connected school, study & course
About the document
Uploaded On
Sep 11, 2020
Number of pages
22
Written in

Additional information
This document has been written for:
Uploaded
Sep 11, 2020
Downloads
0
Views
52

 – University of the People.png)

 – University of Maryland.png)
 – University of the People.png)
 – University of the People.png)
 – University of the People.png)
.png)