Statistics > SOPHIA Milestone > Sophia Statistics Unit 4 Milestone - Corrected (All)
Sophia Statistics Unit 4 Milestone - Corrected
Document Content and Description Below
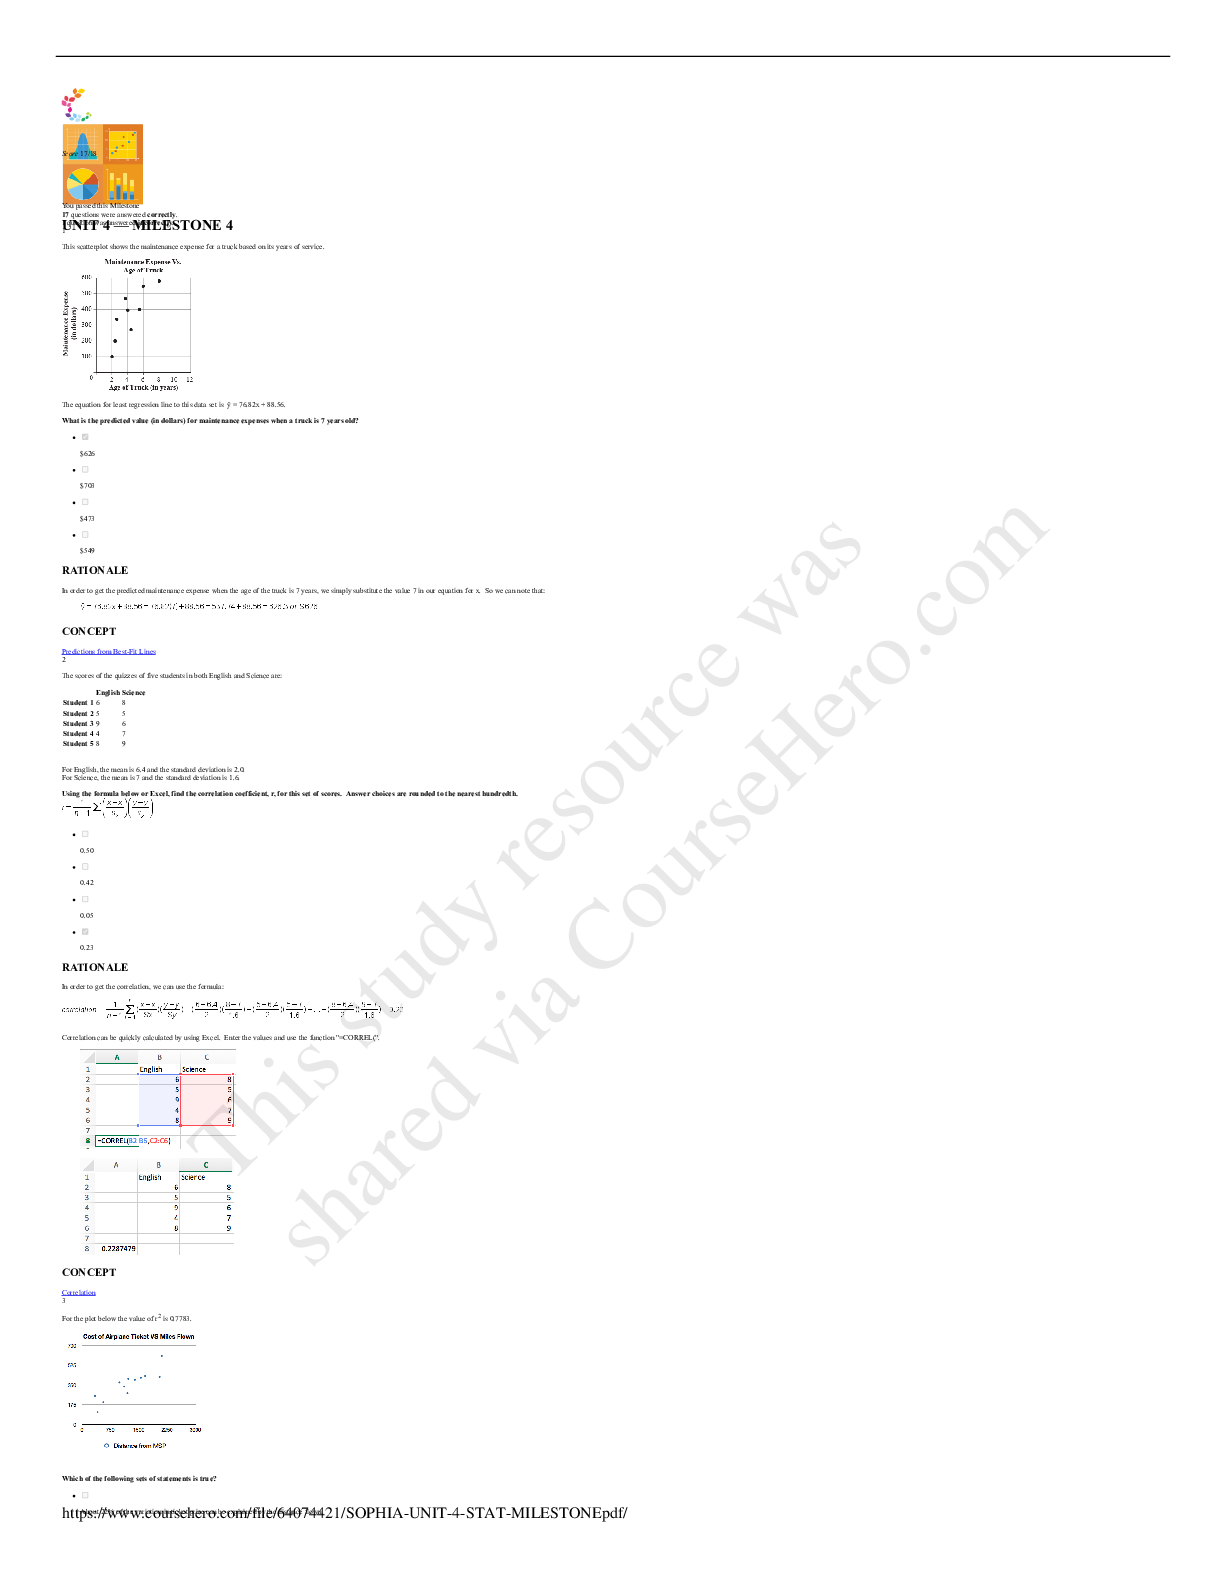
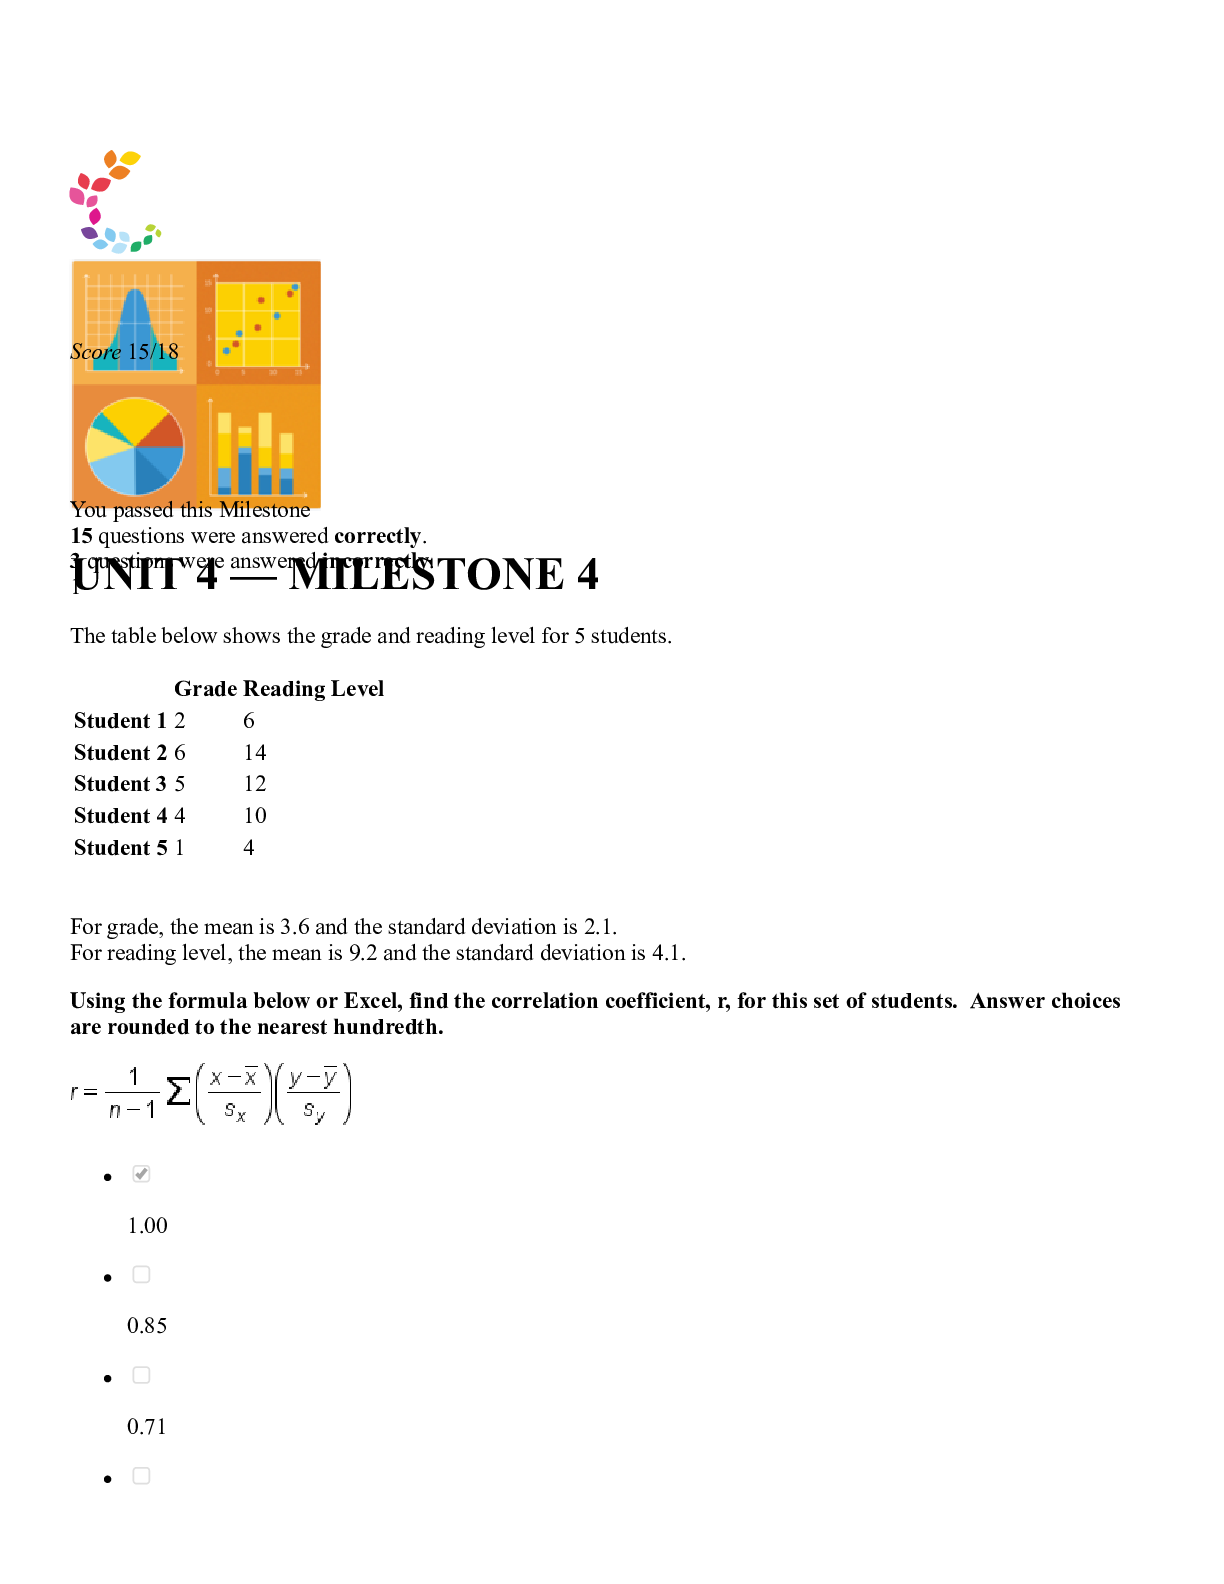
You passed this Milestone 1 The table below shows the grade and reading level for 5 students. Grade Reading Level Student 1 2 6 Student 2 6 14 Student 3 5 12 Student 4 4 10 Student 5 1 4 Fo... r grade, the mean is 3.6 and the standard deviation is 2.1. For reading level, the mean is 9.2 and the standard deviation is 4.1. Using the formula below or Excel, find the correlation coefficient, r, for this set of students. Answer choices are rounded to the nearest hundredth. 1.00 0.85 0.71 0.92 RATIONALE In order to get the correlation, we can use the formula: Correlation can be quickly calculated by using Excel. Enter the values and use the function "=CORREL(". CONCEPT Correlation I need help with this question 2 This scatterplot shows the maintenance expense for a truck based on its years of service. The equation for least regression line to this data set is ŷ = 76.82x + 88.56. What is the predicted value (in dollars) for maintenance expenses when a truck is 7 years old? $549 $473 [Show More]
Last updated: 1 year ago
Preview 1 out of 18 pages

Also available in bundle (1)
Sophia Statistics all Milestones : Questions , Answers with Rationale
Sophia Statistics all Milestones : Questions , Answers with Rationale
By d.occ 2 years ago
$29
5
Reviews( 0 )
Document information
Connected school, study & course
About the document
Uploaded On
Nov 08, 2021
Number of pages
18
Written in

Additional information
This document has been written for:
Uploaded
Nov 08, 2021
Downloads
0
Views
171