Information Technology > QUESTIONS & ANSWERS > Georgia Tech ISYE 6501 – Intro Analytics Modeling Due Date: 1/22/20 Homework 2. 100% Proven pass r (All)
Georgia Tech ISYE 6501 – Intro Analytics Modeling Due Date: 1/22/20 Homework 2. 100% Proven pass rate.
Document Content and Description Below
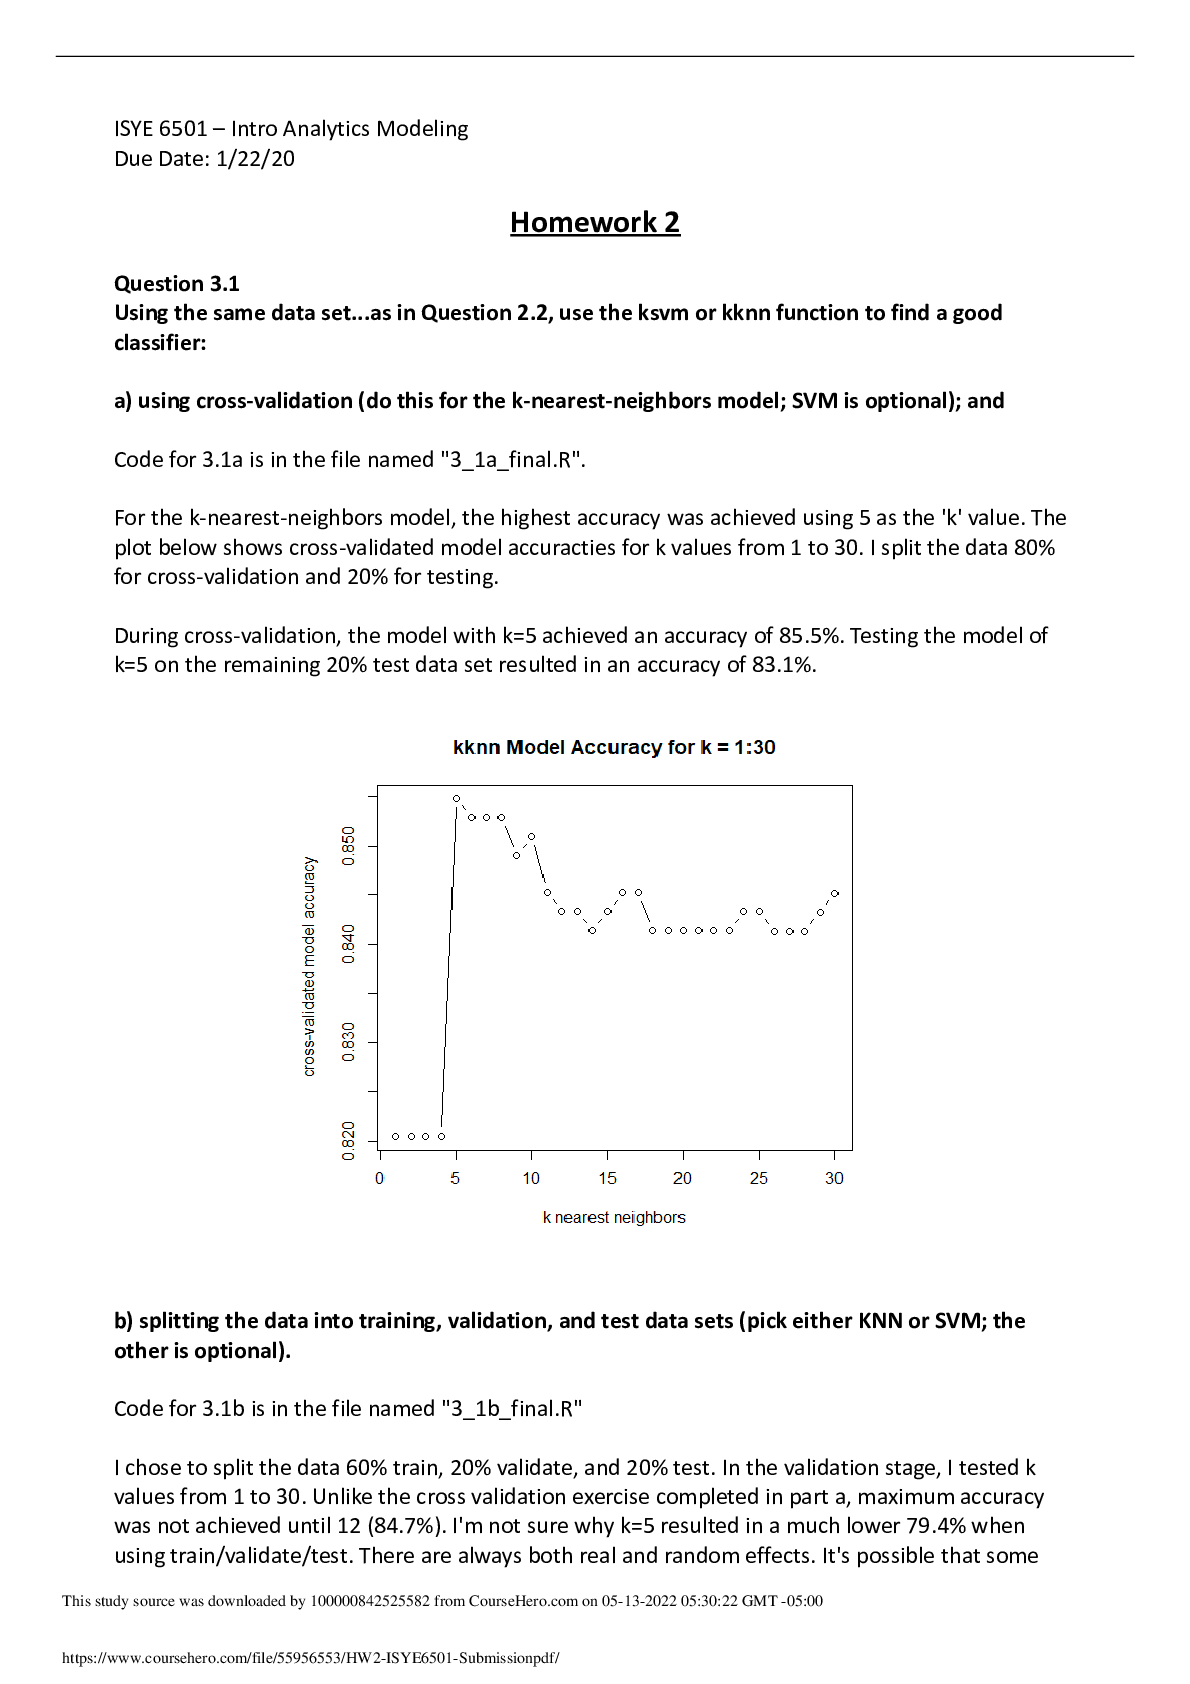
ISYE 6501 – Intro Analytics Modeling Due Date: 1/22/20 Homework 2 Question 3.1 Using the same data set...as in Question 2.2, use the ksvm or kknn function to find a good classifier: a) using c... ross-validation (do this for the k-nearest-neighbors model; SVM is optional); and Code for 3.1a is in the file named "3_1a_final.R". For the k-nearest-neighbors model, the highest accuracy was achieved using 5 as the 'k' value. The plot below shows cross-validated model accuracties for k values from 1 to 30. I split the data 80% for cross-validation and 20% for testing. During cross-validation, the model with k=5 achieved an accuracy of 85.5%. Testing the model of k=5 on the remaining 20% test data set resulted in an accuracy of 83.1%. b) splitting the data into training, validation, and test data sets (pick either KNN or SVM; the other is optional). Code for 3.1b is in the file named "3_1b_final.R" I chose to split the data 60% train, 20% validate, and 20% test. In the validation stage, I tested k values from 1 to 30. Unlike the cross validation exercise completed in part a, maximum accuracy was not achieved until 12 (84.7%). I'm not sure why k=5 resulted in a much lower 79.4% when using train/validate/test. There are always both real and random effects. It's possible that some This study source was downloaded by 100000842525582 from CourseHero.com on 05-13-2022 05:30:22 GMT -05:00 https://www.coursehero.com/file/55956553/HW2-ISYE6501-Submissionpdf/random effects resulted in the higher k-values with artificially strong accuracies. When I tested the model with k=12 on the remaining 20% of data, the accuracy was 87.0%, better than the accuracy of k=5 reported in part A. The plot below shows the accuracies of the different values of k. Unlike for cross validation, the accuracy rises steadily from 5 to 8. The difference in accuracy above 8 does not appear to change significantly. If this were an elbow plot, I think that k=8 would be a reasonable choice for lowest k value that provides the highest accuracy. [Show More]
Last updated: 1 year ago
Preview 1 out of 3 pages
Buy this document to get the full access instantly
Instant Download Access after purchase
Add to cartInstant download
We Accept:

Reviews( 0 )
$7.00
Document information
Connected school, study & course
About the document
Uploaded On
Sep 03, 2022
Number of pages
3
Written in

Additional information
This document has been written for:
Uploaded
Sep 03, 2022
Downloads
0
Views
85