Health Care > EXAM > IHI QI:104 / EXAM / 100% CORRECT ANSWERS (All)
IHI QI:104 / EXAM / 100% CORRECT ANSWERS
Document Content and Description Below
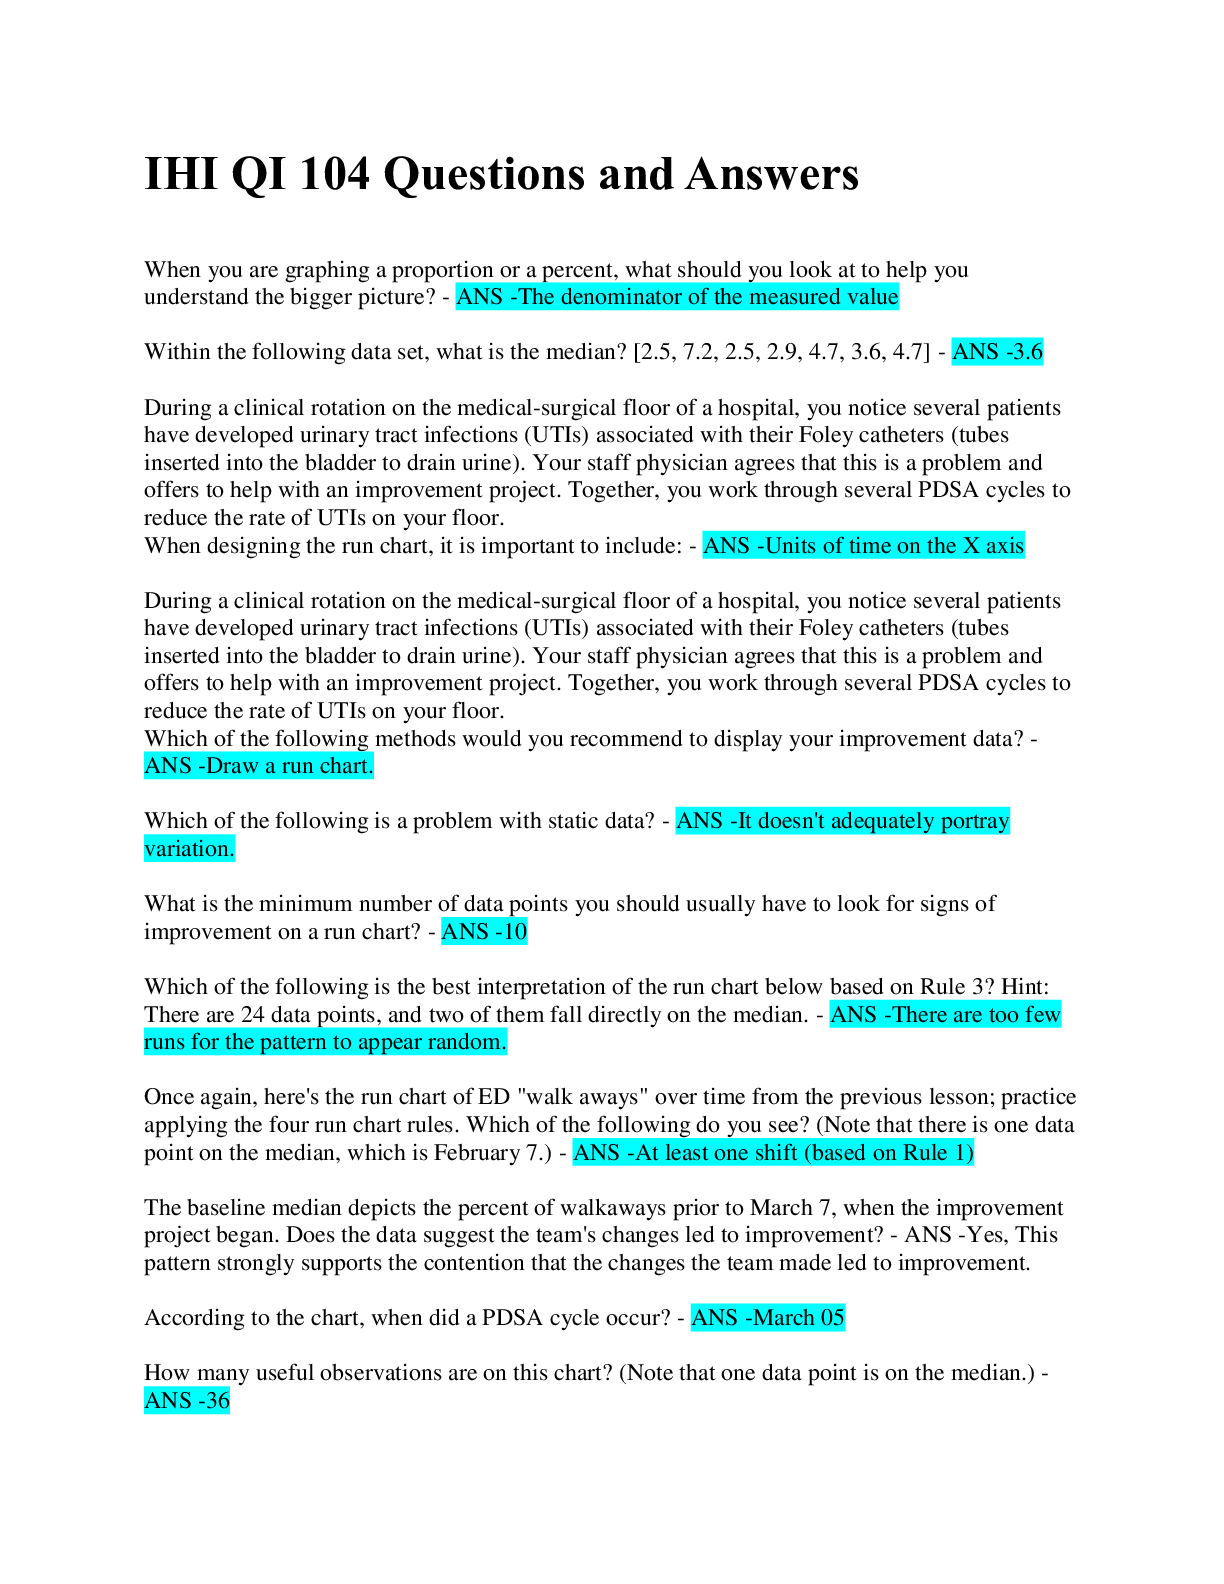
When you are graphing a proportion or a percent, what should you look at to help you understand the bigger picture? - ANS -The denominator of the measured value Within the following data set, what ... is the median? [2.5, 7.2, 2.5, 2.9, 4.7, 3.6, 4.7] - ANS -3.6 During a clinical rotation on the medical-surgical floor of a hospital, you notice several patients have developed urinary tract infections (UTIs) associated with their Foley catheters (tubes inserted into the bladder to drain urine). Your staff physician agrees that this is a problem and offers to help with an improvement project. Together, you work through several PDSA cycles to reduce the rate of UTIs on your floor. When designing the run chart, it is important to include: - ANS -Units of time on the X axis During a clinical rotation on the medical-surgical floor of a hospital, you notice several patients have developed urinary tract infections (UTIs) associated with their Foley catheters (tubes inserted into the bladder to drain urine). Your staff physician agrees that this is a problem and offers to help with an improvement project. Together, you work through several PDSA cycles to reduce the rate of UTIs on your floor. Which of the following methods would you recommend to display your improvement data? - ANS -Draw a run chart. Which of the following is a problem with static data? - ANS -It doesn't adequately portray variation. What is the minimum number of data points you should usually have to look for signs of improvement on a run chart? - ANS -10 Which of the following is the best interpretation of the run chart below based on Rule 3? Hint: There are 24 data points, and two of them fall directly on the median. - ANS -There are too few runs for the pattern to appear random. Once again, here's the run chart of ED "walk aways" over time from the previous lesson; practice applying the four run chart rules. Which of the following do you see? (Note that there is one data point on the median, which is February 7.) - ANS -At least one shift (based on Rule 1) The baseline median depicts the percent of walkaways prior to March 7, when the improvement project began. Does the data suggest the team's changes led to improvement? - ANS -Yes, This pattern strongly supports the contention that the changes the team made led to improvement. According to the chart, when did a PDSA cycle occur? - ANS -March 05 How many useful observations are on this chart? (Note that one data point is on the median.) - ANS -36 [Show More]
Last updated: 1 year ago
Preview 1 out of 2 pages
Instant download
Instant download
Reviews( 0 )
Document information
Connected school, study & course
About the document
Uploaded On
Oct 20, 2022
Number of pages
2
Written in

Additional information
This document has been written for:
Uploaded
Oct 20, 2022
Downloads
0
Views
86