Statistics > QUESTIONS & ANSWERS > Carrying Capacity and Demographics Answer Sheet (All)
Carrying Capacity and Demographics Answer Sheet
Document Content and Description Below
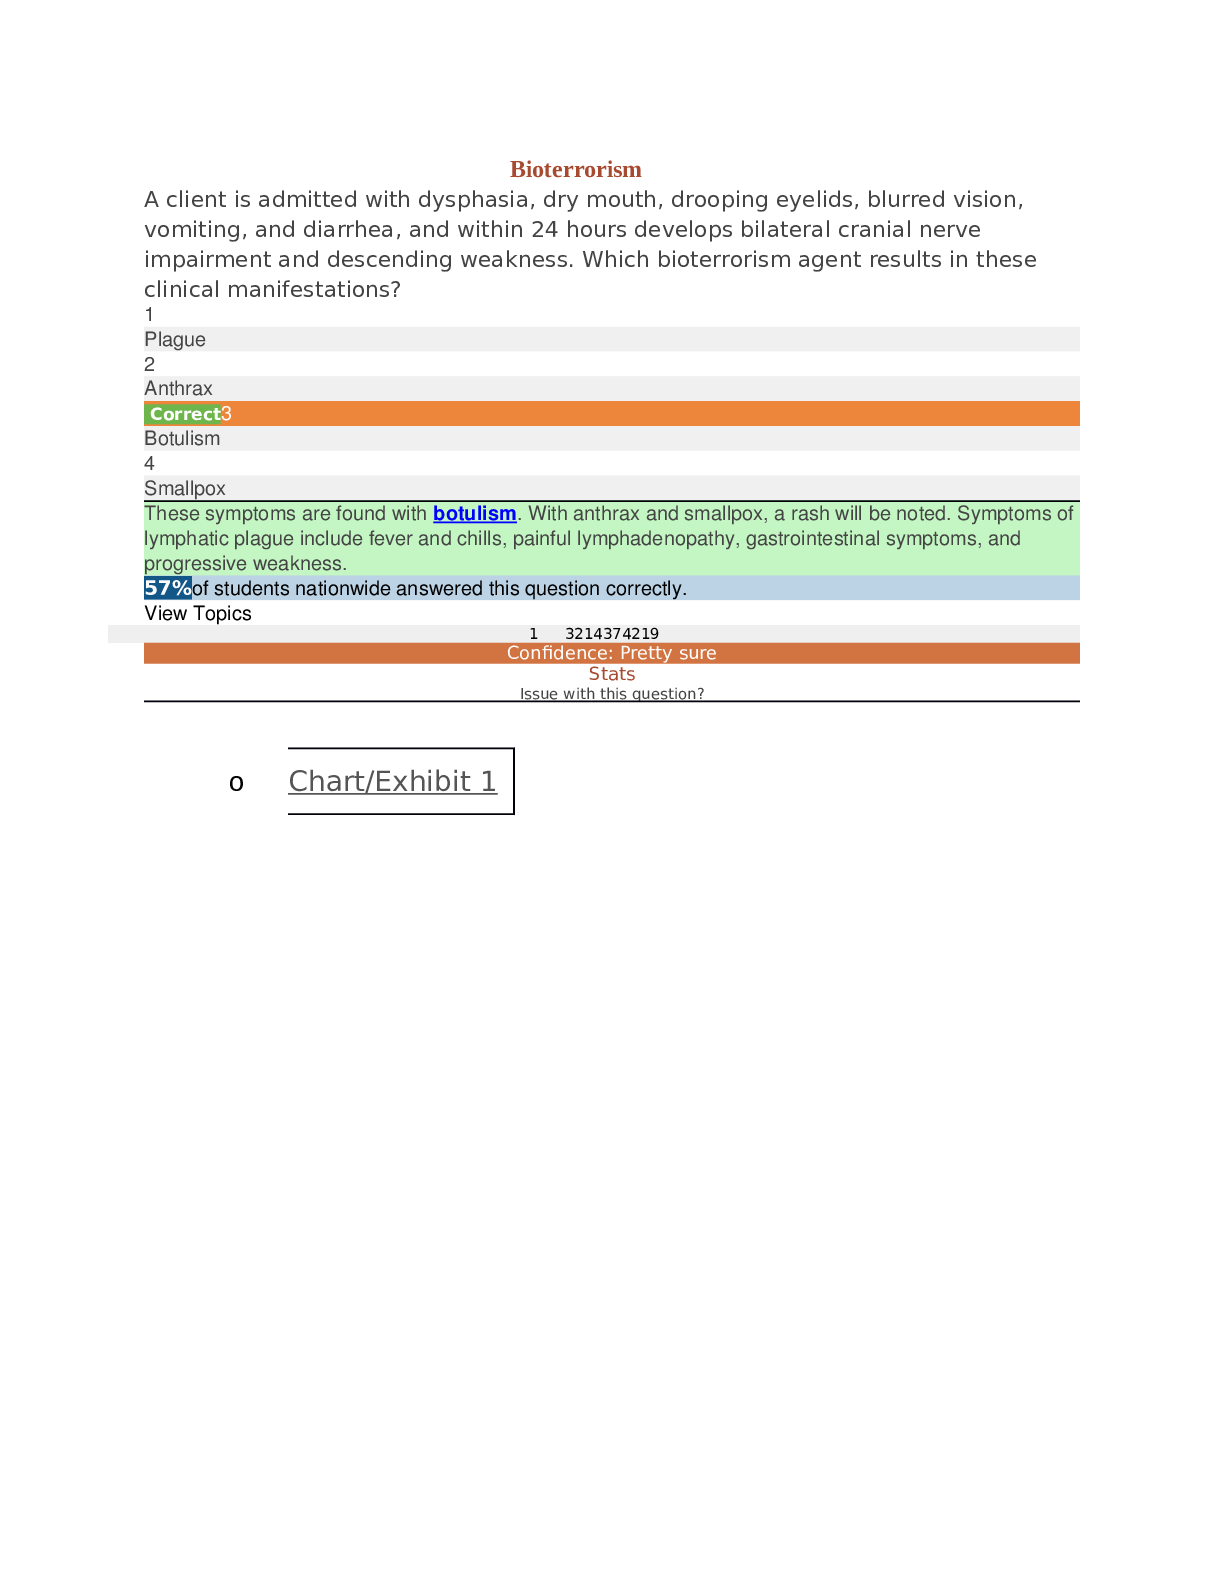
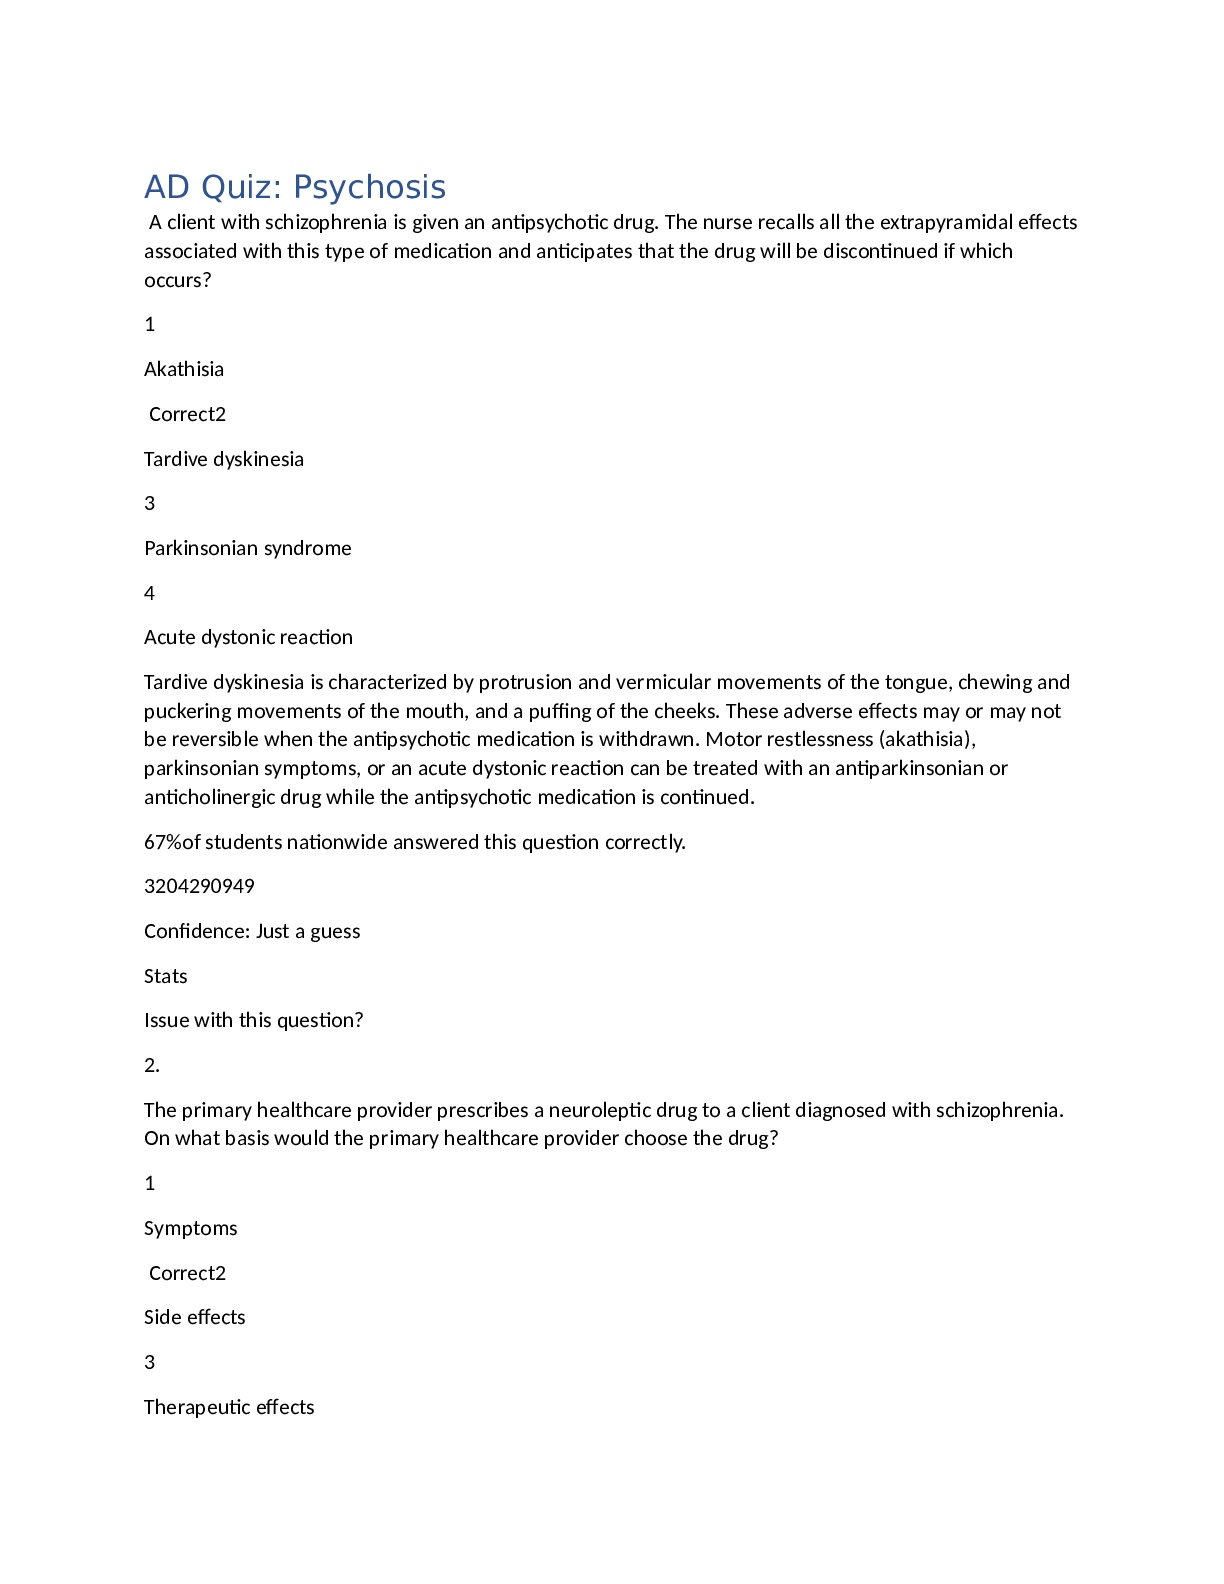
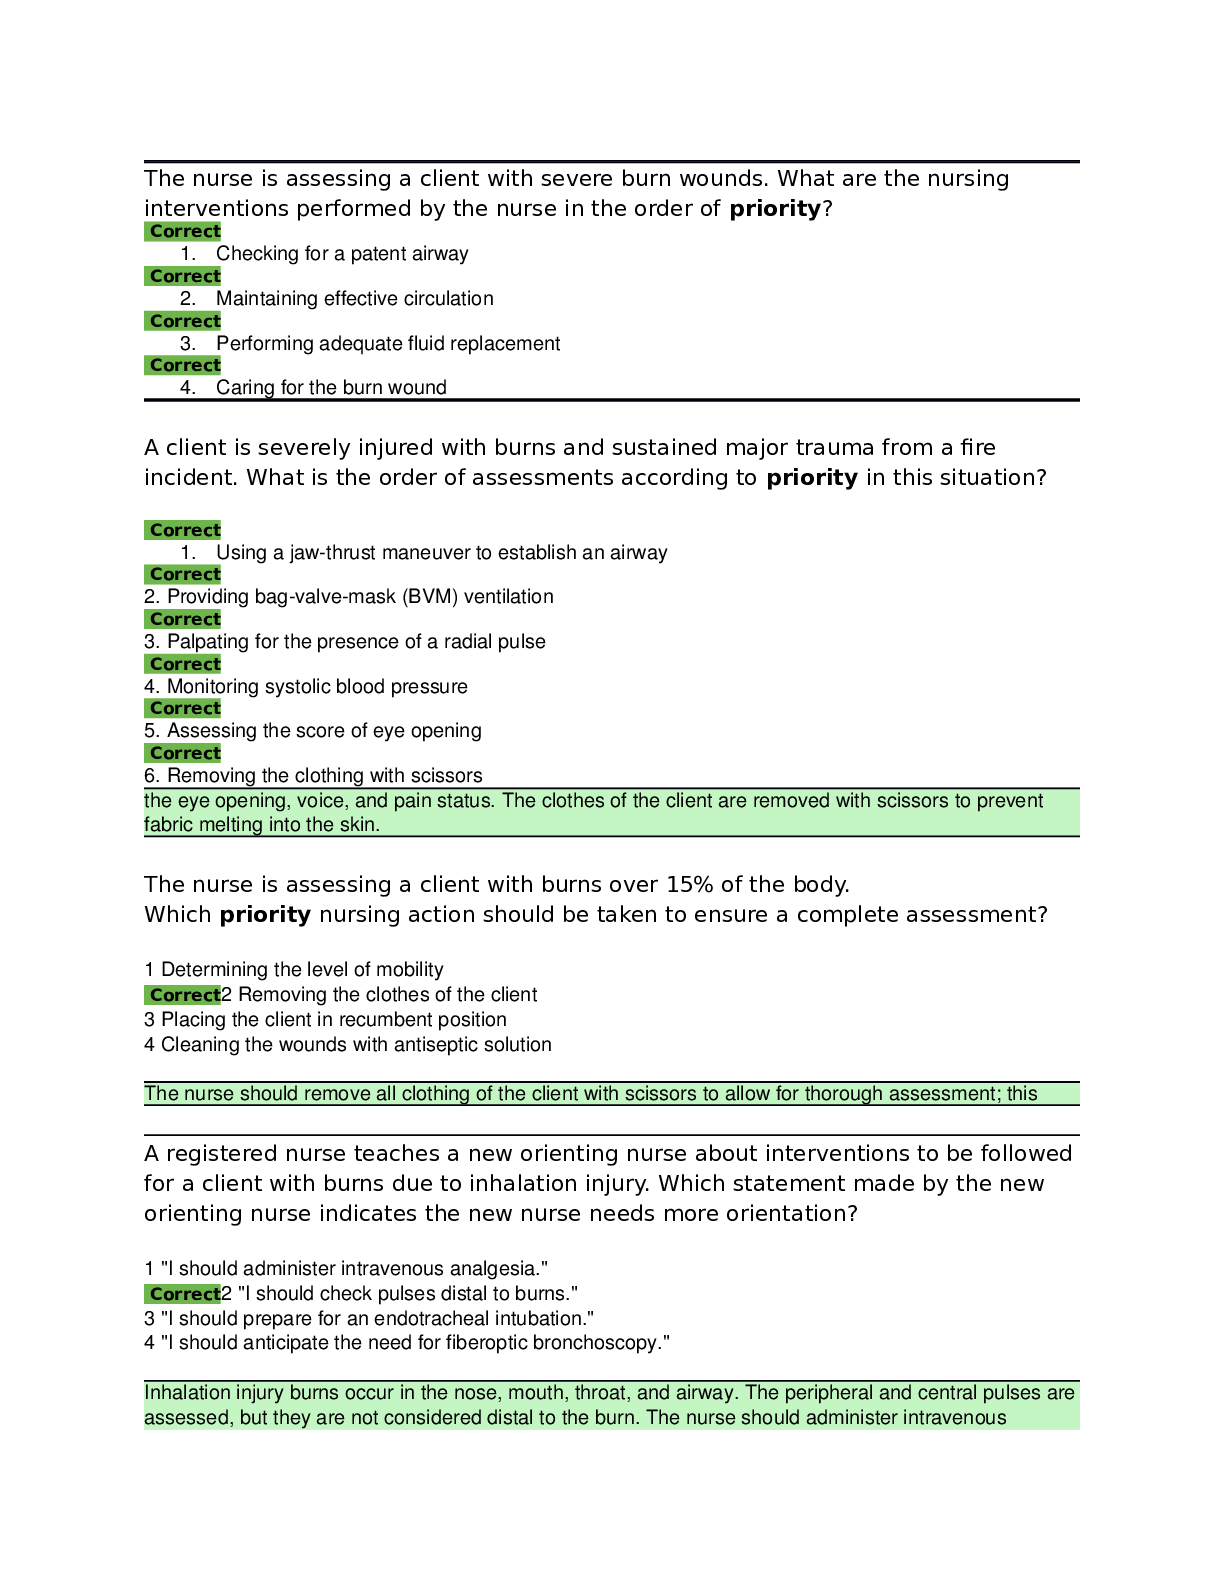
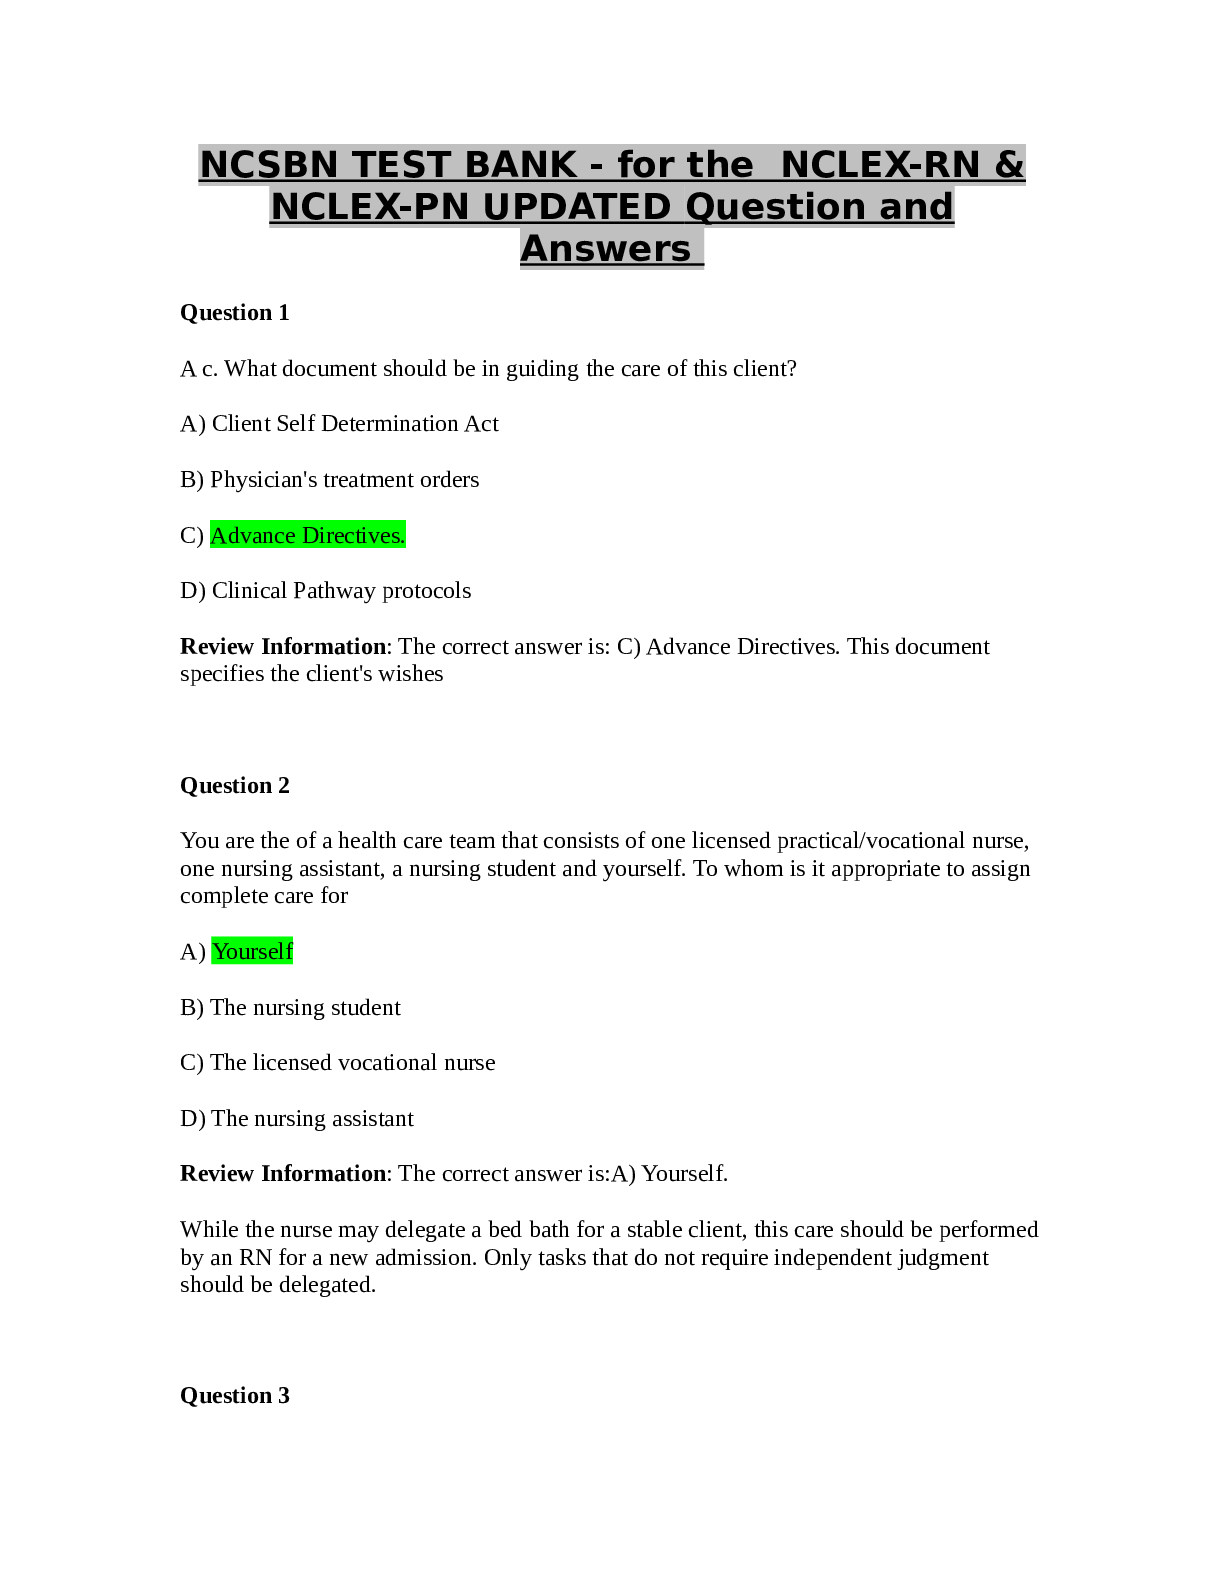
Activity 1 – Simulation without Carry Capacity Data Table 1 Number in Population (N) Time Interval (t) r = 2.0 r = 1.5 r = 0.7 r = 1.0 0 5 5 5 5 1 10 7 3 5 2 20 10 2 5 3 40 15 1 5 4 80 22 0... 5 5 160 33 0 5 Insert the graph for all four values of r. 0 1 2 3 4 5 6 0 20 40 60 80 100 120 140 160 180 Stimulation Without Carrying Capacity r = 2.0 r = 1.5 r = 0.7 r = 1.0 Time Interval Population Number 1. What assumptions does the model in Activity 1 make? Give a real-world example where these assumptions would be true. My assumption is that the higher the rate leads to the population growing larger. Take the rate of 1 for example, this means that people are dying and being born at the same exact time. If there was a small city or community this would be true [Show More]
Last updated: 1 year ago
Preview 1 out of 6 pages

Reviews( 0 )
Document information
Connected school, study & course
About the document
Uploaded On
Apr 27, 2021
Number of pages
6
Written in

Additional information
This document has been written for:
Uploaded
Apr 27, 2021
Downloads
0
Views
32
.png)
.png)
.png)
.png)
.png)

.png)

.png)

.png)
.png)
.png)

.png)