*NURSING > QUESTIONS & ANSWERS > Cumulative Relative Frequency Tables Questions and Explained Answers Graded A+ (All)
Cumulative Relative Frequency Tables Questions and Explained Answers Graded A+
Document Content and Description Below
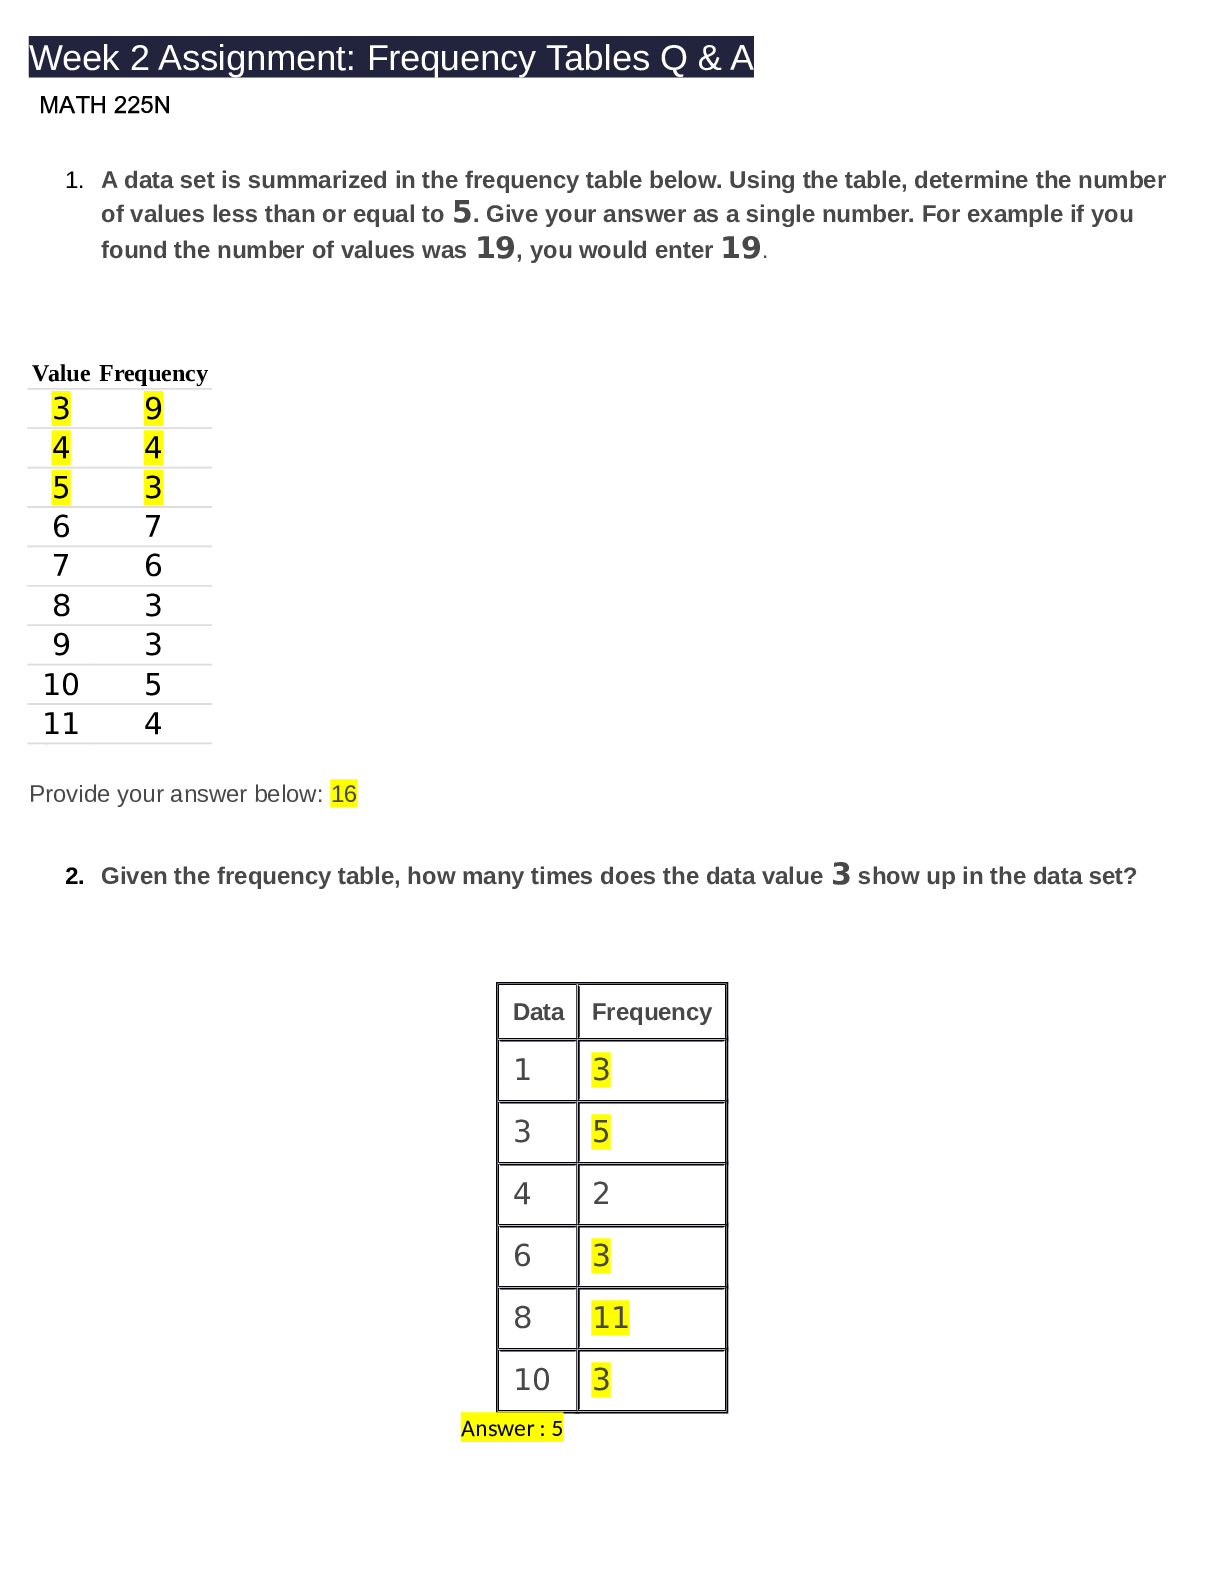
Some background information on Relative Frequency Tables: The Frequency column will be the count of how many times a particular data value appears in the dataset. The Relative Frequency col... umn will be the ratio of the frequency for a certain row to the total frequency. To calculate the Relative Frequency for any row in the table, first add up all of the frequencies for all rows in the table. Then to calculate the relative frequency for a particular row, divide the frequency for that row by the sum of all the frequencies. For example, let's say that the Frequency for a certain row happened to be 10, and the sum of the frequencies for all rows in the table happened to be 50. Then the Relative Frequency for that row will be 1050 which is 0.20. This tells us that that particular row accounted for 20% of all data values. Note that the sum of the Relative Frequency column should be 1. (If percentages are used for Relative Frequency, then the sum of the Relative Frequency column should be 100%). Frequency Tables Frequency Tables Once you have a set of data, you will need to organize it so that you can analyze how frequently each datum occurs in the set. A frequency is the number of times a value of the data occurs. A frequency table is constructed by arranging the data in order from least to greatest with their corresponding frequencies. Here is an example of a frequency table. The left column labeled "Data Value" lists the different numbers of hours students work, and the right column labeled "Frequency" shows how many students work that specific amount of time. Data Value Frequency 2 3 3 5 4 3 5 6 6 2 7 1 From the frequency table, we can see there are 3 students who work 2 hours, 5 students who work 3 hours, and so on. The sum of the values in the frequency column is 20. This represents the total number of students included in the sample. Constructing a Frequency Table From a Set of Data How To Given a set of data, construct a frequency table Step 1: Construct a table with 2 columns. (The left column should show the data values, and the right column should show the frequency of each value in the data set.) Step 2: Order the data values from least to greatest, and write them in the left hand column of the table. Step 3: Count how many times each value shows up in the data set, and put that number in the Frequency column next to the corresponding value. Example: Constructing a Frequency Table Question Sixteen people were asked how many miles (to the nearest mile) they commute to work each day. The data are as follows:2,5,7,3,2,10,18,5,10,10,5,7,13,12,2,5 Construct a frequency table for this data. Hint: For each row in the table, count how many times the data value appears in the data set. This count will be the corresponding frequency for that row. As a doublecheck for the Frequency column, make sure that the sum of the frequency column is the same as the number of data values in the data set. Solution The data is ordered from least to greatest: 2,2,2,3,5,5,5,5,7,7,10,10,10,12,13,18 The data values are recorded in the left column of the frequency table. The number of times each data value appears in the set is the frequency, and is recorded in the right column of the frequency table. Three people drive 2 miles to work. One person drives 3 miles to work. Four people drive 5 miles to work. Two people drive 7 miles to work. Three people drive 10 miles to work. One person drives 12 miles to work. One person drives 13 miles to work. One person drives 18 miles to work. So, the corresponding frequency table for this set of data looks like: Data (miles driven to work) Frequency 2 3 3 1 5 4 7 2 10 3 12 1 13 1 18 1 The sum of the numbers in the right-hand Frequency column represents the total number of data points. Here the sum of the right column is 16, so there are 16 data points represented in this frequency table. A biologist is interested in finding the relationship between the amount of sunlight and the growth rate of sunflowers. Would an experimental or observational study design be more appropriate? Select the correct answer below: An experimental study should be used with the growth rate of the sunflowers as the controlled factor. An observational study should be used because the amount of sunlight cannot be controlled. An experimental study should be used with the amount of sunlight as the controlled factor. An observational study should be used because the growth rate cannot be controlled. A study was performed with a random sample of 200 people from one college. What population would be appropriate for generalizing conclusions from the study, assuming the data collection methods used did not introduce biases? Great work! That's correct. The conclusions should apply to all people in the same country. The conclusions should apply to all people within the same city as the college. The conclusions should apply to people at that particular college. The conclusions should apply to people at any college. The conclusions apply only to the sample. Answer Explanation Correct answer: The conclusions should apply to people at that particular college. The sample should represent people at that college reasonably well because it is not very small and was randomly chosen from all the people there. However, the population of that college is probably not representative of the population in any larger context, so further generalization should not be used. Question In a psychological study aimed at testing a medicine for reducing stress levels, the researcher grouped the participants into 2 groups and gave the stress-reduction pill to one group and a placebo pill to another group. In the description of the above situation, determine the experimental group. Not quite right - check out the answer explanation. The group that received the stress-reduction pill is the experimental group. The group that received the placebo pill is the experimental group. Both the groups are experimental groups. Neither group is an experimental group. Answer Explanation Correct answer: The group that received the stress-reduction pill is the experimental group. The experimental factor is the pill received. The stress-reduction pill is the treatment being tested, so the group receiving that pill is the experimental group. Your answer: The group that received the placebo pill is the experimental group. Question In a study to add a new feature to a software program, the programmer introduced two categories, men and women, in the survey she conducted. Is the study observational or experimental? If it is an experiment, what is the controlled factor? That's incorrect - mistakes are part of learning. Keep trying! The study is an experiment. The controlled factor is the feature to be added in the software. The study is an experiment. The controlled factor is the category, men or women. The study is an observational study. The study is an experiment. The controlled factor is the survey. Answer Explanation Correct answer: The study is an observational study. The samples are chosen using an appropriate process; however, no attempt is made to control any aspect of the sample even though the variables of interest are recorded for each group. Your answer: The study is an experiment. The controlled factor is the feature to be added in the software. uestion A researcher is interested in the effects of watching videos just before bed on the quality of sleep. He has decided to test the claim "Watching 1 hour of video just before going to bed reduces the number of minutes of REM sleep by more than 10%. " Which of the following data collection processes would be appropriate? Select only one answer choice. Perfect. Your hard work is paying off � Choose a random sample of people and ask them how many hours of video they watched last night and how much REM sleep they had. Choose a random sample of people. Randomly select half of them and have them watch one hour of video just before going to bed, and then monitor their sleep. Have the other half not watch any video and monitor their sleep. Choose a random sample of people. On multiple randomly selected nights, randomly assign each person to either watch one hour of video or not watch video and monitor their sleep. Choose a random sample of people. On multiple randomly selected nights, measure the amount of video they watch and monitor their sleep. Answer Explanation Correct answer: Choose a random sample of people. On multiple randomly selected nights, randomly assign each person to either watch one hour of video or not watch video and monitor their sleep. To perform an experiment, a control group that does not watch video and a test group that does should be used. It is also important for the process to account for possible confounding variables. In this case both the person and the night of the week could be confounding variables. By choosing random nights and having the same people either watch 1 hour of videos or not, variations due to the person and the night of the week should not interfere with the analysis. FEEDBACK Question A research team is testing on a product that will minimize wrinkles among women. Volunteers in the age group of 40 to 45 are included in the research. The research team gives a bottle of the solution to one group and a similar bottle of solution with no ingredients intended to lessen wrinkles to the other group. In the description of the above situation, determine the experimental group. Not quite - review the answer explanation to help get the next one. The group that received the bottle of solution is the experimental group. The group that received the bottle of solution that did not contain the ingredients that are meant to lessen wrinkles is the experimental group. Both the groups are experimental groups. Neither group is an experimental group. Answer Explanation Correct answer: The group that received the bottle of solution is the experimental group. In the situations given here, the kind of solution given is the experimental factor. The experimental group is the group that receives the solution with the active ingredients. Your answer: The group that received the bottle of solution that did not contain the ingredients that are meant to lessen wrinkles is the experimental group. Question A consumer research company is interested in determining if a certain company's new refrigerator model is more efficient than the older model. Researchers decide to investigate the claim that the new model uses 10% less electricity than the older model for the same cooling load. To collect data, the company obtains 20 random refrigerators for each model. They are all placed in one building well separated from each other and are loaded with 50 bottles of water. The electricity usage is monitored for one month. How can the results be generalized? Not quite - review the answer explanation to help get the next one. The conclusions should be applicable to any unit of the new model as compared to any unit of the old model. The conclusions should be applicable to all refrigerators made by the same manufacturer. The conclusions only apply to the sample that was obtained for the new models as compared to the sample that was obtained for the old model. The conclusions should be valid for new model refrigerators from any manufacturer. Answer Explanation Correct answer: The conclusions should be applicable to any unit of the new model as compared to any unit of the old model. Since the samples were randomly obtained for both the new and old models in question, the results should apply to both the new and old model refrigerator that was studied. The conclusions should then generalize to any unit of the new and old models. Your answer: The conclusions only apply to the sample that was obtained for the new models as compared to the sample that was obtained for the old model. Question A study was performed with a random sample of 5 people from a certain city. What population would be appropriate for generalizing conclusions from the study, assuming the data collection methods used did not introduce biases? That's incorrect - mistakes are part of learning. Keep trying! The conclusions should be restricted to only the city that was sampled. The conclusions are generalizable to all people on Earth. The conclusions are generalizable to all people in the country. The conclusions apply only to the sample. The conclusions apply to people in any city. Answer Explanation Correct answer: The conclusions apply only to the sample. The sample size is very small, so it is not likely to be representative of the city or any larger population [Show More]
Last updated: 1 year ago
Preview 1 out of 46 pages

Buy this document to get the full access instantly
Instant Download Access after purchase
Add to cartInstant download
We Accept:

Reviews( 0 )
$12.00
Document information
Connected school, study & course
About the document
Uploaded On
Aug 02, 2021
Number of pages
46
Written in

Additional information
This document has been written for:
Uploaded
Aug 02, 2021
Downloads
0
Views
72
.png)
.png)
.png)
.png)
.png)
.png)
.png)
.png)
.png)
.png)
.png)

.png)
.png)