Statistics > QUESTIONS & ANSWERS > Grand Canyon University - HLT 362V HLTV Exercise 16 & 17 All Graded A+ (All)
Grand Canyon University - HLT 362V HLTV Exercise 16 & 17 All Graded A+
Document Content and Description Below
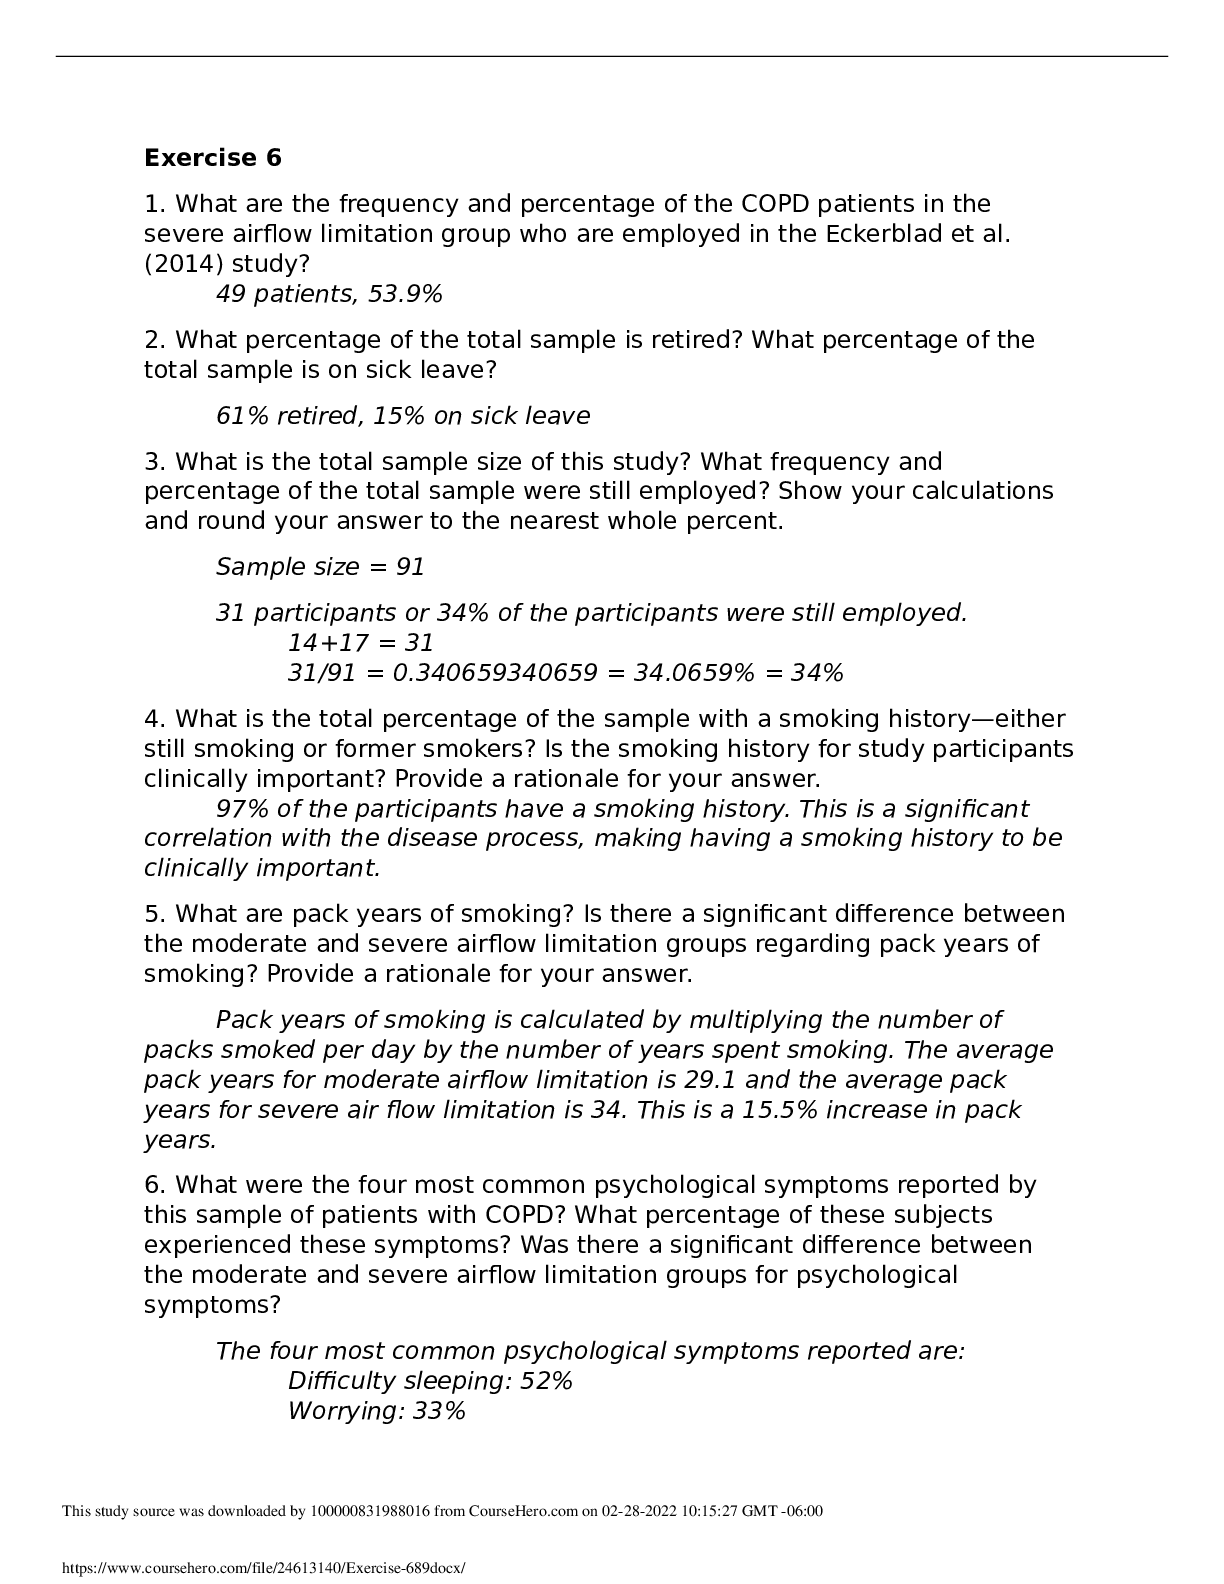
Exercise 16 1. What do degrees of freedom ( df ) mean? Canbulat et al. (2015) did not provide the df s in their study. Why is it important to know the df for a t ratio? Using the df formula, calcula... te the df for this study. Degrees of freedom represents the numbers that can vary in a given stastistical sample. For example, if a population of 10 people had a mean height of 5 feet, 9 out of the 10 people could have any height, but the 10th person would have to have a height that makes the mean equal to 5 feet. Thus there would be 9 degrees of freedom for that example. By knowing the df to a t ratio, one can look at a t-distribution table to find out whether the data is significant for a given alpha value. The degrees of freedom for the Canbulat study is 174, that is because there were 176 subjects, and two means being compared, so you subtract 1 for each mean. 2. What are the means and standard deviations ( SD s) for age for the Buzzy intervention and control groups? What statistical analysis is conducted to determine the difference in means for age for the two groups? Was this an appropriate analysis technique? Provide a rationale for your answer. For the Buzzy group, age was 8.25 +/- 1.51 SDs, for the control group, age was 8.61 +/- 1.69 SDs. The statistical analysis used to determine the difference in means is a t-test. This was an appropriate test because t-tests compare the means of two data sets for significance. This is unlike a z-test, which looks at proportions. 3. What are the t value and p value for age? What do these results mean? The t value is -1.498, and the p value is .136. Both these results mean that there is no statistically significant difference between the mean ages of both groups. 4. What are the assumptions for conducting the independent samples t -test? The assumptions are: the variable measured is on a continuous or ordinal scale; the sample is random; the data when plotted is in a normal distribution; the sample size is large enough; and there is homogeneity of variance. 5. Are the groups in this study independent or dependent? Provide a rationale for your answer. The groups are independent because different children were used in each study. Each test was conducted independently of the control. If it were a dependent study, each child would receive both treatments. 6. What is the null hypothesis for procedural self-reported pain measured with the Wong Baker Faces Scale (WBFS) for the two groups? Was this null hypothesis accepted or rejected in this study? Provide a rationale for your answer. The null hypothesis would be that there is no difference in self-reported pain measured with the Wong Baker Faces Scale. The null hypothesis was rejected because the t value was -6.498, and the p was < 0.0001. Additionally just by looking at the means and standard deviations you can see a significant difference. 7. Should a Bonferroni procedure be conducted in this study? Provide a rationale for your answer. A Bonferroni procedure is done when multiple hypotheses are being tested and there is the probability that a Type I error may occur simply by chance. Since this study does not have many hypotheses being tested, a Bonferroni procedure is not necessary. 8. What variable has a result of t = − 6.135, p = 0.000? What does the result mean? This variable result is from the Parent reported index of pain perceived by the child. This is what the parent believed their child’s anxiety level was for each control group. The data shows a significant difference between the Buzzy group and the control group. 9. In your opinion, is it an expected or unexpected finding that both t values on Table 2 were found to be statistically significant. Provide a rationale for your answer. I think it is an expected finding that both t values were significant in Table 2. The use of Buzzy distracted the children from the actual IV insertion procedure and reduced their self-reported pain on two different rating scales for pain. 10. Describe one potential clinical benefit for pediatric patients to receive the Buzzy intervention that combined cold and vibration during IV insertion. One potential clinical benefit for pediatric patients is that the Buzzy intervention will make IV insertion less traumatizing for children. Many children are afraid of needles and their apprehension makes IV insertion even more difficult. This intervention could make the whole procedure less troublesome for the patient and the practitioner. Exercise 17 1. What are the assumptions for conducting a paired or [Show More]
Last updated: 1 year ago
Preview 1 out of 5 pages
Instant download

Buy this document to get the full access instantly
Instant Download Access after purchase
Add to cartInstant download
Reviews( 0 )
Document information
Connected school, study & course
About the document
Uploaded On
Feb 28, 2022
Number of pages
5
Written in

Additional information
This document has been written for:
Uploaded
Feb 28, 2022
Downloads
0
Views
71
.png)
.png)
.png)
.png)
.png)
.png)
.png)
.png)
.png)
.png)
.png)


.png)


.png)