Statistics > QUESTIONS & ANSWERS > Sophia Statistics Unite 4 Milestone Questions and Answers Already Passed (All)
Sophia Statistics Unite 4 Milestone Questions and Answers Already Passed
Document Content and Description Below
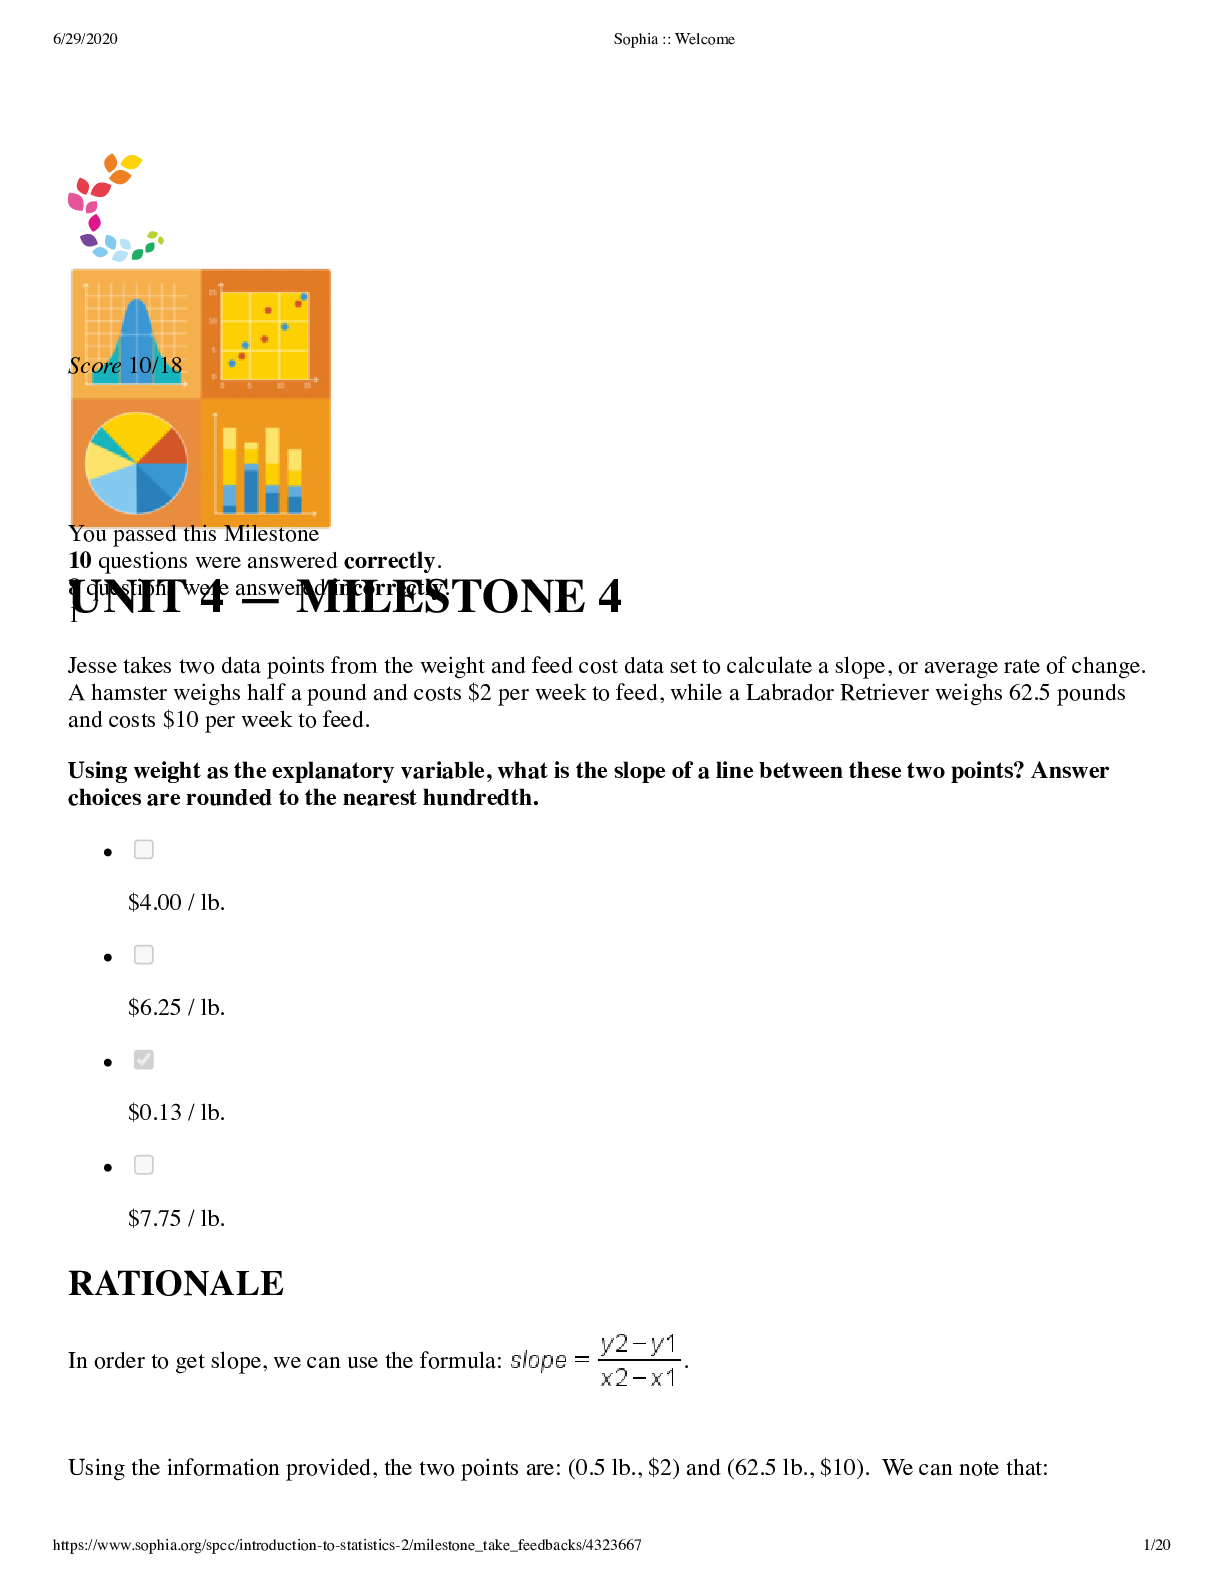
You passed this Milestone 10 questions were answered correctly. 8 questions were answered incorrectly. 1 Jesse takes two data points from the weight and feed cost data set to calculate a slope, or... average rate of change. A hamster weighs half a pound and costs $2 per week to feed, while a Labrador Retriever weighs 62.5 pounds and costs $10 per week to feed. Using weight as the explanatory variable, what is the slope of a line between these two points? Answer choices are rounded to the nearest hundredth. $4.00 / lb. $6.25 / lb. $0.13 / lb. $7.75 / lb. RATIONALE In order to get slope, we can use the formula: . Using the information provided, the two points are: (0.5 lb., $2) and (62.5 lb., $10). We can note that: 6/29/2020 Sophia :: Welcome https://www.sophia.org/spcc/introduction-to-statistics-2/milestone_take_feedbacks/4323667 2/20 CONCEPT Linear Equation Algebra Review 2 Brad reads a scatterplot that displays the relationship between the number of cars owned per household and the average number of citizens who have health insurance in neighborhoods across the country. The plot shows a strong positive correlation. Brad recalls that correlation does not imply causation. In this example, Brad sees that increasing the number of cars per household would not cause members of his community to purchase health insurance. Identify the lurking variable that is causing an increase in both the number of cars owned and the average number of citizens with health insurance. The number of different car brands The number of citizens in the United States who do not have health insurance Average health insurance costs in the United States Average annual salary per household RATIONALE Recall that a lurking variable is something that must be related to the outcome and explanatory variable that when considered can help explain a relationship between 2 variables. Since higher income is positively related to owning more cars and having health insurance, this variable would help explain why we see this association. CONCEPT Correlation and Causation 3 Two bags each contain tickets numbered 1 to 10. John draws a ticket from each bag five times, replacing the tickets after each draw. He records the number on the ticket for each draw from both the bags: Bag 1 Bag 2 6/29/2020 Sophia :: Welcome https://www.sophia.org/spcc/introduction-to-statistics-2/milestone_take_feedbacks/4323667 3/20 Draw 1 2 4 Draw 2 4 5 Draw 3 1 3 Draw 4 6 4 Draw 5 7 9 For the the first bag, the mean is 4 and the standard deviation is 2.5. For the second bag, the mean is 5 and the standard deviation is 2.3. Using the formula below or Excel, find the correlation coefficient, r, for this set of tickets John drew. Answer choices are rounded to the nearest hundredth. 0.75 0.70 0.50 0.56 RATIONALE In order to get the correlation, we can use the formula: Correlation can be quickly calculated by using Excel. Enter the values and use the function "=CORREL(". 6/29/2020 Sophia :: Welcome https://www.sophia.org/spcc/introduction-to-statistics-2/milestone_take_feedbacks/4323667 4/20 CONCEPT Correlation 4 Shawna finds a study of American women that has an equation to predict weight (in pounds) from height (in inches): ŷ = -260 + 6.6x. Shawna's mom’s height is 68 inches and her weight is 179 pounds. What is the residual of weight and height for Shawna's mom? [Show More]
Last updated: 1 year ago
Preview 1 out of 20 pages
Instant download
Instant download
Reviews( 0 )
Document information
Connected school, study & course
About the document
Uploaded On
Jun 23, 2022
Number of pages
20
Written in

Additional information
This document has been written for:
Uploaded
Jun 23, 2022
Downloads
0
Views
142
.png)
.png)
.png)
.png)
.png)
.png)
.png)
.png)
.png)
.png)
.png)

.png)

.png)
.png)


.png)
