Statistics > SOPHIA Milestone > STATISTICS 501Unit 2 - Milestone 2 required to ace your tests (All)
STATISTICS 501Unit 2 - Milestone 2 required to ace your tests
Document Content and Description Below
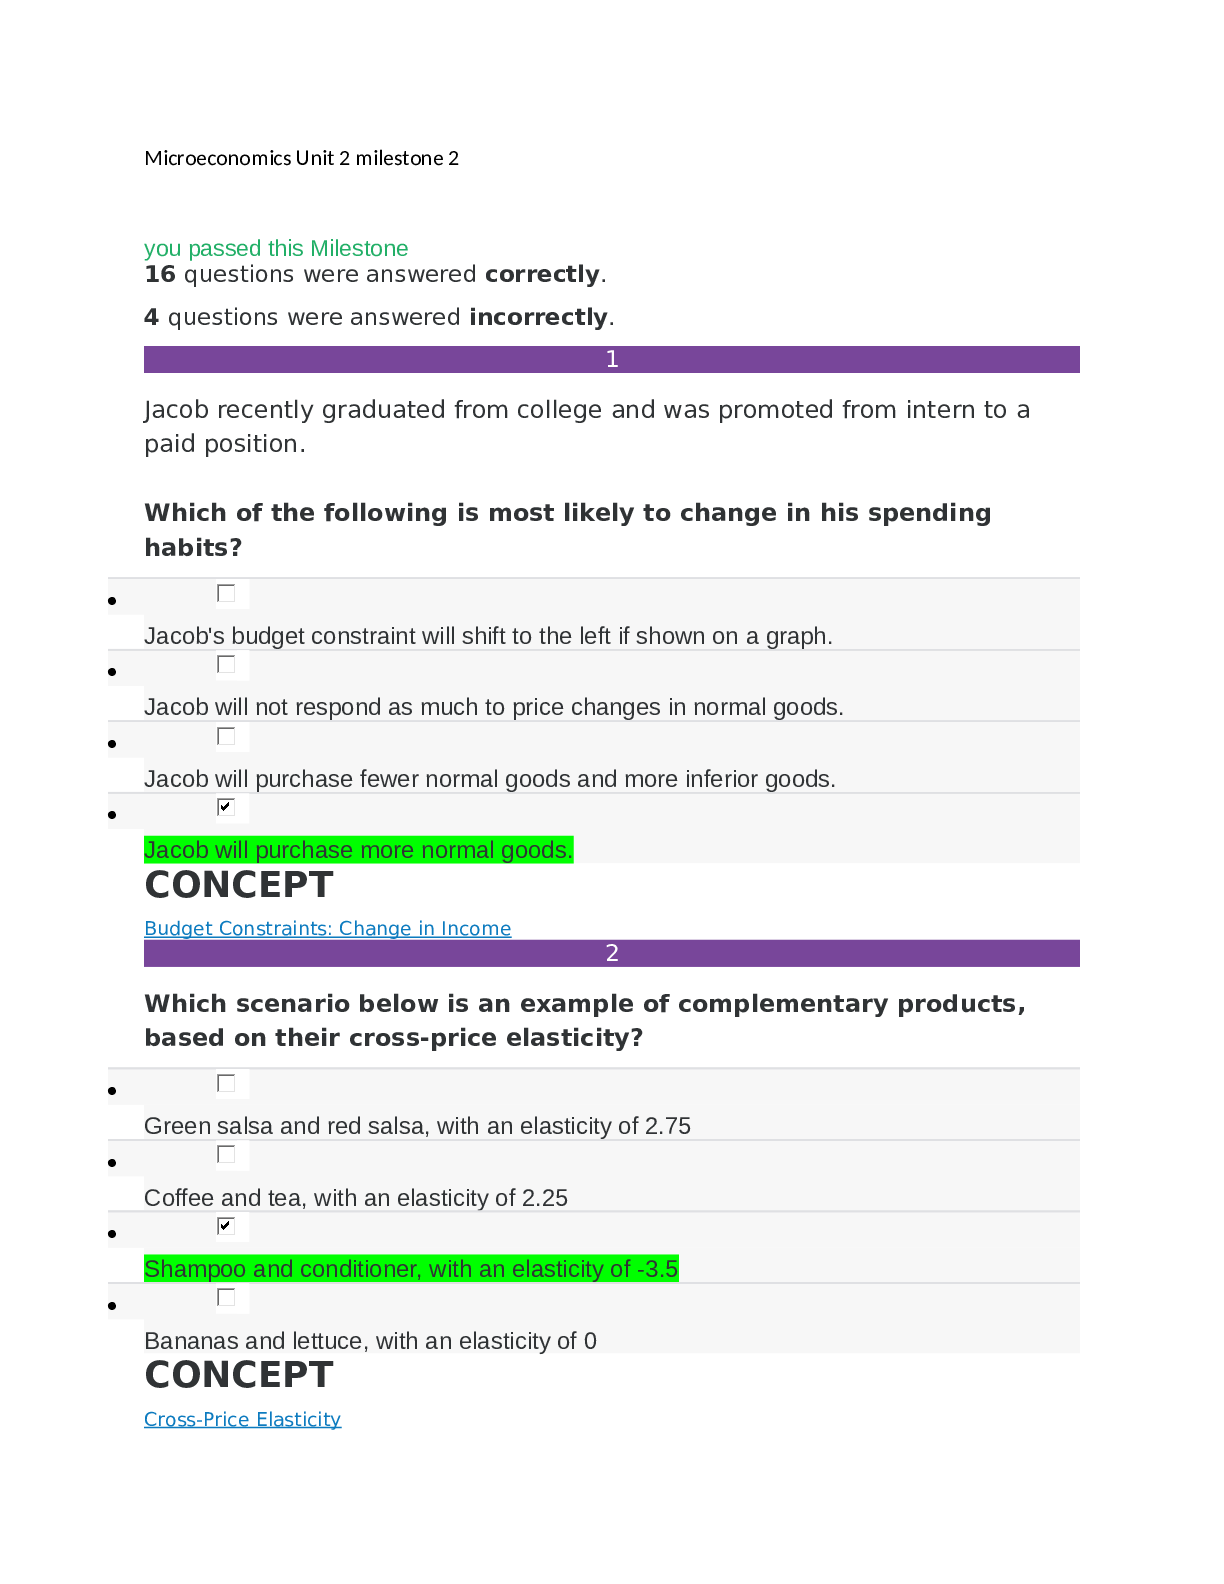
Dave drives to work. While driving the car over nine days, he observes his daily average speed and lists it in the table below. Day Average Speed (MPH) 1 45 2 62 3 44 4 70 5 59 6 66 7 54 8 ... 63 9 67 The median speed at which Dave drove to work was __________. RATIONALE To get the median we first order the data and take the middle value. The ordered values are: Since there are an odd number (n=9) of values we simply take the middle, which is 62 mph. One week, Rachel earned $250. She spent $120 on food, $30 on miscellaneous items, and saved the rest. If Rachel makes a pie chart showing how she spends her money, the central angle for the food sector would be __________. RATIONALE Recall that to get the angle for something in a pie chart we use the following formula: So in this case, the central angle for the food sector would be: Naomi weighed 50 patients for a medical study using a scale that measures to the nearest whole pound. She then calculated the mean weight as 176 pounds, with a standard deviation of 12 pounds. If the distribution is normal, what percent of the data lies between 140 pounds and 212 pounds? RATIONALE Recall that if the data is normal, then the 68-95-99.7 rule applies which states that 68% of all data points fall within one standard deviation of the mean, 95% of all data points fall within two standard deviations of the mean, and 99.7% of all data points fall within three standard deviations of the mean. 140 pounds and 212 pounds are both 36 pounds from the mean of 176 pounds, which is the same as three standard deviations (12 pounds * 3) in either direction. This tells us that 99.7% of the data should lie between 140 cm to 212 cm. Which of the following statements is true for an outlier? RATIONALE To find an outlier we note the lower bound and upper bound for outliers are Q1 - 1.5IQR and Q3 + 1.5IQR respectively. At Brent's school, the final grade for his U.S. History course is weighted as follows: Tests: 30% Quizzes: 50% Homework: 20% Brent has an average of 82% on his tests, 94% on his quizzes, and 50% on his homework. What is Brent's weighted average? RATIONALE In order to get the weighted average we use the following formula: Select the statement that is FALSE. RATIONALE If we recall, the range is the maximum value minus the minimum value. Suppose in a given dataset, the maximum value is 20 and the minimum value is -5. Then the range is equal to: The range of 25 is larger than the maximum value of 20, so the range can certainly be larger than the max value. Jerry, Stein, Johnson, and Mary had a competition to see who could profit the most off of their odd jobs during the summer. They discussed their earnings on the first day of school. Afterwards, each of them decided to make bar graphs to plot the different amounts they earned. Who made the above graph, and why? RATIONALE Since there was a competition, the person who most likely made this graph would want to represent themselves favorably. Since Stein has the most sales, it would probably be Stein. The manager went over the sales of mobile phones at the store and found that the mean sale was 45, with a standard deviation of 4. On a particular day, 52 mobile phones were sold. What is the z-score of the sale of mobile phones on that day? RATIONALE Recall that the z-score can be calculated with the following formula: The given value is 52 phones, the mean is 45 phones, and the standard deviation is 4 phones. Plug these values in to get the following z-score: This also tells us that 52 is 1.75 z-scores or standard deviations above the mean. Ralph records the time it takes for each of his classmates to run around the track one time. As he analyzes the data on the graph, he locates the mean and median time. Which component of data analysis is Ralph utilizing? RATIONALE Recall that the mean and median are measures of center. So by examining this, Ralph is looking at the center of the data. Select the false statement about standard deviation. RATIONALE Recall that the standard deviation (SD) is equal to the square root of the variance and the variance is the average of the squared distances from the mean. So, the standard deviation is the average distance to the mean. Consider this histogram showing the number of students in grade five who have one or more pets. What is the difference in the number of students with the most and least numbers of pets? RATIONALE The most number of pets is 10 and there is 1 person who has this many pets. The least number of pets is 1 and there are 5 people with 1 pet. So the difference in the number of people would be: The percent-change graph in the figure shows the change in Gross Domestic Product (GDP) from 2008-2012. Which segment of the graph indicates the greatest increase in GDP growth? RATIONALE Since the graph shows growth rate, the greatest growth rate will be the segment with the greatest slope that is positive. This is at segment B, where the growth rate increases from -0.5 to 2. The first quartile (Q1) value from the above box plot is __________. RATIONALE Note the value for Q1 is the left edge of the box, which is 47. Let x stand for the length of an individual screw. 100 screws were sampled at a time. The population mean is 2.5 inches and the population standard deviation is 0.2 inches. What is the mean of the sampling distribution of sample means? RATIONALE The mean of the sampling distribution should be the same as the population mean, which is 2.5. This chart shows the number of students of different age groups who participated in a quiz. Which of the following statements about the stack plot is true? RATIONALE If we note that the greatest area for the girls is the longest darker region, this occurs in the age group 17-19. The dotplot below shows the number of songs Carly downloaded over 15 successive weekends. What is the greatest number of songs downloaded? RATIONALE The dotplot is a number line that shows the number of items at each value, which is designated with an X. So the largest value we can see is at 10. The difference between the standard deviation and the variance of a standard normal distribution is __________. RATIONALE Recall the variance and standard deviation of a standard normal are both 1, so the difference is 0. Consider the times (in seconds) that it took children and adults to solve a Rubik’s cube at a competition. What does the circled section represent? RATIONALE If we recall that the stem and leaf can give us the actual values in the dataset, then the circle corresponds to 71 and 72. We can then note that there are 2 children who solved the Rubik's cube at 71 and 72 second [Show More]
Last updated: 1 year ago
Preview 1 out of pages

Reviews( 0 )
Document information
Connected school, study & course
About the document
Uploaded On
May 21, 2021
Number of pages
Written in

Additional information
This document has been written for:
Uploaded
May 21, 2021
Downloads
0
Views
1