Statistics > SOPHIA Milestone > Statistics Unit 5 Milestone Course Hero.pdf. QUESTIONS WITH ACCURATE ANSWERS. RATED A+ (All)
Statistics Unit 5 Milestone Course Hero.pdf. QUESTIONS WITH ACCURATE ANSWERS. RATED A+
Document Content and Description Below
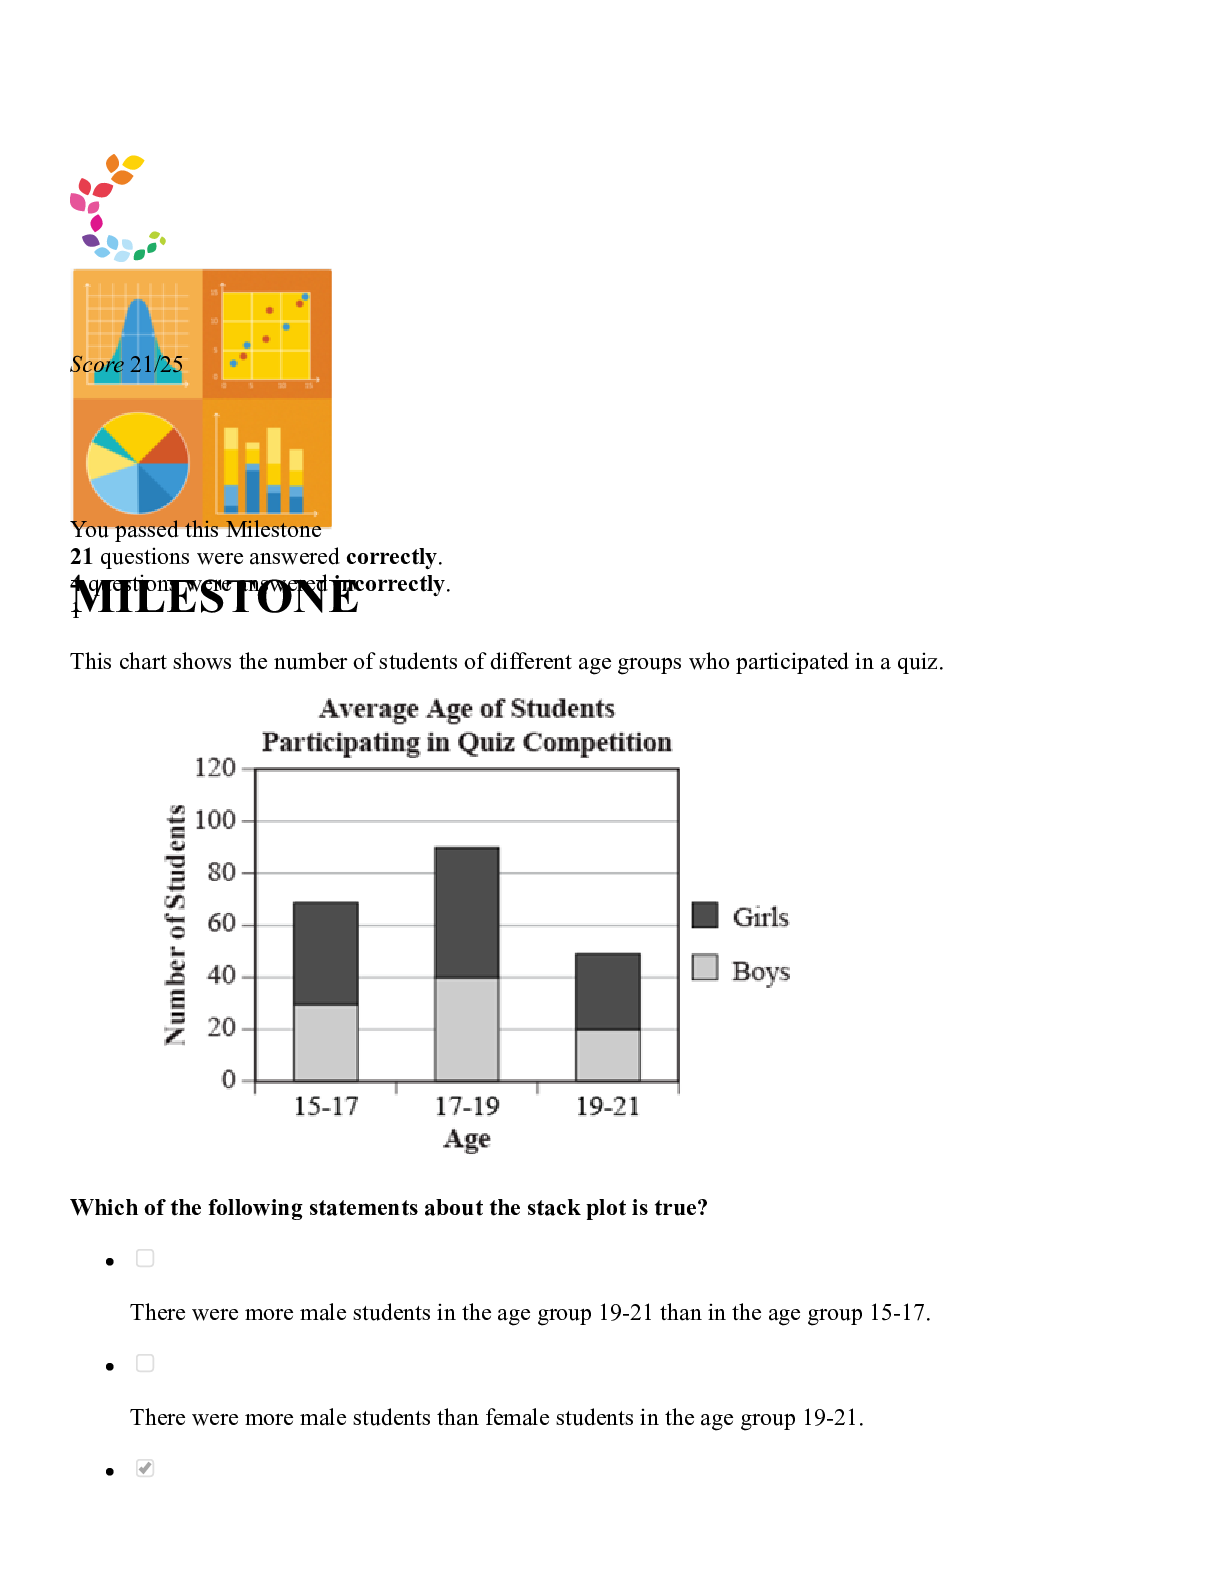
You passed this Milestone 19 questions were answered correctly. 5 questions were answered incorrectly. 1 Joe is measuring the widths of doors he bought to install in an apartment complex. He measu... red 72 doors and found a mean width of 36.1 inches with a standard deviation of 0.3 inches. To test if the doors differ significantly from the standard industry width of 36 inches, he computes a z-statistic. What is the value of Joe's z-test statistic? 2.83 -1.81 -2.83 1.81 RATIONALE 6/29/2020 Sophia :: Welcome https://www.sophia.org/spcc/introduction-to-statistics-2/milestone_take_feedbacks/4324532 2/22 If we first note the denominator of Then, getting the z-score we can note it is This tells us that 36.1 is 2.83 standard deviations above the value of 36. Note that when you round some values you may get slightly different results, but the results should be relatively close to this final calculated value. CONCEPT Z-Test for Population Means 2 Emile has calculated a one-tailed z-statistic of -1.97 and wants to see if it is significant at the 5% significance level. What is the critical value for the 5% significance level? Answer choices are rounded to the hundredths place. -2.33 0 -1.04 -1.64 RATIONALE Recall that when a test statistic is smaller than in a left-tailed test we would reject Ho. The closest value to 5%, or 0.05, in the table would be between 0.0505 and 0.495. 0.0505 corresponds with a z-score of -1.64 0.0495 corresponds with a z-score of -1.65. We need to calculate the average of the two z-scores to get a z-score of -1.645. CONCEPT How to Find a Critical Z Value 3 6/29/2020 Sophia :: Welcome https://www.sophia.org/spcc/introduction-to-statistics-2/milestone_take_feedbacks/4324532 3/22 What do the symbols , , and represent? Variables of interest Defined variables Population parameters Sample statistics RATIONALE Recall that is the sample proportion, is the sample mean, and is the sample standard deviation. Since all of these come from samples they are statistics. CONCEPT Sample Statistics and Population Parameters 4 A coin is tossed 50 times, and the number of times heads comes up is counted. Which of the following statements about the distributions of counts and proportions is FALSE? The distribution of the count of getting heads can be approximated with a normal distribution. The distribution of the count of getting tails can be approximated with a normal distribution. The count of getting heads is a binomial distribution. The count of getting heads from a sample proportion of size 20 can be approximated with a normal [Show More]
Last updated: 1 year ago
Preview 1 out of 22 pages
Reviews( 0 )
Document information
Connected school, study & course
About the document
Uploaded On
Mar 30, 2022
Number of pages
22
Written in

Additional information
This document has been written for:
Uploaded
Mar 30, 2022
Downloads
0
Views
47