Statistics > SOPHIA Milestone > SOPHIA_INTRO TO STATISTICS_UNIT 5_MILESTONE.pdf. QUESTIONS WITH RATIONALE ANSWERS (All)
SOPHIA_INTRO TO STATISTICS_UNIT 5_MILESTONE.pdf. QUESTIONS WITH RATIONALE ANSWERS
Document Content and Description Below
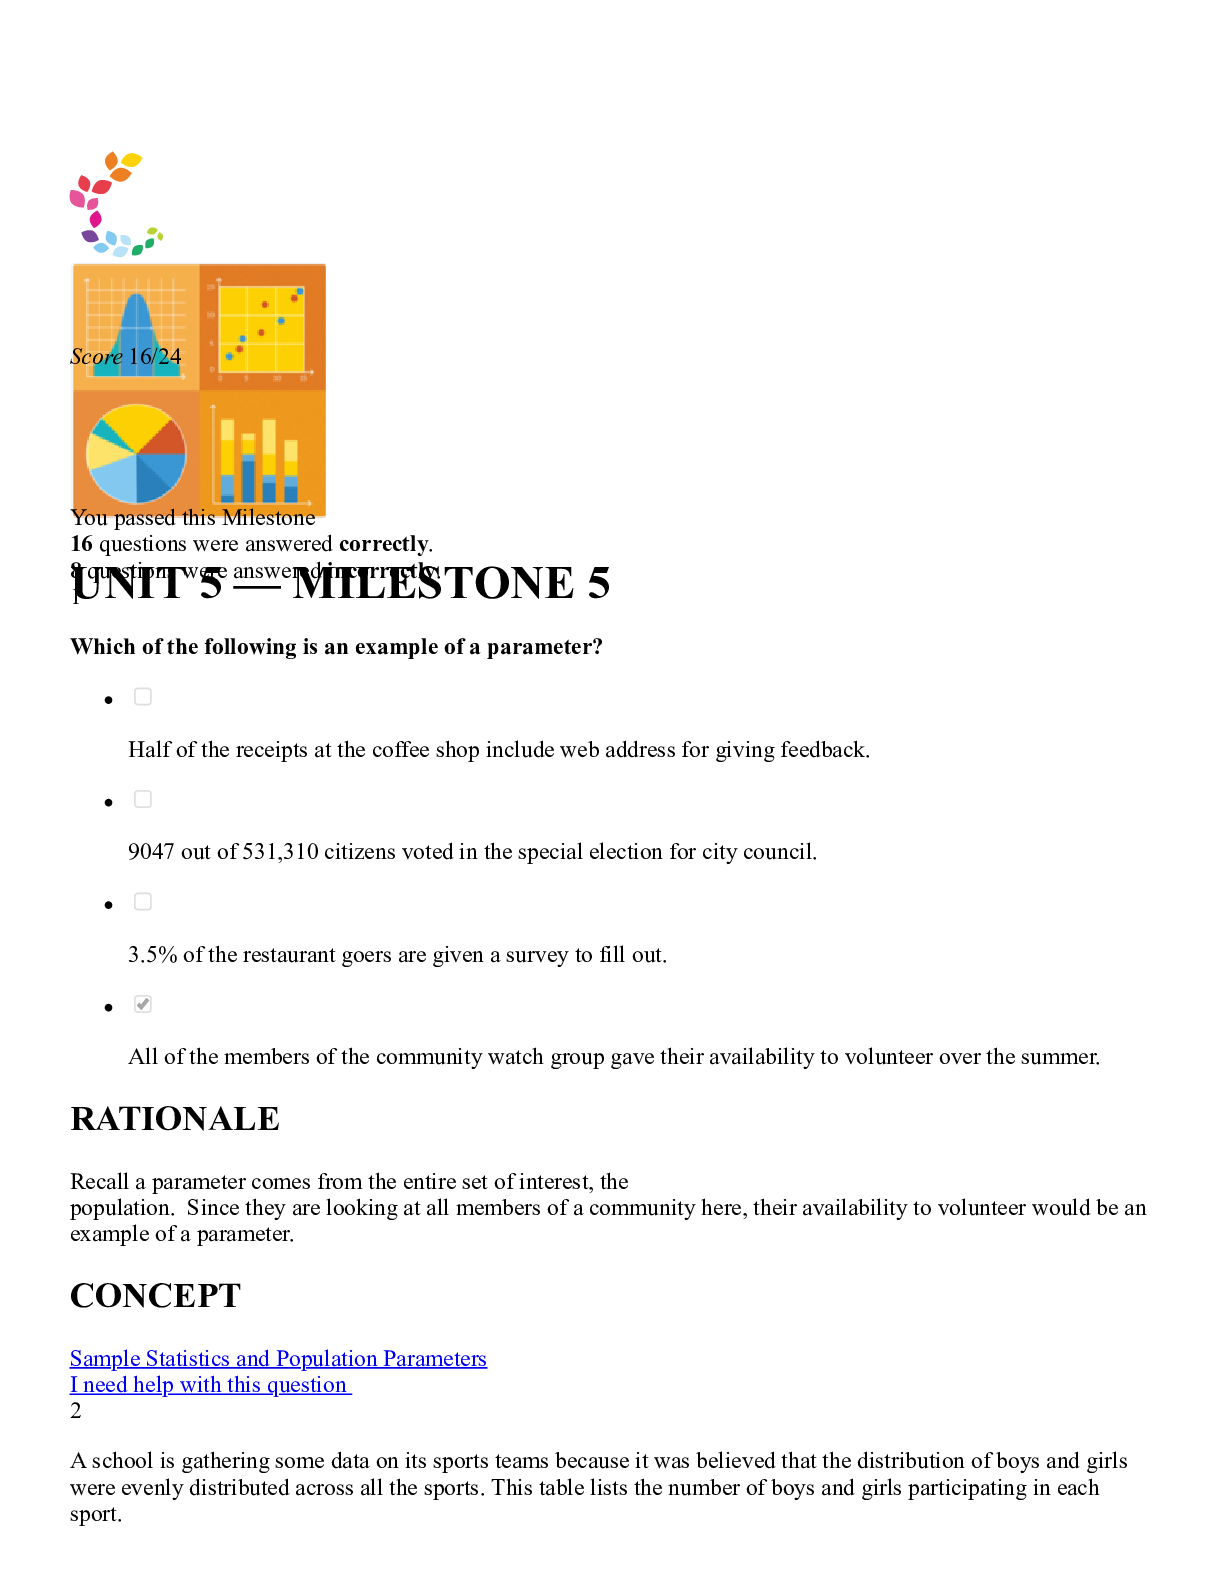
UNIT 5 — MILESTONE 5 Score 24/24 You passed this Milestone 24 questions were answered correctly. 1 Amanda is the owner of a small chain of dental offices. She sent out the yearly satisfaction s... urvey to 600 randomly selected patients and received 544 surveys back. When looking through the results, she noticed that the downtown dental office staff had 84% of clients reporting satisfaction with services, while the uptown dental office staff had 76% of clients reporting satisfaction with services. Which of the following sets shows Amanda's null hypothesis and alternative hypothesis? Null Hypothesis: The proportion of clients satisfied at the uptown office is 76%. Alternative Hypothesis: There is no difference in the satisfaction between the uptown and the downtown clients. Null Hypothesis: The proportion of clients satisfied at the downtown office is equal to the proportion of clients satisfied at the uptown office. Alternative Hypothesis: There is a difference in the satisfaction between the uptown and the downtown clients. Null Hypothesis: The proportion of clients satisfied at the downtown office is 84%. Alternative Hypothesis: Uptown clients are more satisfied with the dental office staff than downtown clients. Null Hypothesis: The proportion of clients satisfied at the downtown office is greater than the proportion of clients satisfied at the uptown office. Alternative Hypothesis: Downtown clients are less satisfied with the dental office staff than uptown clients. RATIONALE Recall that the null hypothesis is always of no difference. So the null hypothesis (Ho) is that the proportion of patients satisfied at the uptown clinic = proportion satisfied at the downtown clinic. This would indicate no difference between the two groups. The alternative hypothesis (Ha) is that there is difference in the proportion of patients satisfied between the two groups. CONCEPT Hypothesis Testing 2 Which of the following is an example of a parameter? Half of the receipts at the coffee shop include web address for giving feedback. 9047 out of 531,310 citizens voted in the special election for city council. All of the members of the community watch group gave their availability to volunteer over the summer. 3.5% of the restaurant goers are given a survey to fill out. RATIONALE 9/5/2021 Sophia :: Welcome https://app.sophia.org/spcc/introduction-to-statistics-2/milestone_take_feedbacks/10643930 2/14 Recall a parameter comes from the entire set of interest, the population. Since they are looking at all members of a community here, their availability to volunteer would be an example of a parameter. CONCEPT Sample Statistics and Population Parameters 3 Emile has calculated a one-tailed z-statistic of -1.97 and wants to see if it is significant at the 5% significance level. What is the critical value for the 5% significance level? Answer choices are rounded to the hundredths place. -1.04 -1.64 0 -2.33 RATIONALE Recall that when a test statistic is smaller than in a left-tailed test we would reject H₀. The closest value to 5%, or 0.05, in the table would be between 0.0505 and 0.495. 0.0505 corresponds with a z-score of -1.64 0.0495 corresponds with a z-score of -1.65. We need to calculate the average of the two z-scores to get a z-score of -1.645. CONCEPT How to Find a Critical Z Value 4 Carl recorded the number of customers who visited his new store during the week: Day Customers Monday 17 Tuesday 13 Wednesday 14 Thursday 16 He expected to have 15 customers each day. To answer whether the number of customers follows a uniform distribution, a chi-square test for goodness of fit should be performed. (alpha = 0.10) What is the chi-squared test statistic? Answers are rounded to the nearest hundredth. 1.60 2.33 0.40 0.67 9/5/2021 Sophia :: Welcome https://app.sophia.org/spcc/introduction-to-statistics-2/milestone_take_feedbacks/10643930 3/14 RATIONALE Using the chi-square formula we can note the test statistic is CONCEPT Chi-Square Test for Goodness-of-Fit 5 A table represents the number of students who passed or failed an aptitude test at two different campuses. South Campus North Campus Passed 42 31 Failed 58 69 In order to determine if there is a significant difference between campuses and pass rate, the chi-square test for association and independence should be performed. What is the expected frequency of South Campus and passed? [Show More]
Last updated: 1 year ago
Preview 1 out of 14 pages
Reviews( 0 )
Document information
Connected school, study & course
About the document
Uploaded On
Mar 30, 2022
Number of pages
14
Written in

Additional information
This document has been written for:
Uploaded
Mar 30, 2022
Downloads
0
Views
104